
What Is T Cell Activation Proteomics?
T cell activation proteomics is the high-resolution mass spectrometry-based characterization of protein abundance, phosphorylation dynamics, metabolic enzymes, and secretomes across resting (naive/memory), acutely triggered, and fully differentiated effector or exhausted T cell states.
Upon T cell receptor (TCR) and co-stimulatory (e.g., CD28, 4-1BB) engagement, T cells undergo a rapid biphasic transformation: an immediate post-translational kinase cascade (0.5–2 h) involving Lck, ZAP70, LAT, and downstream MAPK/NF-κB pathways, followed by massive metabolic reprogramming (aerobic glycolysis, one-carbon metabolism) and global proteome expansion (24–72 h) to support clonal expansion, cytokine release, and cytotoxic effector functions.
Quantitative mass spectrometry provides the unbiased, multi-parametric resolution required to evaluate primary T cell biology, therapeutic CAR-T design, checkpoint inhibitor mechanism of action, and immune exhaustion pathways.
Content Guide
- Biological Rationale
- Common Challenges
- Service Advantages
- Tailored Solutions
- Activation Marker Context
- Workflow
- Platform Decision Guide
- Sample Requirements
- Deliverables
The Limitations of Flow Cytometry vs Direct Proteomics
Conventional flow cytometry measures only 3–5 canonical surface markers (e.g., CD69, CD25, CD71), providing a binary "on/off" snapshot that obscures the underlying signaling architecture and metabolic fitness of activated T cells. Furthermore, flow cytometry cannot quantify active enzyme complexes (e.g., glycolytic enzymes, serine hydroxymethyltransferases), intracellular kinase phosphorylation networks, or transcription factor assemblies. Because activated T cells exhibit substantial translational buffering and rapid post-transcriptional regulation, mRNA transcript levels do not reliably correlate with actual functional protein abundance.
Direct LC-MS/MS proteomics eliminates single-marker bias by quantifying thousands of proteins simultaneously—providing an unbiased, multi-parametric molecular signature across primary human T cell subsets, engineered CAR-T constructs, and tumor-infiltrating lymphocytes (TILs).
When to Use T Cell Activation Proteomics
- You are optimizing CAR-T or TCR-T cell therapies and need to benchmark tonic signaling, co-stimulatory domain rewiring (CD28-CD3ζ vs. 4-1BB-CD3ζ), and metabolic exhaustion across manufacturing batches.
- You are dissecting TCR signaling kinetics and need paired 4D-phosphoproteomics (15–120 min) and global DIA abundance (24–72 h) to map kinase-substrate cascades to downstream effector outputs.
- You are evaluating checkpoint inhibitor mechanisms and need to profile the proteome and phosphoproteome of responder vs. non-responder T cells under PD-1, CTLA-4, or LAG-3 blockade.
- You are conducting CRISPR/Cas9 genetic perturbation screens in T cells to identify downstream compensatory pathways and phenotypic consequences of target gene knockout.
- You are profiling low-input, antigen-specific TILs sorted by peptide-MHC multimer staining and require high-depth 4D-DIA quantification from as few as 50,000 cells.
Challenges in T Cell Proteomics & How We Address Them
Overcoming primary donor variance, activation bead interference, signaling kinetics, and low input.

High Donor-to-Donor Baseline Variance
Primary human PBMC-derived T cells display significant inter-donor baseline variation. We enforce paired donor block designs and linear mixed-effects statistical models to isolate true activation-induced shifts from donor background noise.

Activation Bead & Antibody Carryover
Anti-CD3/CD28 magnetic dynabeads or soluble activation antibodies can contaminate cell lysates and suppress LC-MS dynamic range. We implement a standardized magnetic de-beading and stringent wash SOP prior to cell lysis.

Kinetic Disconnect: Signaling vs. Abundance
TCR triggering induces phosphorylation (ZAP70, LAT, Erk1/2) within 15–120 minutes, while total protein remodeling requires 24–48 hours. We deploy paired 4D-phosphoproteomics and global DIA across time-courses to capture both layers.

Precious Sample Constraints (Sorted TILs)
Antigen-specific T cells and tumor-infiltrating lymphocytes are often limited to 50,000–200,000 cells. Our high-sensitivity 4D-DIA (dia-PASeF) platform quantifies >5,500+ proteins from as little as 500 ng of total protein.

CD4+ vs. CD8+ Lineage-Specific Rewiring
Helper CD4+ and cytotoxic CD8+ T cells exhibit divergent metabolic and effector programs upon activation. We offer lineage-purified sorting alongside unseparated PBMC profiling to capture subset-specific biology.

Effector vs. Exhaustion State Ambiguity
Distinguishing functional effector T cells from early exhausted T cells requires multi-protein trajectory scoring (TOX, TCF-1, PD-1, LAG-3) rather than single checkpoint markers, which our bioinformatics package resolves.
T Cell Activation Proteomics Service Advantages

Comprehensive Proteome Depth
6,500–8,500+ Proteins / Run
Deep single-shot DIA profiling captures low-abundance transcription factors, cytokines, cytotoxic granzymes, and surface immune checkpoints.

Dynamic Phosphoproteomics
15,000–25,000+ Phosphosites
Microscale Ti-IMAC/Fe-NTA enrichment captures acute kinase activation cascades and substrate phosphorylation networks (TCR, CD28, 4-1BB).

CAR-T & Cell Therapy Ready
Tonic Signaling & Exhaustion
Benchmarking basal phosphorylation, co-stimulatory signaling domains, and metabolic fitness across engineered T cell product candidates.

Microscale Sensitivity
As Low As 5×10⁴ Cells
High-sensitivity 4D-DIA (dia-PASeF) enables robust quantification from rare antigen-specific tetramer+ T cells and limited biopsy TILs.

Paired Donor Normalization
Donor-Matched Precision
Linear mixed-effects modeling eliminates primary human donor baseline variance, isolating true activation and drug perturbation effects.

Multi-Model Compatibility
Human · Mouse · CAR-T · Jurkat
Validated SOPs across primary human pan-T/CD4/CD8 cells, murine OT-I/OT-II splenocytes, CAR-T/TCR-T constructs, and Jurkat models.
T Cell Activation Proteomics Tailored to Your Needs
Choose from discovery DIA, 4D-phosphoproteomics, CAR-T profiling, or targeted validation modules.

Discovery DIA / 4D-DIA Proteomics
- Global, label-free profiling capturing >6,500–8,500+ protein groups across resting and activated T cell states.
- Quantifies metabolic switches (glycolysis, one-carbon pathway) and surface receptor remodeling.

4D Phosphoproteomics & TCR Kinetics
- Enrichment for acute TCR/CD28 signaling cascades (ZAP70, LAT, SLP-76, MAPK, NF-κB).
- Site-level localization, motif analysis, and Kinase-Substrate Enrichment Analysis (KSEA).
CAR-T & Engineered T Cell Proteomics
- Evaluation of tonic signaling, exhaustion trajectory, and co-stimulatory signaling (CD28 vs. 4-1BB).
- Proteomic benchmarking across healthy donors, manufacturing runs, and patient batches.

Targeted PRM/MRM Validation Panels
- High-selectivity multiplexed verification of curated T cell activation and checkpoint panels (20–60 targets).
- Absolute or relative quantification across large-scale drug screening cohorts.
T Cell Activation States, Stimuli, and Marker-Panel Context
Match your model system and experimental question with the appropriate molecular readout.
| T Cell State / Phase | Induction Stimuli & Context | Representative Proteomic & Metabolic Signatures |
|---|---|---|
| Naive / Resting State | Homeostatic maintenance with IL-7 (5 ng/mL) | CD62L (SELL), CCR7, IL-7R (CD127), CD45RA; high fatty acid oxidation (CPT1A) and balanced mitochondrial OXPHOS. |
| Early Activated / TCR Triggered (0.5–2 h Post-Stimulation) |
Anti-CD3/CD28 crosslinking or peptide-MHC | Phospho-ZAP70 (Tyr319), phospho-LAT, phospho-Erk1/2, rapid CD69 upregulation, calcium flux signaling machinery. |
| Effector Blast Phase (24–72 h Post-Stimulation) |
Sustained TCR/CD28 + IL-2 (20–100 U/mL) | CD25 (IL-2RA), CD71 (TFRC), IFN-γ, TNF-α, Granzyme B (GZMB), Perforin; high glycolysis (GLUT1, HK2, LDHA) and one-carbon metabolism (SHMT2, MTHFD2). |
| CAR-T / Tonic Signaling State | Engineered CAR constructs (CD28-CD3ζ vs. 4-1BB-CD3ζ) | Basal CD3ζ phosphorylation, constitutive NF-κB/Akt signaling; 4-1BB constructs exhibit enhanced mitochondrial mass (PGC-1α) and spare respiratory capacity. |
| Exhausted T Cell State (Tex) | Chronic antigen exposure, TGF-β, Hypoxia | PD-1 (PDCD1), TIM-3 (HAVCR2), LAG-3, TIGIT, CD39 (ENTPD1), TOX, down-regulation of TCF-1 (TCF7); mitochondrial metabolic collapse. |
| Memory T Cells (Tcm / Tem) | IL-7 / IL-15 recall and antigen withdrawal | CD62L, CCR7 (Tcm), CD45RO, BCL-2, TCF-1, Eomes/T-bet balance; high fatty acid oxidation and mitochondrial spare respiratory capacity. |
Step-by-Step T Cell Activation Proteomics Workflow
At Creative Proteomics, our T cell activation proteomics workflow is optimized for reproducibility, depth, and biological relevance at every stage.
Define T cell model (primary human CD4/CD8, CAR-T, OT-I/OT-II, Jurkat), activation stimuli, time-course points, and paired donor blocking structure.
Perform rapid ice-cold PBS washing (≤15 s), magnetic de-beading to eliminate bead carryover, and direct lysis with phosphatase preservation.
Robotic S-Trap or magnetic SP3 processing with trypsin/Lys-C digestion, peptide quantification, and spike-in iRT process controls.
Single-shot DIA or 4D-DIA (dia-PASeF on timsTOF Pro 2) or high-field Orbitrap instruments with interleaved pooled QC injections.
Evaluation of peptide digest efficiency, pooled QC quantitative CV (<15%), retention-time stability, and donor-paired mixed-effects modeling.
Differential protein expression (limma FDR ≤ 0.05), activation trajectory scoring, metabolic pathway GSEA, KSEA kinase networks, and PRM shortlists.
- Activation-resolved design: resolve continuous activation & exhaustion spectra
- Paired-donor consistency: eliminate primary PBMC donor baseline variation
- Microscale capability: robust 4D-DIA profiling from as few as 50,000 sorted TILs
- Dual-layer readouts: paired 4D-phosphoproteomics and global proteome remodeling
T Cell Proteomics Analytical Platform Decision Guide
Match your T cell sample type, cohort scale, and biological question with the optimal acquisition strategy and mass spectrometry platform.
| Study Objective & Scenario | Recommended Strategy | Primary MS Platform | Technical Rationale & Deliverables |
|---|---|---|---|
| Global Activation & Metabolic Profiling (Purified CD4/CD8 / Cell Lines / Jurkat) |
Discovery DIA Quantitative Proteomics | Orbitrap Astral / Exploris 480 / timsTOF Pro 2 | Single-shot depth (>6,500–8,500+ proteins), CV < 15%, deep coverage of metabolic enzymes, transcription factors, and cytokine effectors. |
| Microscale & Rare Sorted Subsets (Antigen-Specific Tetramer+ / TILs) |
High-Sensitivity 4D-DIA (dia-PASeF) | timsTOF Pro 2 / timsTOF Ultra | TIMS ion mobility maximizes ion utilization and peak capacity, enabling deep quantification from as few as 5×10⁴ to 2×10⁵ cells (500 ng – 2 μg protein). |
| Acute TCR Signaling & Kinase Cascades (15–120 min Time-Course Kinetics) |
4D Phosphoproteomics (Ti-IMAC / Fe-NTA Enrichment) |
timsTOF Pro 2 (TIMS-DIA) / Orbitrap Exploris 480 | Resolves isomeric phosphopeptides, localizes regulatory phosphosites (>15,000–25,000+ sites), and drives KSEA master kinase activity inference. |
| CAR-T Tonic Signaling & Exhaustion (Engineered Cell Products / CD28 vs. 4-1BB) |
Paired 4D-Phospho + Global DIA | timsTOF Pro 2 / Orbitrap Exploris 480 | Simultaneous measurement of basal receptor phosphorylation, exhaustion transcription factors (TOX, TCF-1), and mitochondrial spare capacity. |
| Targeted Biomarker & Screening Validation (Large Cohorts / Compound Screening) |
Targeted PRM / 4D-PRM Panels | Orbitrap PRM / Triple Quadrupole (TSQ Altis / QTRAP 6500+) | Absolute or high-precision relative quantification of curated 20–60 T cell marker panels with high throughput and zero missing values. |
Sample Requirements and Submission Guidelines

De-beading protocol: If using anti-CD3/CD28 magnetic beads, remove beads completely using a magnetic separator before cell lysis.
Phosphoproteomics: Lyse immediately in buffer containing protease and phosphatase inhibitors (PhosSTOP, sodium orthovanadate).
| Sample Category | Recommended Input | Storage & Handling |
|---|---|---|
| Standard T Cell Pellets (Global DIA) | 1–5 × 10⁶ cells (20–50 μg protein) | Wash 2× with cold PBS; snap-freeze pellet; ship on dry ice (-80°C) |
| Microscale / Sorted TILs (FACS) | 1–5 × 10⁵ cells (1–5 μg protein) | Sort into low-binding tubes with lysis buffer; snap-freeze; ship on dry ice |
| T Cell Phosphoproteomics | 5–10 × 10⁶ cells (100–200 μg protein) | Lyse with PhosSTOP & 1 mM orthovanadate; flash-freeze; ship on dry ice |
| CAR-T / TCR-T Cell Formulations | 2–5 × 10⁶ cells per condition | Document construct design & transduction efficiency; ship on dry ice |
| Pre-Extracted T Cell Lysates | 20–50 μL at 1–2 mg/mL | SDS/RapiGest buffer; BCA quantified; ship on dry ice |
Not sure about sample requirements?
Contact us — our scientific team will evaluate your sample type and design the optimal preparation strategy.
What You'll Receive from Our T Cell Proteomics Service
Quantitative data, quality documentation, and publication-ready biological insights
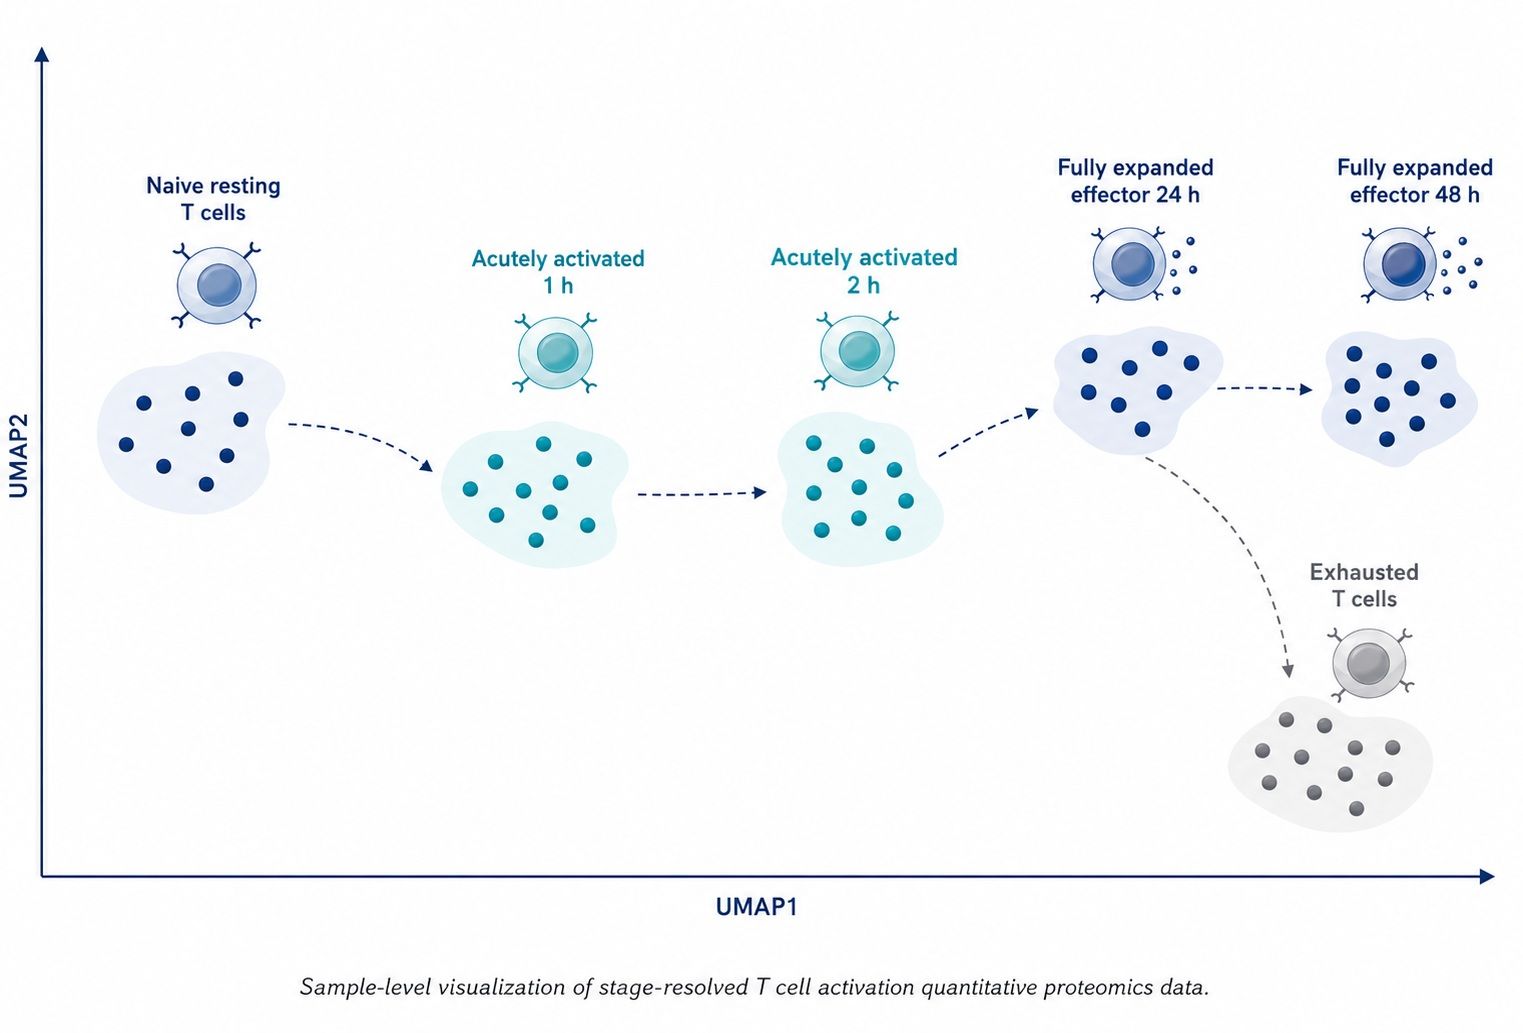
Sample-level PCA/UMAP assesses whether quantitative profiles organize according to resting, activated, and exhausted T cell states.
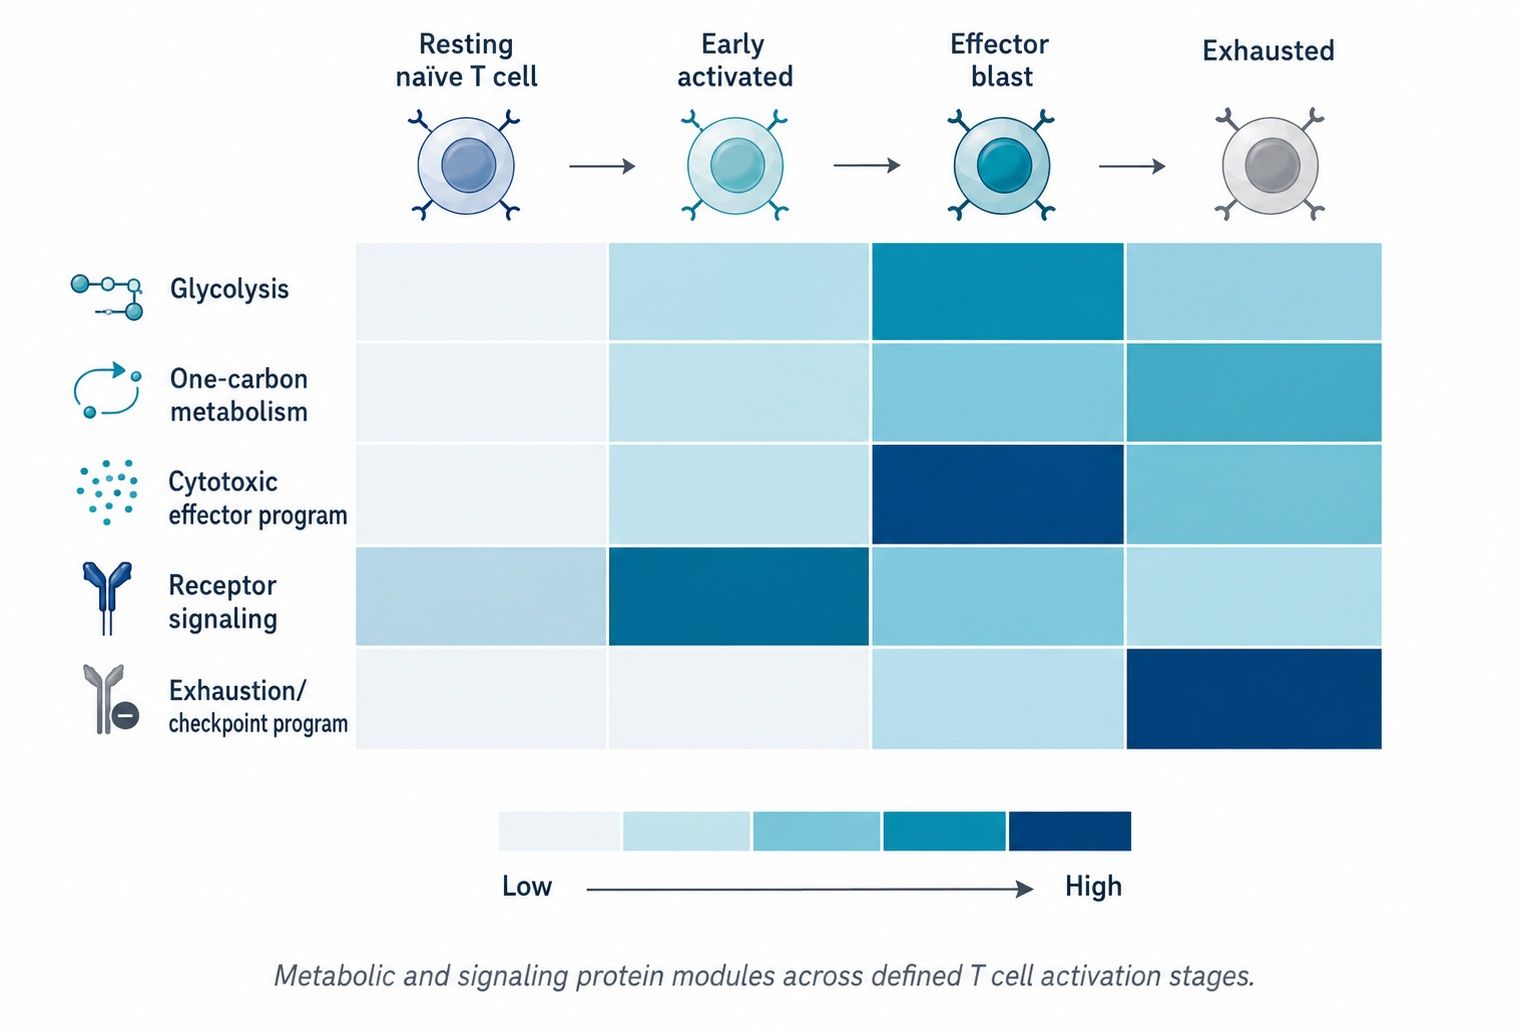
Hierarchical clustering identifies metabolic enzyme modules (glycolysis, one-carbon flux) and surface receptor dynamics.
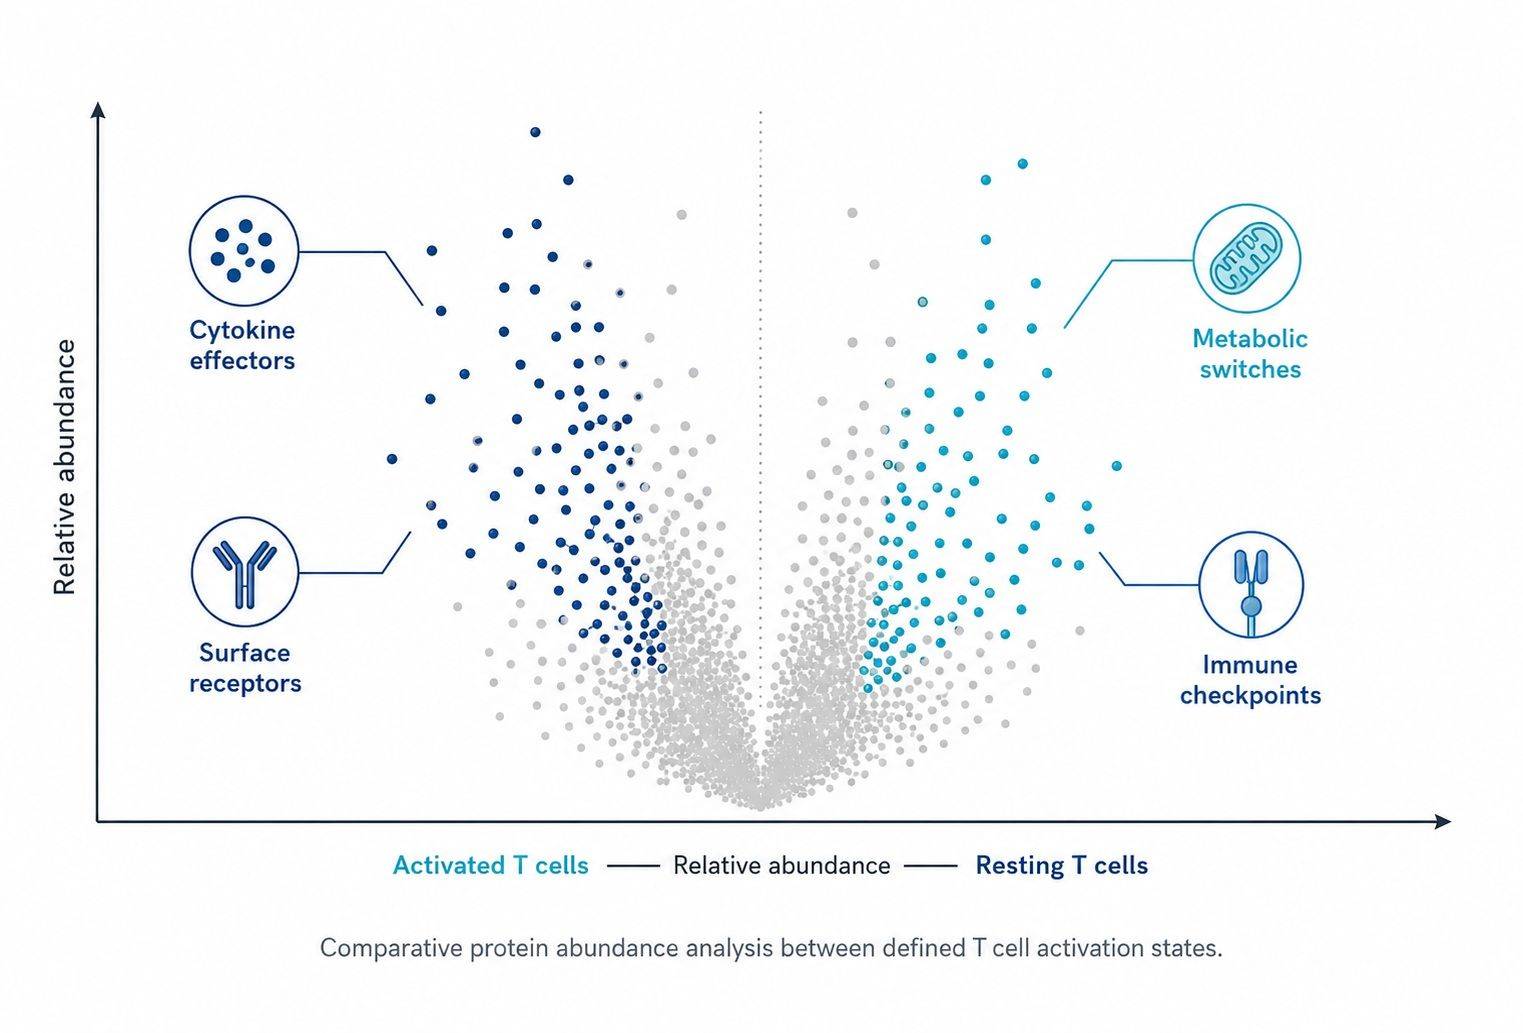
Pairwise contrasts (Activated vs. Resting, CAR-T CD28 vs. 4-1BB) prioritize significant effector cytokines, checkpoints, and metabolic enzymes.
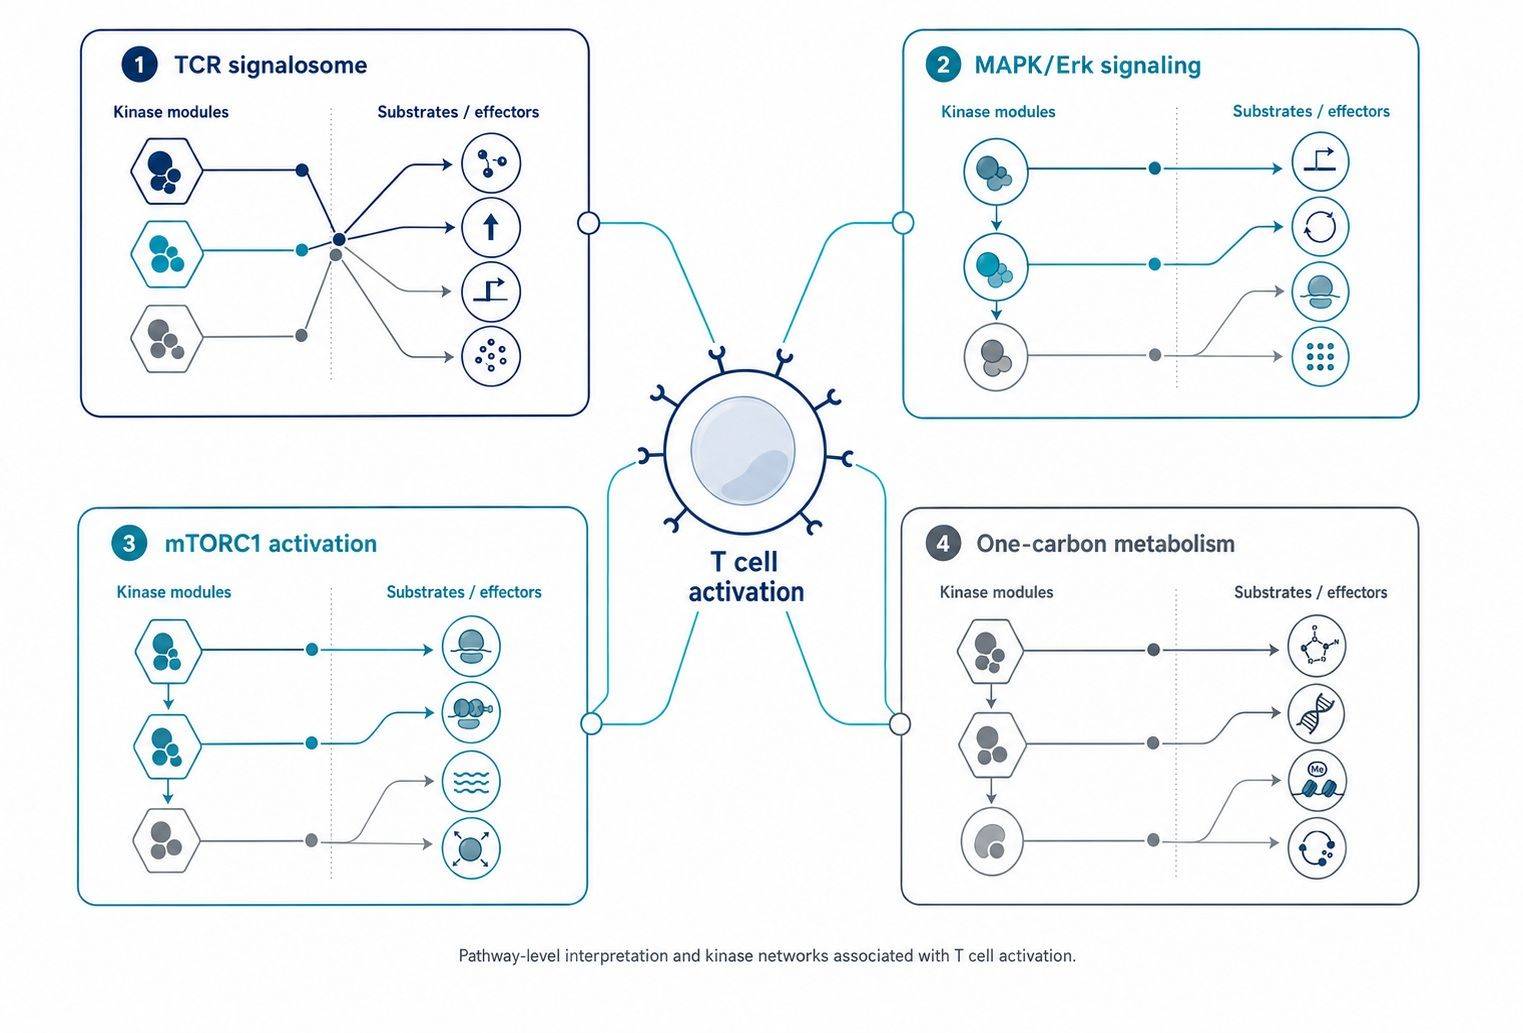
GSEA pathway enrichment and KSEA kinase networks provide deep mechanistic context for TCR signaling cascades and metabolic shifts.

Quantitative Data Tables
- Normalized protein-, peptide-, and phosphosite-level intensity matrices with complete experimental and donor metadata.

Quality Assessment Summary
- Sample-level review, digestion completeness metrics, pooled QC CV distributions, and donor variance decomposition.

Comparative & Trajectory Analysis
- Pairwise statistical contrasts, Benjamini-Hochberg FDR correction, and activation-to-exhaustion trajectory scorecards.

Pathway & Kinase Networks
- Gene Ontology (GO), KEGG, and Reactome GSEA enrichment, plus KSEA kinase-substrate network mapping.

Bioinformatics & Reporting
- Comprehensive final project report with publication-ready figures and prioritized targeted PRM validation candidate shortlists.