
What Is Ferroptosis Proteomics?
Ferroptosis proteomics is the mass spectrometry-based identification and quantification of protein abundance, post-translational modifications (PTMs), metabolic enzymes, and regulatory networks across basal, ferroptosis-induced, and inhibitor-rescued cellular and tissue states.
Unlike apoptosis or necroptosis, ferroptosis execution is dictated by a metabolic imbalance between pro-ferroptotic lipid peroxidation drivers (e.g., ACSL4, LPCAT3, ALOXs, labile Fe2+) and multi-layered antioxidant defense systems: the canonical System xc-/GSH/GPX4 axis, the cytosolic FSP1-CoQ10 pathway, the mitochondrial DHODH system, and the GCH1-BH4 pathway. While transcriptomics indicates gene expression potential, quantitative proteomics directly measures functional protein abundance, degradation kinetics (e.g., NCOA4-mediated ferritinophagy, GPX4 alkylation/degradation), and stress-activated kinase rewiring.
Integrated with orthogonal rescue controls, high-depth proteomics provides the definitive molecular framework to evaluate ferroptosis inducers (Erastin, RSL3, FIN56, IKE), identify biomarker signatures, and overcome cancer drug resistance.
Content Guide
- Biological Rationale
- Common Challenges
- Service Advantages
- Tailored Solutions
- Ferroptosis Pathway Context
- Workflow
- Platform Decision Guide
- Sample Requirements
- Deliverables
The Limitations of Endpoint Assays vs Direct Proteomics
Standard ferroptosis endpoint assays—such as BODIPY 581/591 C11 lipid peroxidation staining, malondialdehyde (MDA) quantification, or cell viability dyes—only confirm whether lipid ROS and cell death occurred. They cannot reveal which defense axis was compromised, how the cellular proteome adapted to sublethal oxidative stress, or what compensatory survival pathways were activated in resistant persister cells.
Quantitative LC-MS/MS proteomics provides an unbiased, systems-level view of ferroptosis regulation—quantifying thousands of proteins simultaneously across iron transport, PUFA phospholipid remodeling, glutathione biosynthesis, mitochondrial metabolism, and NRF2-mediated antioxidant stress responses.
When to Use Ferroptosis Proteomics
- You are developing novel ferroptosis-inducing therapeutics (small molecules, PROTACs, antibody-drug conjugates) and need to establish their target selectivity, mechanism of action, and downstream proteomic consequences.
- You are overcoming therapy resistance in cancer (e.g., therapy-resistant persister cells, mesenchymal/EMT-high carcinomas, renal cell carcinoma) and need to identify synthetic lethal vulnerabilities within ferroptosis defense pathways.
- You are investigating ischemia-reperfusion injury or neurodegeneration (stroke, myocardial infarction, acute kidney injury, Parkinson's disease) where suppressing pathological ferroptosis is the primary therapeutic goal.
- You are dissecting multi-axis defense redundancies to determine whether resistance to GPX4 inhibition is driven by compensatory upregulation of FSP1, DHODH, or GCH1 pathways.
- You are conducting CRISPR gene perturbations (e.g., knockout of GPX4, SLC7A11, ACSL4, NCOA4) and must validate protein-level depletion, off-target phenotypic drift, and compensatory adaptations.
Challenges in Ferroptosis Proteomics & How We Address Them
Overcoming non-specific cytotoxicity, defense redundancy, lipid oxidation artifacts, and tissue heterogeneity.

Distinguishing Ferroptosis from Non-Specific Cytotoxicity
Late-stage cell death leads to non-specific proteome degradation. We mandate early sub-lethal time points (2–12 h) and include strict pharmacological rescue arms (± Ferrostatin-1 / Liproxstatin-1 / DFO) to isolate authentic ferroptosis mechanisms.

Multi-Axis Defense Pathway Redundancy
Inhibition of GPX4 often triggers compensatory survival via FSP1-CoQ10, DHODH, or NRF2 signaling. Our global DIA proteomic profiling simultaneously monitors all known defense axes in a single unbiased run.

Pre-Analytical Lipid Peroxidation Artifacts
Ex vivo cell harvesting can cause atmospheric autoxidation and artificial stress kinase activation. We enforce rapid cold washing (≤15 s) and immediate lysis with antioxidant-supplemented extraction buffers.

Dynamic Post-Translational Degradation of GPX4 & Ferritin
Compounds like FIN56 or autophagy inducers induce rapid degradation of GPX4 and FTH1 (ferritinophagy). We deploy paired temporal proteome profiling to resolve degradation kinetics from transcriptional changes.

Tissue Heterogeneity in In Vivo Disease Models
Organ injury models (AKI, stroke, I/R) contain mixed cell types with localized ferroptosis foci. Our high-sensitivity 4D-DIA platform supports microdissected tissue and low-input sorted cell populations.

Persister Cell & Drug Resistance Ambiguity
Differentiating true ferroptosis sensitivity from acquired metabolic adaptation requires comprehensive pathway scoring (PUFA acylation, iron import, antioxidant reserve), which our bioinformatics pipeline provides.
Ferroptosis Proteomics Service Advantages

Comprehensive Proteome Depth
6,500–8,500+ Proteins / Run
Deep single-shot DIA profiling captures low-abundance transcription factors (NRF2, ATF4), iron transporters, and metabolic enzymes without missing values.

Dynamic Phosphoproteomics
15,000–25,000+ Phosphosites
Microscale Ti-IMAC/Fe-NTA enrichment captures acute stress kinase activation cascades (p38 MAPK, JNK, AMPK, ATM/ATR) preceding lipid peroxidation.

Orthogonal Rescue Validation
Fer-1 & Lip-1 Controlled
Rigorous factorial study designs (Vehicle vs. Inducer ± Ferrostatin-1 / Liproxstatin-1) to isolate genuine ferroptosis-dependent protein shifts.

Microscale Sensitivity
As Low As 5×10⁴ Cells
High-sensitivity 4D-DIA (dia-PASeF) enables robust quantification from scarce persister cells, sorted primary cells, and microscale biopsy tissues.

Multi-Pathway Coverage
GPX4 · FSP1 · DHODH · GCH1
Simultaneous quantification of all canonical and non-canonical antioxidant defenses, iron regulatory proteins, and PUFA lipid remodeling enzymes.

Multi-Model Compatibility
Cancer · Organoids · In Vivo Tissues
Validated SOPs across cancer cell lines, 3D organoid models, CRISPR knockouts (GPX4, SLC7A11, ACSL4), and in vivo organ injury tissues.
Ferroptosis Proteomics Tailored to Your Needs
Choose from discovery DIA, 4D-phosphoproteomics, drug MoA rescue, or targeted validation modules.

Discovery DIA / 4D-DIA Proteomics
- Global, label-free profiling capturing >6,500–8,500+ protein groups across basal, induced, and rescued states.
- Quantifies lipid metabolic remodeling (ACSL4, LPCAT3) and antioxidant pathway switches.

4D Phosphoproteomics & Stress Kinetics
- Enrichment for acute stress signaling cascades (p38 MAPK, JNK, AMPK, ATM, PERK/eIF2α).
- Site-level localization, motif analysis, and Kinase-Substrate Enrichment Analysis (KSEA).
Drug Mechanism & Rescue Validation Profiling
- Factorial study design (Compound ± Ferrostatin-1 / Liproxstatin-1 / DFO) to confirm on-target ferroptotic action.
- Evaluates target degradation kinetics (GPX4, FTH1) and compensatory survival pathways.

Targeted PRM/MRM Validation Panels
- High-selectivity multiplexed verification of curated ferroptosis marker panels (20–60 targets).
- Absolute or relative quantification across large-scale compound screening or animal cohorts.
Ferroptosis Regulatory Pathways, Stimuli, and Marker-Panel Context
Match your model system and experimental question with the appropriate molecular readout.
| Regulatory Axis / Module | Key Inducers / Perturbations | Representative Proteomic & Metabolic Signatures |
|---|---|---|
| System xc- / GSH / GPX4 Axis (Canonical Defense System) |
Erastin, IKE, Sorafenib (System xc-); RSL3, ML162, FIN56 (GPX4) | SLC7A11 (xCT), SLC3A2 (4F2hc), GCLC/GCLM, GPX4, CHAC1, CBS/CTH (transsulfuration pathway upregulation). |
| FSP1-CoQ10 Axis (GSH-Independent Defense) |
iFSP1 (FSP1 inhibitor) + GPX4 inhibitors | FSP1 (AIFM2), CoQ biosynthesis enzymes (COQ2, COQ7), NAD(P)H:quinone oxidoreductase activity; lipid radical trapping. |
| DHODH Mitochondrial Axis (Mitochondrial Defense) |
Brequinar, Leflunomide (DHODH inhibitors) | DHODH, mitochondrial Complex II/III enzymes, mitochondrial ubiquinol generation independent of cytosolic GPX4. |
| GCH1-BH4 Axis (Lipid Remodeling Defense) |
GCH1 knockout or pharmacological inhibition | GCH1, PTS, SPR (tetrahydrobiopterin synthesis enzymes), selective depletion of polyunsaturated fatty acid tails. |
| PUFA Lipid Acylation & Peroxidation (Execution Machinery) |
Thiazolidinediones (ACSL4 inh), Rosiglitazone | ACSL4, LPCAT3, ALOX12, ALOX15, POR (cytochrome P450 oxidoreductase), ether lipid synthesis enzymes (AGPS, FAR1). |
| Iron Metabolism & Ferritinophagy (Labile Iron Pool Regulation) |
DFO, Deferiprone (iron chelators); Holo-Transferrin | TFRC (CD71 upregulation), FTH1, FTL, NCOA4 (ferritinophagy mediator), HMOX1 (heme oxygenase-1), IREB2/IRP2. |
Step-by-Step Ferroptosis Proteomics Workflow
At Creative Proteomics, our ferroptosis proteomics workflow is optimized for reproducibility, depth, and biological relevance at every stage.
Define cell/tissue model, inducer concentration/time-course, and mandatory pharmacological rescue arms (± Ferrostatin-1 / Liproxstatin-1 / DFO).
Perform rapid cold washing (≤15 s), direct lysis with SDS/S-Trap buffer containing protease, phosphatase, and lipid antioxidant stabilizers.
Robotic S-Trap or magnetic SP3 processing with trypsin/Lys-C digestion, peptide quantification, and spike-in iRT process controls.
Single-shot DIA or 4D-DIA (dia-PASeF on timsTOF Pro 2) or high-field Orbitrap instruments with interleaved pooled QC injections.
Evaluation of peptide digest efficiency, pooled QC quantitative CV (<15%), retention-time stability, and 2×2 factorial interaction modeling.
Differential expression (limma FDR ≤ 0.05), ferroptosis vulnerability index scoring, GSEA pathway enrichment, KSEA kinase networks, and PRM shortlists.
- Rescue-controlled design: isolate authentic ferroptotic shifts from non-specific lysis
- Multi-axis defense mapping: simultaneously quantify GPX4, FSP1, DHODH, and GCH1 pathways
- Microscale capability: robust 4D-DIA profiling from as few as 50,000 cells or biopsy tissue
- Dual-layer readouts: paired 4D-phosphoproteomics and global proteome remodeling
Ferroptosis Proteomics Analytical Platform Decision Guide
Match your ferroptosis sample type, cohort scale, and biological question with the optimal acquisition strategy and mass spectrometry platform.
| Study Objective & Scenario | Recommended Strategy | Primary MS Platform | Technical Rationale & Deliverables |
|---|---|---|---|
| Global Mechanism & Defense Profiling (Cancer Cell Lines / In Vitro Models) |
Discovery DIA Quantitative Proteomics | Orbitrap Astral / Exploris 480 / timsTOF Pro 2 | Single-shot depth (>6,500–8,500+ proteins), CV < 15%, deep coverage of all antioxidant axes (GPX4, FSP1, DHODH) and lipid remodeling enzymes. |
| Microscale & Precious In Vivo Samples (Needle Biopsies / Organoid Models) |
High-Sensitivity 4D-DIA (dia-PASeF) | timsTOF Pro 2 / timsTOF Ultra | TIMS ion mobility maximizes ion utilization and peak capacity, enabling deep quantification from as few as 5×10⁴ to 2×10⁵ cells (500 ng – 2 μg protein). |
| Acute Stress Kinase & Early Signaling (0.5–6 h Time-Course Kinetics) |
4D Phosphoproteomics (Ti-IMAC / Fe-NTA Enrichment) |
timsTOF Pro 2 (TIMS-DIA) / Orbitrap Exploris 480 | Resolves isomeric phosphopeptides, localizes regulatory phosphosites (>15,000–25,000+ sites), and drives KSEA stress kinase activity inference (p38/JNK/AMPK). |
| Drug Target Engagement & Degradation (Novel Inducers / PROTAC Kinetics) |
Paired Abundance + Degradation Profiling | timsTOF Pro 2 / Orbitrap Exploris 480 | Quantifies degradation rates of target enzymes (GPX4, FTH1) versus transcriptional compensation (NRF2, CHAC1, ATF4) across concentration series. |
| Targeted Biomarker & Screening Validation (Large Cohorts / In Vivo Disease Models) |
Targeted PRM / 4D-PRM Panels | Orbitrap PRM / Triple Quadrupole (TSQ Altis / QTRAP 6500+) | Absolute or high-precision relative quantification of curated 20–60 ferroptosis biomarker panels with high throughput and zero missing values. |
Sample Requirements and Submission Guidelines

Cold-chain protocol: Wash monolayers with ice-cold PBS (≤15 s), snap-freeze cell pellets in liquid N₂, and ship on dry ice (-80°C).
Inhibitor controls: Include vehicle and rescue-inhibitor controls (Ferrostatin-1 / Liproxstatin-1) processed in parallel under identical conditions.
| Sample Category | Recommended Input | Storage & Handling |
|---|---|---|
| Standard Cell Pellets (Global DIA) | 1–5 × 10⁶ cells (20–50 μg protein) | Wash 2× with cold PBS; snap-freeze pellet; ship on dry ice (-80°C) |
| Fresh-Frozen Tissue (AKI, Stroke, I/R) | ≥ 20–50 mg wet weight | Dissect rapidly; snap-freeze in liquid N₂; ship on dry ice (-80°C) |
| Microscale / Sorted Cells (FACS) | 1–5 × 10⁵ cells (1–5 μg protein) | Sort into low-binding tubes with lysis buffer; snap-freeze; ship on dry ice |
| Ferroptosis Phosphoproteomics | 5–10 × 10⁶ cells (100–200 μg protein) | Lyse with PhosSTOP & 1 mM orthovanadate; flash-freeze; ship on dry ice |
| Pre-Extracted Lysates | 20–50 μL at 1–2 mg/mL | SDS/RapiGest buffer; BCA quantified; ship on dry ice |
Not sure about sample requirements?
Contact us — our scientific team will evaluate your sample type and design the optimal preparation strategy.
What You'll Receive from Our Ferroptosis Proteomics Service
Quantitative data, quality documentation, and publication-ready biological insights
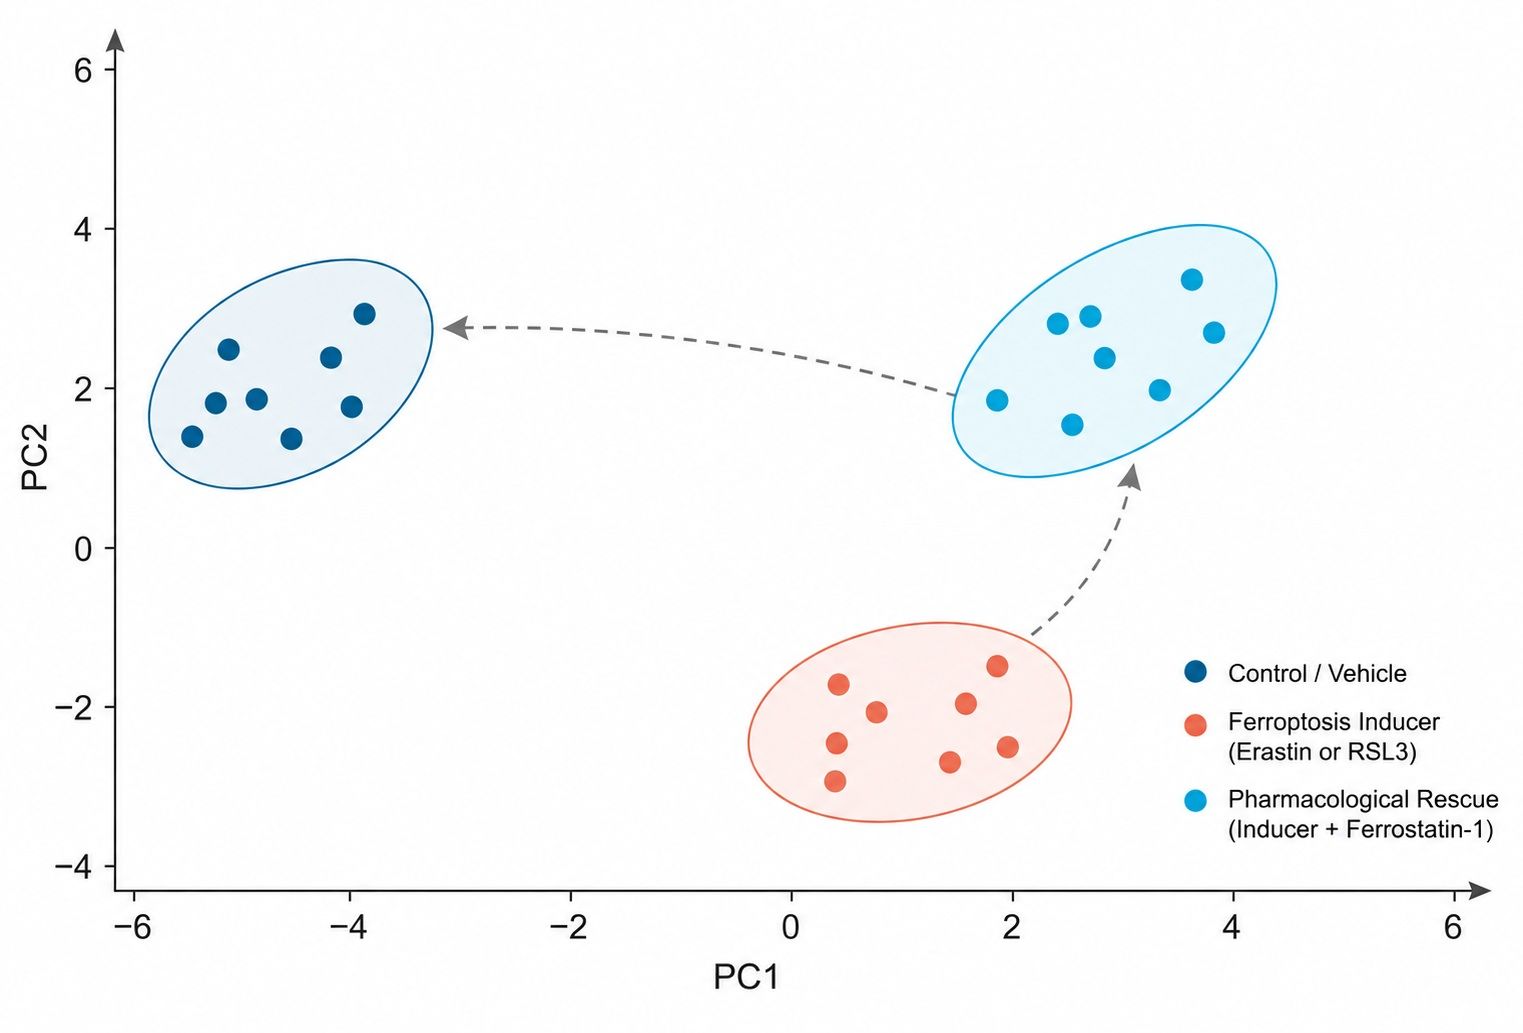
Sample-level PCA/UMAP assesses whether quantitative profiles organize according to basal, inducer-treated, and inhibitor-rescued states.
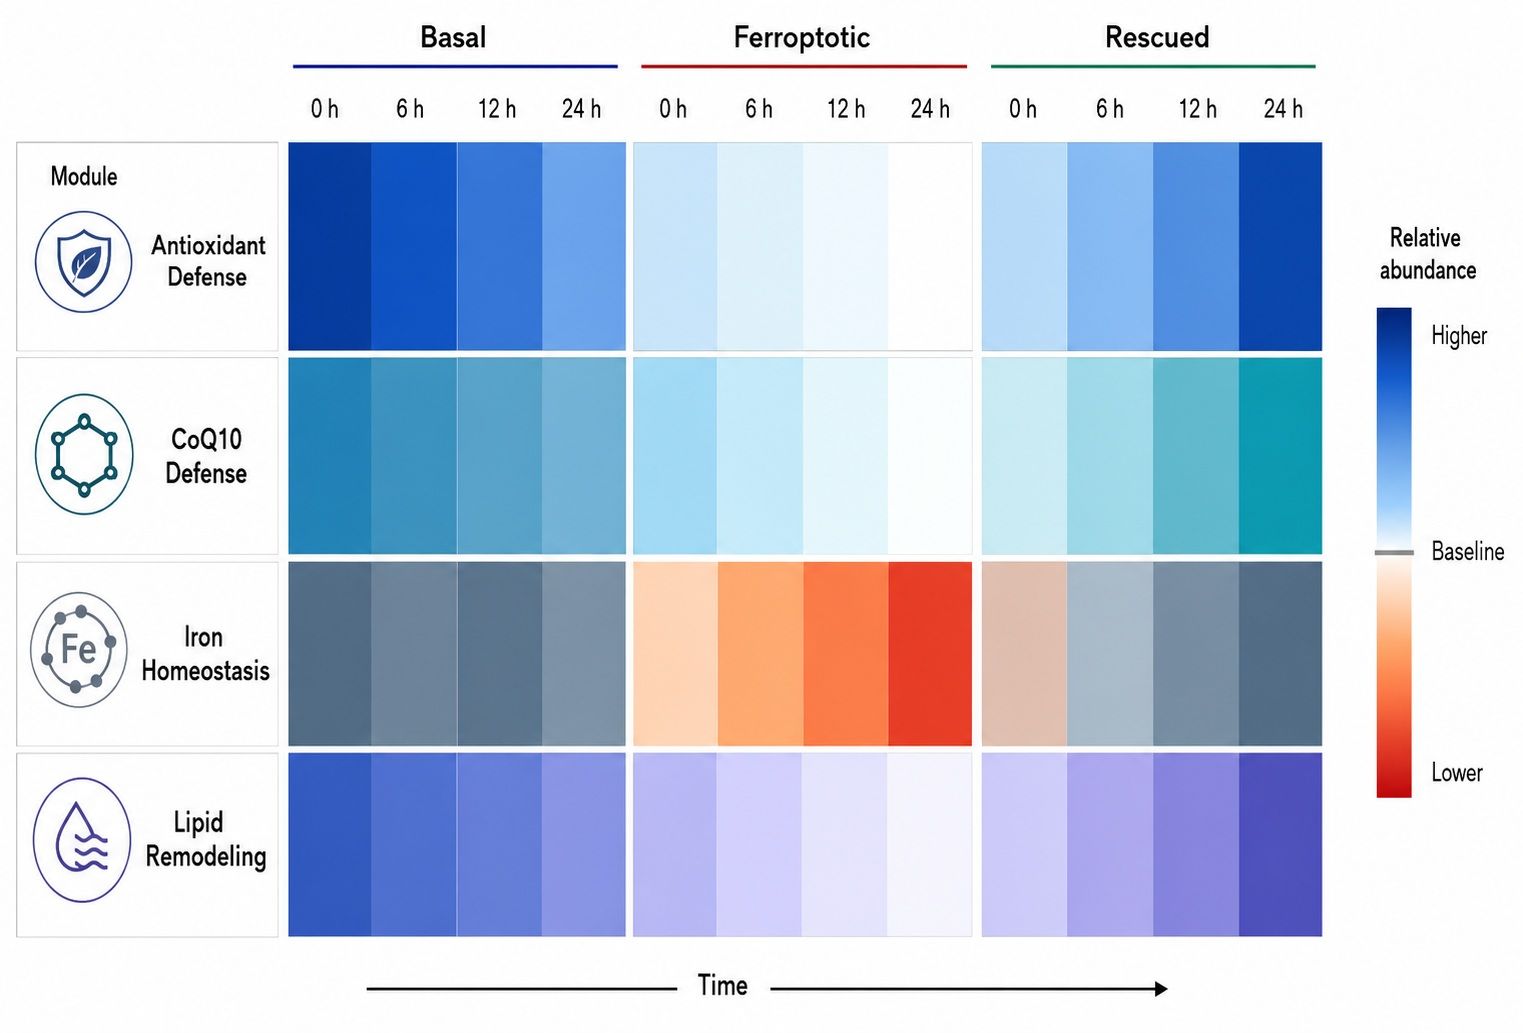
Hierarchical clustering identifies coordinated enzyme modules across GPX4, FSP1, DHODH, and PUFA phospholipid pathways.
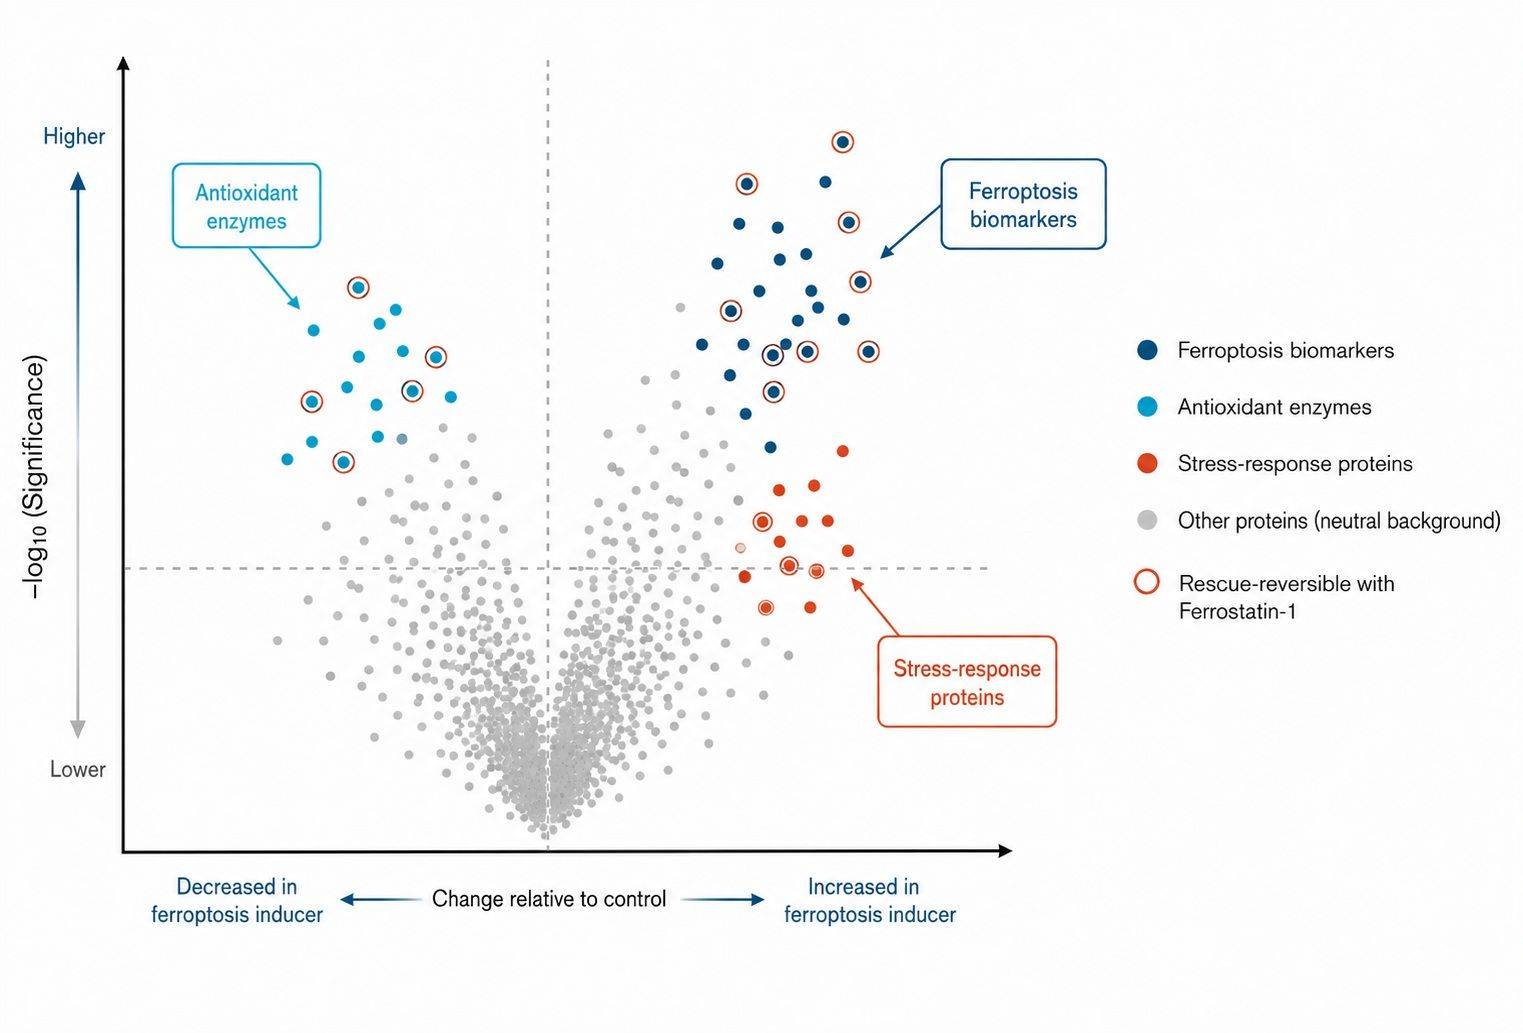
Factorial contrasts (Inducer vs. Control, Inducer vs. Inducer+Fer-1) prioritize genuine ferroptosis-dependent regulators.
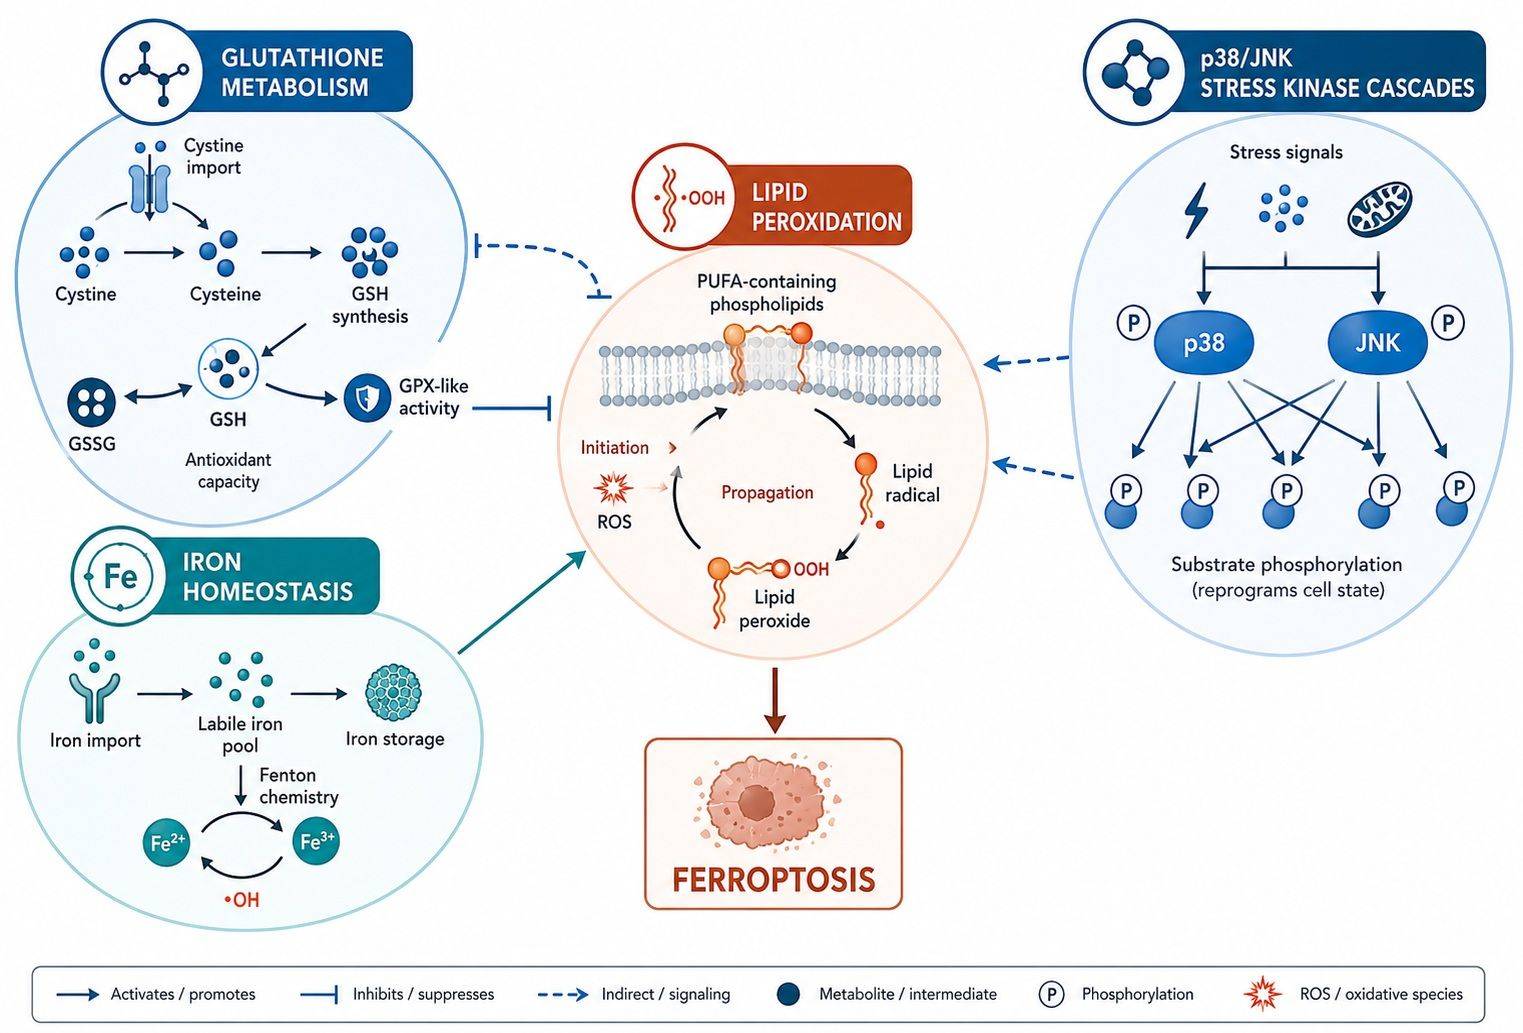
GSEA pathway enrichment and KSEA kinase networks provide deep mechanistic context for oxidative stress and cell death signaling.

Quantitative Data Tables
- Normalized protein-, peptide-, and phosphosite-level intensity matrices with complete experimental annotations.

Quality Assessment Summary
- Sample-level review, digestion completeness metrics, pooled QC CV distributions, and batch reproducibility reports.

Comparative & Rescue Analysis
- Factorial interaction modeling, Benjamini-Hochberg FDR correction, and Fer-1/Lip-1 rescue scorecards.

Pathway & Kinase Networks
- Gene Ontology (GO), KEGG, and Reactome GSEA enrichment, plus KSEA stress kinase-substrate network mapping.

Bioinformatics & Reporting
- Comprehensive final project report with publication-ready figures and prioritized targeted PRM validation candidate shortlists.