Proteomics Data Analysis Services for Interpretation and Decision Support
Modern proteomics projects frequently generate thousands of protein identifications per run. Processing large cohorts spanning dozens or hundreds of samples requires robust computational infrastructure to handle missing value imputation, batch effect correction, and false discovery rate (FDR) control.
We offer our comprehensive proteomics bioinformatics analysis through two flexible engagement models:
- Standalone Data Analysis: Submit your raw mass spectrometry files or pre-processed quantitative matrices generated by your own core facility or external vendors. We will execute the downstream statistical and biological interpretation.
- Integrated NGPro™ Pipeline: For projects processed entirely within our facility, this bioinformatics suite acts as the analytical brain, seamlessly connecting discovery-stage proteomics sequencing to targeted validation handoffs.
Supported Proteomics Data Types and Analysis Platforms
The foundation of reproducible mass spectrometry data analysis is a reliable algorithmic core. We process datasets generated across all major platforms, utilizing industry-standard and proprietary software environments.
Supported Acquisition Types
- Data-Independent Acquisition (DIA) and SWATH-MS
- Data-Dependent Acquisition (DDA)
- 4D Proteomics (Ion Mobility-enhanced LFQ)
- Multiplexed Quantitation (TMT / iTRAQ)
- Post-Translational Modifications (PTMs): Phosphorylation, Ubiquitination, Acetylation
Core Analytical Software & Algorithms
- Spectronaut
- DIA-NN
- MaxQuant & Perseus
- FragPipe
- Proprietary R and Python pipelines for advanced statistical modeling
Bioinformatics Service Packages for Different Research Goals
To accommodate different research objectives and cohort sizes, we structure our proteomics bioinformatics analysis into three clear delivery tiers.
Tier 1: Standard Processing and QC
Designed for basic differential expression and rigorous dataset cleaning.
- Preprocessing: Missing value imputation, log-transformation, and data normalization.
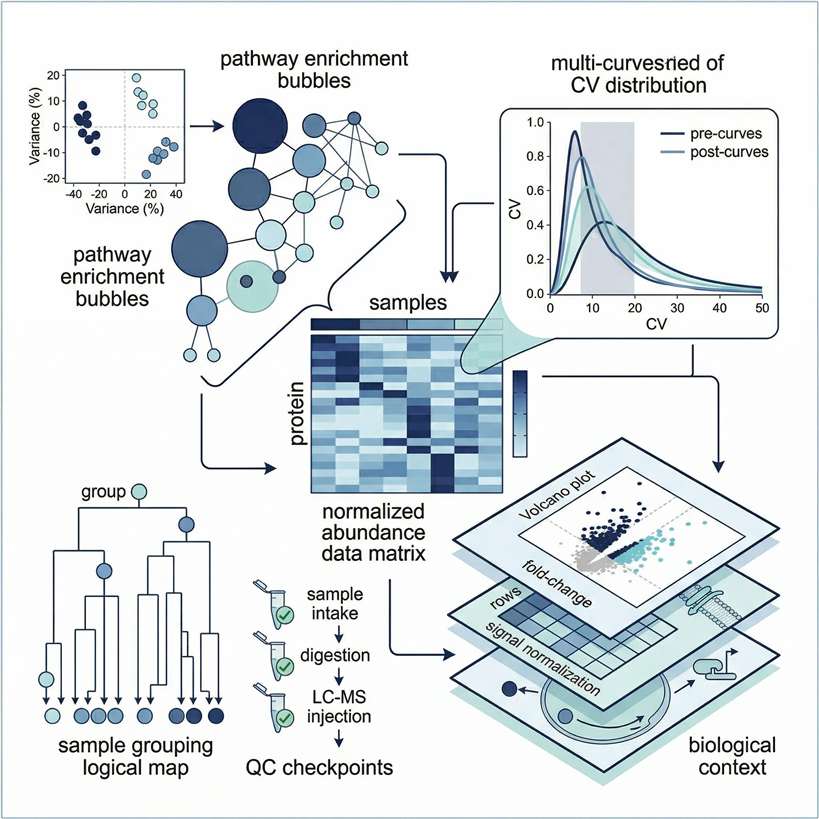
- Quality Control: PCA and CV distribution to evaluate analytical stability and batch effects.
- Statistics: Unpaired/Paired T-tests, ANOVA, and strict FDR correction.
Tier 2: Biological Mechanism Interpretation
Designed to map statistical differences to specific biological functions and interactions.
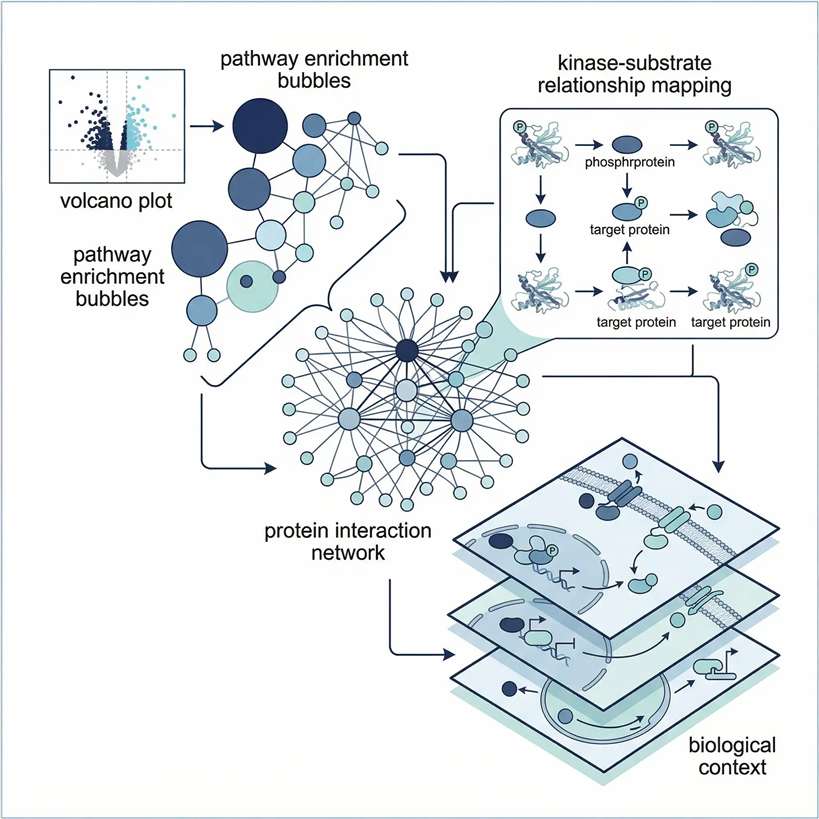
- Pathway Mapping: Gene Ontology (GO), KEGG, and Reactome pathway enrichment analysis.
- Network Analysis: Protein-Protein Interaction (PPI) networks utilizing STRING databases.
- PTM Inference: Kinase-Substrate Enrichment Analysis (KSEA) to infer upstream regulatory activity from phosphoproteomic data.
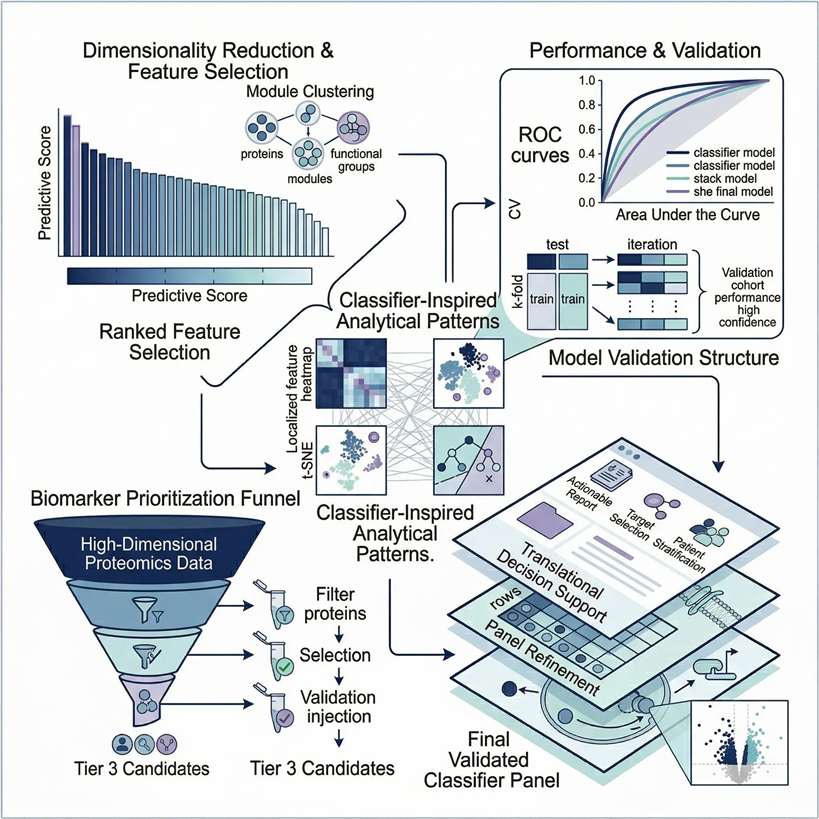
Tier 3: Advanced Machine Learning
Designed for large clinical cohorts requiring machine learning for biomarker discovery and predictive modeling.
- Dimensionality Reduction: LASSO regression and Random Forest algorithms for candidate selection.
- Phenotype Clustering: WGCNA to correlate specific protein modules with clinical traits.
- Predictive Validation: Receiver Operating Characteristic (ROC) curve analysis to assess diagnostic AUC.
Statistical Frameworks and Algorithmic Toolchains
For bioinformaticians and principal investigators, analytical transparency is non-negotiable. We do not rely on black-box web tools. Our pipelines are built on peer-reviewed, industry-standard R and Python packages, ensuring that your results are fully reproducible and ready for the Materials & Methods section of high-impact journals.
| Analysis Category | Core Algorithms & Packages | Analytical Purpose |
|---|---|---|
| Differential Expression | limma, DESeq2 (for count data), stats | Rigorous statistical testing and False Discovery Rate (FDR) control using Benjamini-Hochberg. |
| Pathway Enrichment | clusterProfiler, fgsea | Gene Set Enrichment Analysis (GSEA) and hypergeometric testing against KEGG/GO. |
| Machine Learning | glmnet (LASSO), randomForest, xgboost | High-dimensional feature selection and calculation of variable importance for biomarker panels. |
| Network & Clustering | WGCNA, Cytoscape | Identifying co-expressed protein modules and mapping hub-gene regulatory networks. |
Proteomics Bioinformatics Workflow from Raw Data to Final Interpretation
Our standardized proteomics data analysis operating procedures ensure data integrity and statistical rigor from raw file ingestion to final reporting.
Parse raw mass spectrometry files or pre-processed matrices; verify metadata, clinical sample grouping, and format integrity.
Perform signal alignment, log-transformation, and missing value imputation; evaluate batch effects and analytical stability via PCA and CV distribution.
Execute unpaired/paired T-tests, ANOVA, and custom linear models; apply strict false discovery rate (FDR) control and statistical power validation.
Map statistically significant protein hits to established biological databases; perform GO/KEGG pathway enrichment, PPI network construction, and upstream regulator inference.
Execute feature selection algorithms to reduce dimensionality; compile annotated matrices, publication-ready vector graphics, and comprehensive methods documentation.
Data Input Requirements for Standalone Analysis Projects
For clients utilizing our standalone proteomics data analysis service, please adhere to the following input specifications to ensure optimal processing and minimize turnaround time.
| Input Data Type | Acceptable Formats | Required Metadata | Applicable Analysis Tiers |
|---|---|---|---|
| Raw MS Spectra | .raw (Thermo), .d (Bruker), .wiff (SCIEX) | Sample grouping, batch details, experimental design | Tier 1, 2, 3 (Full Pipeline) |
| Processed Quant Matrix | .csv, .txt, .xlsx (MaxQuant/Spectronaut output) | Protein/Peptide intensities, missing value specs | Tier 2, 3 (Interpretation & ML) |
| Public Database IDs | CPTAC, TCGA, PRIDE Accession Numbers | Target cohort criteria & selection parameters | Custom Data Mining |
Deliverables, Output Formats, and Code Transparency
We provide comprehensive, fully transparent data packages. Our deliverables are structured to support immediate publication, secondary independent analysis, and downstream clinical assay development.
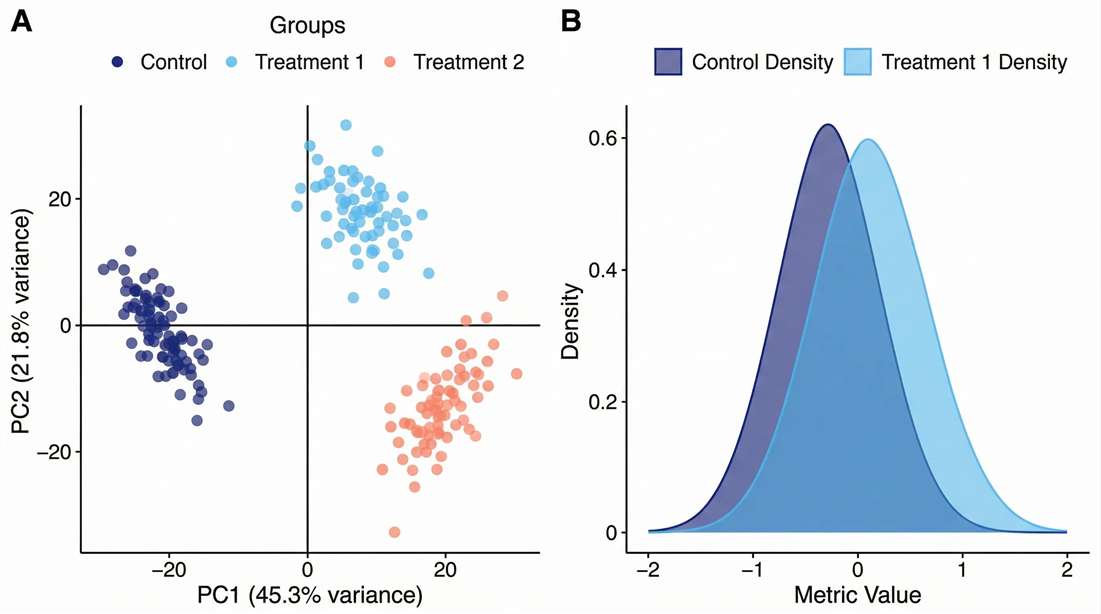
PCA & CV Density: Demonstrates the elimination of batch effects and confirms multi-batch cohort stability.
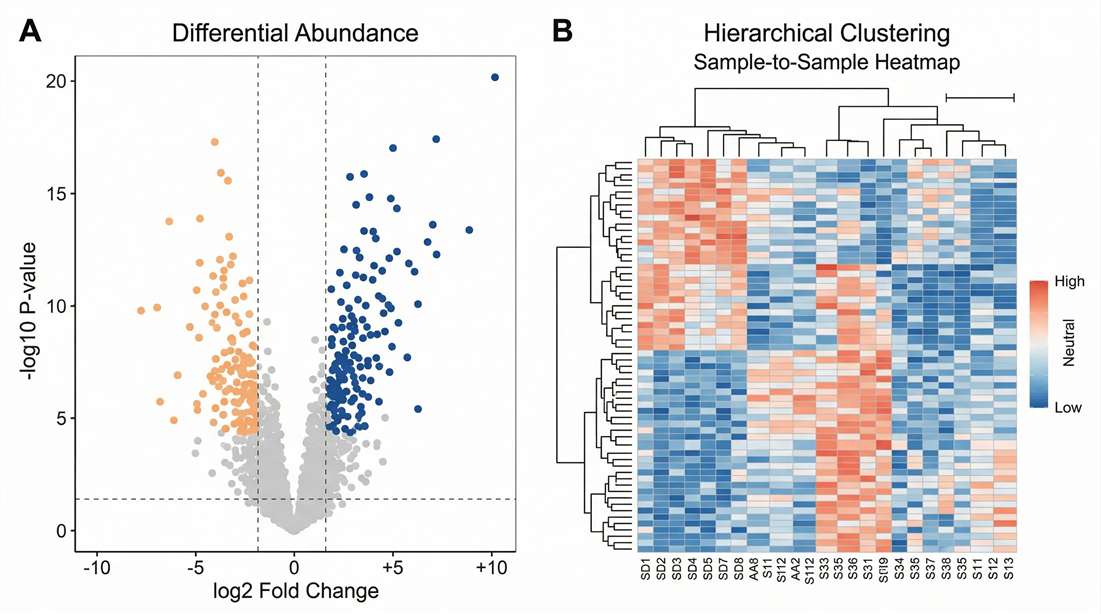
Volcano Plot & Clustering: Highlights statistically significant up- and down-regulated protein panels.
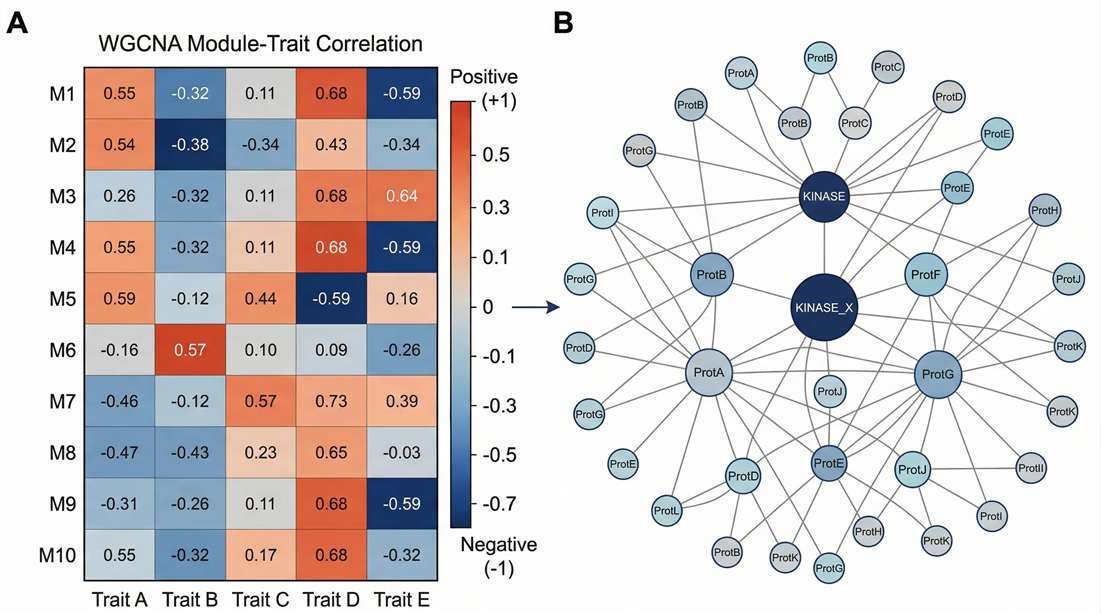
WGCNA & KSEA Maps: Correlates complex clinical phenotypes with distinct protein co-expression modules.
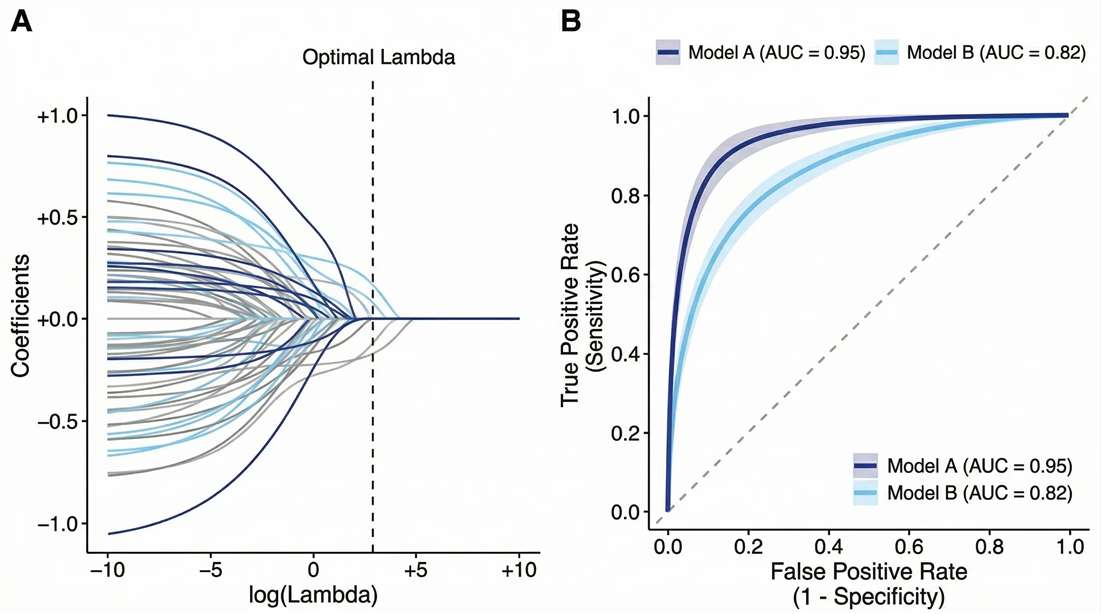
LASSO & ROC Curve Matrix: Validates the clinical predictive accuracy (AUC) of the selected biomarker panel.
Publication-Ready Graphics
High-resolution, infinitely scalable vector formats (PDF/SVG).
Annotated Data Matrices
Unencrypted Excel/CSV files containing normalized intensities and FDR values.
Methods Documentation
A detailed report specifying software versions and parameters used.
Code Transparency
Delivery of raw R/Python scripts upon request for reproducibility.
From Discovery Data to Targeted PRM Validation
A major translational bottleneck occurs when discovery workflows identify too many candidates, stalling downstream validation. Our machine learning modules specifically solve this by ranking and prioritizing targets based on predictive weight.
Once the optimal 10 to 50 proteins are selected through our dimensionality reduction analysis, we export a targeted transition list directly into our Targeted Proteomics (PRM/MRM) platforms. This ensures a seamless transition from broad, untargeted discovery to absolute, assay-grade clinical validation without switching data logic or vendors.
Frequently Asked Questions About Proteomics Data Analysis
.raw, .d, and .wiff files generated by external academic cores or other CROs, standardizing the data through our validated software pipelines.Case Study: Machine Learning-Based Identification of Proteomic Markers in Colorectal Cancer
Journal: Frontiers in Oncology · Published: 2025
Study Design
Large-scale proteomics projects often generate extensive candidate lists, but the key analytical challenge is determining which proteins retain predictive value after statistical filtering and model comparison. In this study, researchers analyzed colorectal cancer-associated proteomic data from the UK Biobank and applied a machine-learning framework to identify a smaller set of proteins with diagnostic relevance.
- Multiple classifiers were evaluated, including LASSO, XGBoost, and LightGBM.
- Grid-search hyperparameter tuning and cross-validation were used to reduce overfitting and improve model stability.
- SHAP analysis was incorporated to interpret feature importance rather than treating the models as black boxes.
- The study further examined overlapping candidate proteins across datasets and linked selected markers to known colorectal cancer biology.
Model Performance and Feature Prioritization
Instead of relying only on fold change ranking, the authors compared multiple predictive models and measured how individual proteins contributed to classification performance. In the UK Biobank dataset, LASSO achieved the highest test AUC of 0.75, outperforming XGBoost and LightGBM in the initial model comparison. SHAP-based interpretation highlighted proteins such as CEACAM5, B4GAT1, and AHCY as influential contributors to model predictions, while cross-dataset comparison helped refine the shortlist further.
The study also connected prioritized proteins to biological context through network and pathway interpretation, including links to inflammatory signaling, methylation-related processes, and colorectal cancer progression.
Representative Result
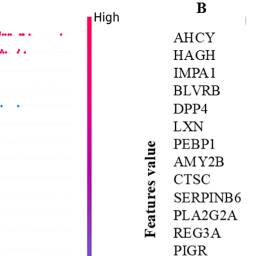
Suggested original figure: Figure 5. SHAP-based local and global feature-importance plots illustrate how the machine-learning workflow ranked the most influential proteins driving colorectal cancer classification, providing both predictive performance and model interpretability.
Relevance to Proteomics Data Analysis
This study is a strong fit for a proteomics data analysis service page because it demonstrates a full downstream analysis logic: model comparison, feature selection, explainable AI interpretation, and biological contextualization. Rather than stopping at a long differential-protein list, the workflow reduced a large proteomic dataset into a more interpretable and testable marker set.
For bioinformatics-led proteomics projects, this is exactly where advanced analysis adds value: not only identifying significant proteins, but determining which features are most stable, most informative, and most suitable for downstream validation.
Reference
Radhakrishnan, S. K., Nath, D., Russ, D., et al. "Machine learning-based identification of proteomic markers in colorectal cancer using UK Biobank data." Frontiers in Oncology 14:1505675 (2025).