
Why Urine for Proteomics
Urine is the only biofluid that combines complete noninvasiveness with direct access to the genitourinary system. The kidney filters ~180 L of blood per day, concentrating waste products — and proteins — into ~1.5 L of urine. This means urine contains proteins from three distinct biological compartments: the bloodstream (filtered at the glomerulus), the kidney itself (tubular secretion, cellular turnover), and the entire urological tract (bladder, prostate, urethra). No other biofluid provides this combination of systemic and local information in a single sample.
But urine proteomics has an analytical challenge that plasma does not. Urine protein concentration varies enormously between individuals and timepoints — from 0.01 mg/mL (dilute daytime samples) to 2 mg/mL (concentrated first-morning samples). Normalization is not optional; it is the difference between biological signal and hydration artifact. We normalize every sample to total protein content and provide creatinine-adjusted values, ensuring that fold changes between groups reflect disease biology, not how much water the patient drank that morning.
For projects requiring matched comparisons with blood-based biomarkers, Creative Proteomics offers harmonized urine-plus-plasma workflows from the same patient visit. For urological tissue studies, our FFPE quantitative proteomics service enables parallel analysis of archived biopsy specimens alongside urine from the same patient cohort.
Content Guide
- Why Urine for Proteomics
- What Urine Proteomics Detects
- Service Advantages
- Sample Collection
- Disease Applications
- Deliverables
What DIA Urine Proteomics Detects
1,500+ proteins across three biological compartments — without depletion

Kidney-Derived Proteins
Uromodulin (Tamm-Horsfall protein), nephrin, podocin, aquaporins, and tubular transporters — direct readouts of glomerular and tubular function. Changes in these proteins precede changes in serum creatinine by months to years.

Urological Tract Proteins
Prostate-specific antigen (PSA), prostatic acid phosphatase, bladder tumor antigens, and secreted urogenital proteins — direct molecular evidence from the tissues that urine passes through before voiding. Enriched further by DRE when prostate cancer is the focus.

Systemic Filtration Products
Albumin, transferrin, immunoglobulins, complement proteins — filtered from blood at the glomerulus. The pattern and quantity of these proteins reflects glomerular integrity and systemic protein homeostasis.

Extracellular Vesicle Cargo
Urinary EVs carry tissue-specific proteins from every segment of the nephron and urogenital tract. EV proteomics captures membrane proteins, transporters, and signaling molecules that are underrepresented in soluble urine fractions.

Acute-Phase and Inflammatory Proteins
Cytokines, chemokines, complement factors, and damage-associated molecular patterns (DAMPs) — early indicators of renal inflammation, infection, and immune activation. Detectable in urine before systemic inflammatory markers rise in blood.

Drug and Toxicity Markers
Renal transporter proteins, drug-metabolizing enzymes, and nephrotoxicity indicators — monitor drug-induced kidney injury and pharmacodynamic responses noninvasively throughout treatment cycles.
Urine vs Plasma Proteomics: Choosing the Right Matrix
| Criterion | Urine Proteomics | Plasma Proteomics |
|---|---|---|
| Invasiveness | Zero — self-collection at home possible | Venipuncture — requires trained personnel |
| Longitudinal frequency | Unlimited — daily, weekly, monthly with zero ethical concerns | Limited by phlebotomy burden and IRB constraints |
| Kidney/urological specificity | High — direct readout of nephron health, bladder biology, prostate secretion | Low — systemic protein levels confounded by extra-renal sources |
| Systemic disease sensitivity | Moderate — large proteins retained by glomerular filtration barrier | High — all circulating proteins detectable |
| Protein concentration range | 0.01–2 mg/mL (highly variable, requires normalization) | 60–80 mg/mL (stable, dominated by albumin/IgG) |
| Best for | Kidney disease, urological cancers, longitudinal monitoring, pediatric studies | Systemic biomarkers, cardiovascular disease, metabolic disease |
| Recommended strategy | Combined urine + plasma from the same visit provides the most complete picture — urinary proteins for kidney/urological specificity, plasma proteins for systemic context. For harmonized multi-matrix workflows, our plasma and serum proteomics service enables parallel analysis of blood and urine from the same patient cohort. | |
Urine Proteomics Service Advantages

Normalized to Biology, Not Hydration
Every sample is normalized to total protein concentration and creatinine-adjusted — fold changes between groups reflect disease, not water intake.

DIA: No Precursor Left Behind
Systematic fragmentation captures every detectable peptide — low-abundance urological proteins are never skipped by stochastic DDA selection.

Cohort-Ready Reproducibility
Median CV below 12% across 200+ urine samples processed in multiple batches — designed for the variability that urine inherently introduces.
Urine Sample Collection and Processing
Urine collection is easy. Standardized urine collection — the kind that produces reproducible proteomics data across hundreds of samples — requires attention to a few critical variables.
Recommended Protocol
First-morning midstream urine in sterile polypropylene containers. First-morning urine is preferred because it is more concentrated (higher protein yield) and has been equilibrated in the bladder for 6–8 hours. Midstream collection minimizes contamination from the urethral meatus and genital tract. Transfer to 50 mL conical tubes within 30 minutes.
Processing & Storage
Centrifuge at 2,000g × 10 min at 4°C to remove cells and debris. Aliquot supernatant into 2 mL fractions. Avoid repeated freeze-thaw cycles — each cycle degrades a measurable fraction of the urinary proteome. Store at −80°C. Protease inhibitors are recommended for studies targeting low-abundance cytokines and chemokines.
Volume Requirements
Standard DIA: 2 mL per sample. Deep profiling: 5 mL per sample. Exosome/EV enrichment: 20–50 mL per sample. For longitudinal studies, aliquot the entire collection into multiple 2 mL fractions at the first thaw — avoid repeated freeze-thaw of the primary collection tube.
Collection kit available upon request — including pre-labeled tubes, protease inhibitor tablets, and detailed collection instructions for multi-site clinical studies.
Designing Your Urine Proteomics Study
Urine's variability is manageable — if your design accounts for it from day one.

Normalization Strategy
Total protein normalization is mandatory, not optional. Report creatinine-adjusted values alongside raw intensities. For longitudinal studies, normalize each patient's timepoint to their own baseline — within-subject normalization reduces variability by 40–60% compared to cross-sectional approaches.

Timing & Collection Consistency
Standardize collection time across all subjects. First-morning urine for all patients, or random daytime urine for all — do not mix. Urine protein composition follows a circadian rhythm. Random vs first-morning urine produces systematic differences that can be mistaken for disease signal.
Sample Size & Statistical Power
≥20 per group for differential expression (80% power, FDR <0.05). Urine's inherently higher biological variability demands larger N than plasma for the same effect size. For longitudinal designs, 15 patients × 3 timepoints can match the power of 40-patient cross-sectional studies.

DRE for Prostate Enrichment
For prostate cancer studies, a digital rectal examination before urine collection enriches prostatic proteins by 2- to 10-fold. This simple step dramatically increases prostate-specific biomarker sensitivity without any additional sample processing cost.
Contamination Control
Exclude samples with visible hematuria or pyuria. Urinary tract infections introduce massive proteomic changes. For female subjects, midstream collection minimizes vaginal contamination. Record menstruation status and UTI history as covariates.

Longitudinal Stability Modeling
Urinary proteomes are stable within individuals over years (ICC >0.4 for the majority of proteins). For longitudinal biomarker studies, collect at least 3 timepoints per patient. Use linear mixed-effects models that treat time as a within-subject factor — this separates true disease progression from random biological fluctuation.
Urine Proteomics Applications
Chronic Kidney Disease & Diabetic Nephropathy
Urinary proteins detect glomerular and tubular injury months before eGFR decline or albuminuria appears. Proteomic classifiers outperform albuminuria for predicting CKD progression in non-albuminuric patients — the population where current clinical tests fail. Candidate biomarkers can be advanced to targeted proteomics validation in independent cohorts.
Prostate & Bladder Cancer
Urine passes directly through the prostate and bladder. DRE-enriched urine proteomics captures prostate-derived proteins at concentrations that rival tissue biopsies. Multiprotein classifiers distinguish benign from malignant lesions with AUC exceeding 0.90.
Drug Nephrotoxicity Monitoring
Longitudinal urine proteomics during clinical trials identifies kidney injury biomarkers weeks before serum creatinine rises. Noninvasive monitoring enables dose adjustment before irreversible damage occurs — critical for nephrotoxic oncology drugs, antibiotics, and contrast agents.
Pediatric & Population Screening
Urine is the only biofluid ethically acceptable for large-scale pediatric and population screening. No needles, no discomfort, unlimited sampling — enabling proteomic monitoring at a scale that blood-based approaches cannot match. Ideal for newborn screening and epidemiological cohort studies.
Urine Proteomics Deliverables
From 2 mL of urine to a complete proteomic profile with biological context
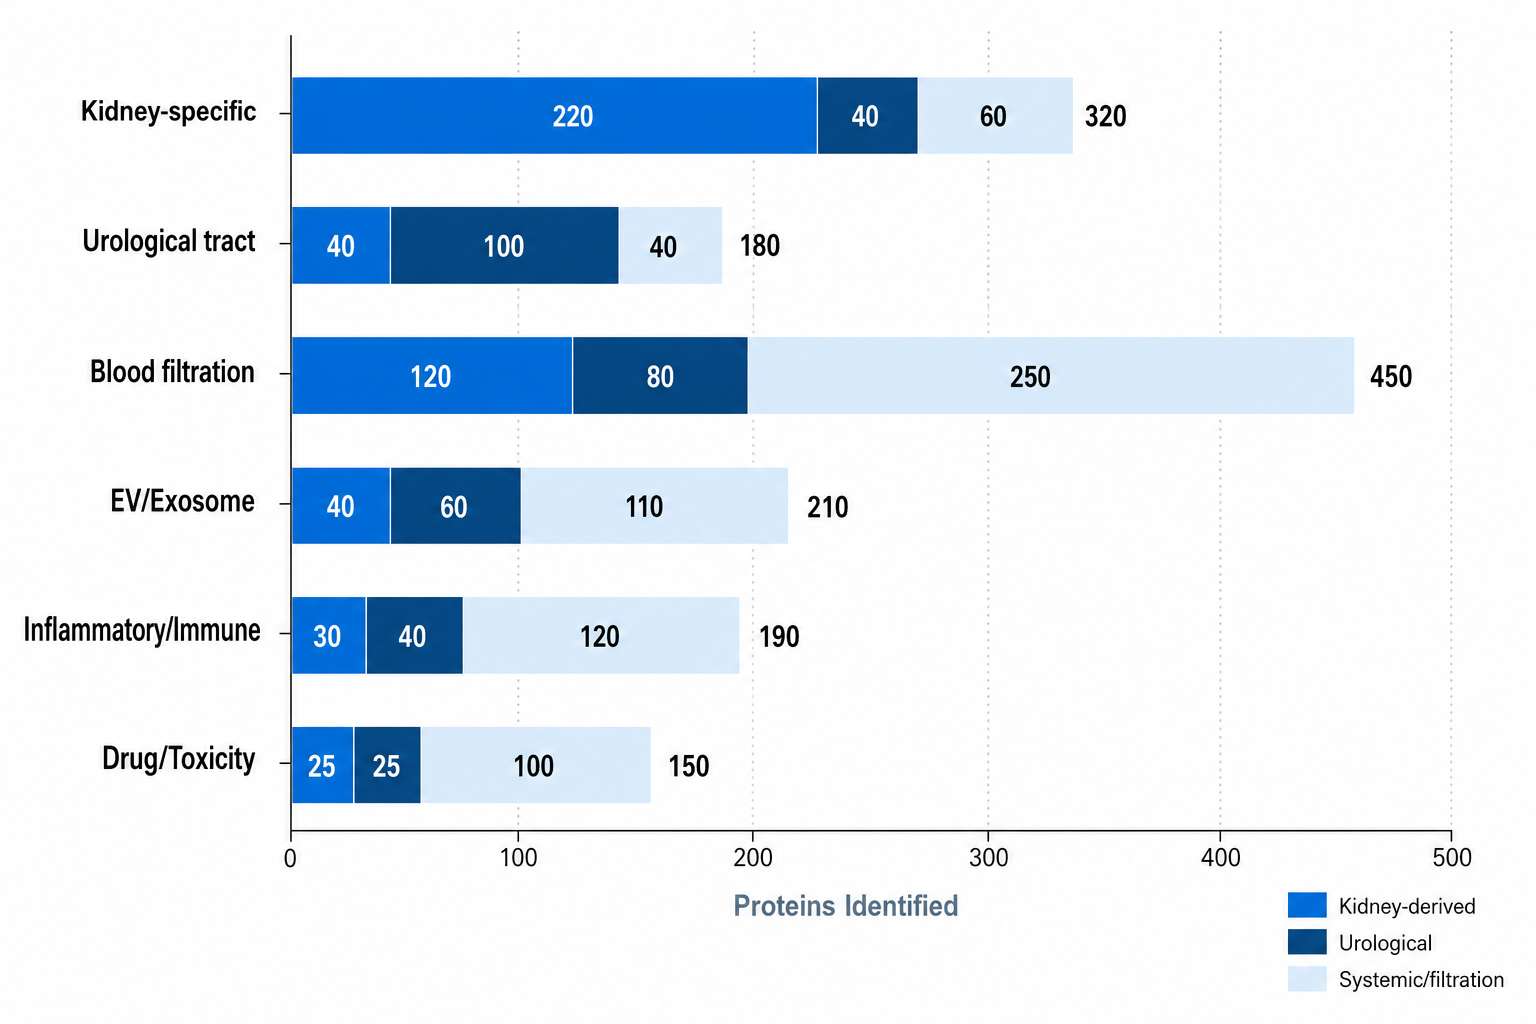
Urinary proteins annotated by tissue-of-origin — kidney-derived, urological tract, and systemic filtration products each provide distinct biological insight.
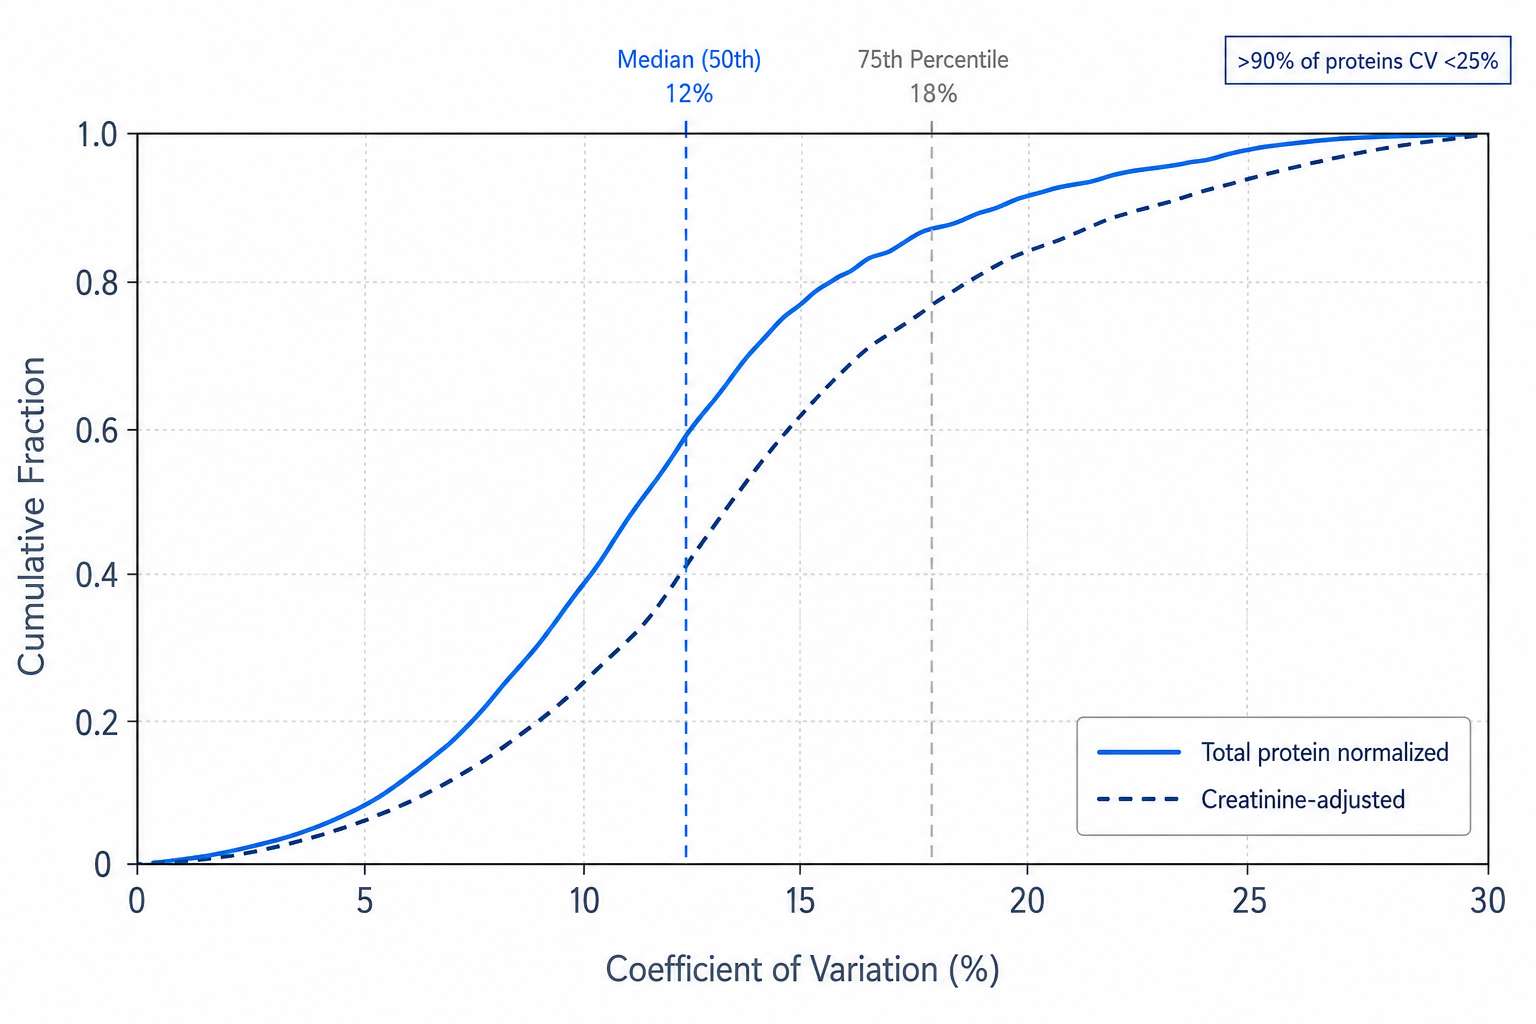
Median CV below 12% across 200+ urine samples — total protein normalization and creatinine adjustment control the hydration-driven variability inherent to urine.
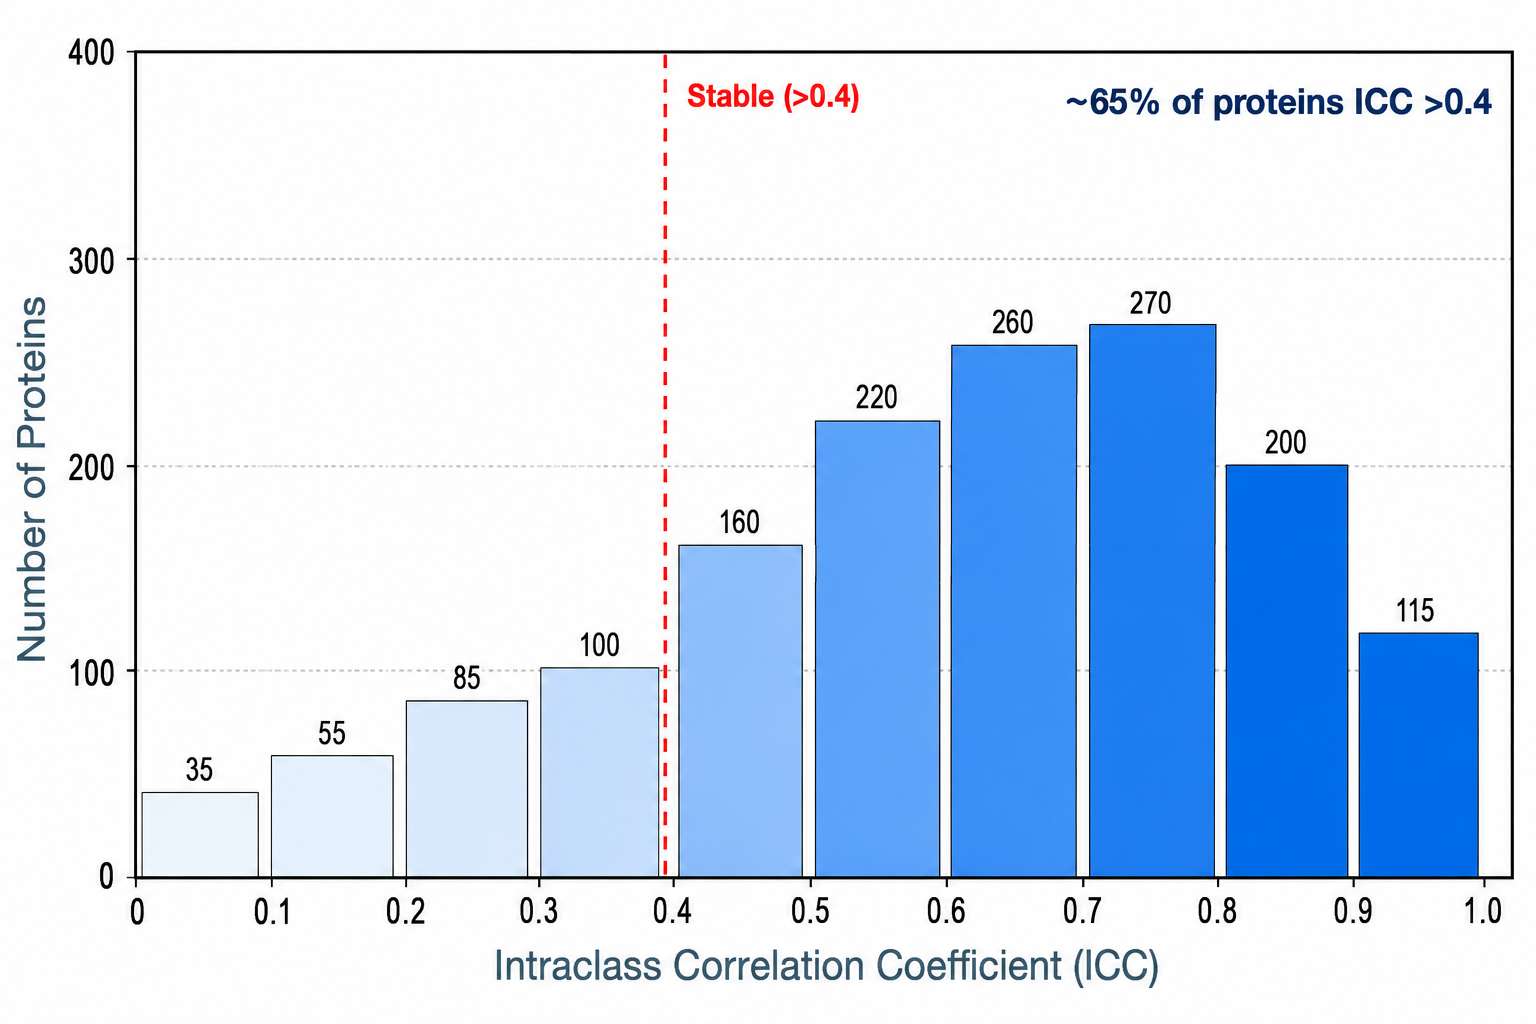
Longitudinal stability — ICC distribution across 3 timepoints from the same patients. The majority of urinary proteins are stable over months to years, validating urine as a longitudinal biomarker matrix.
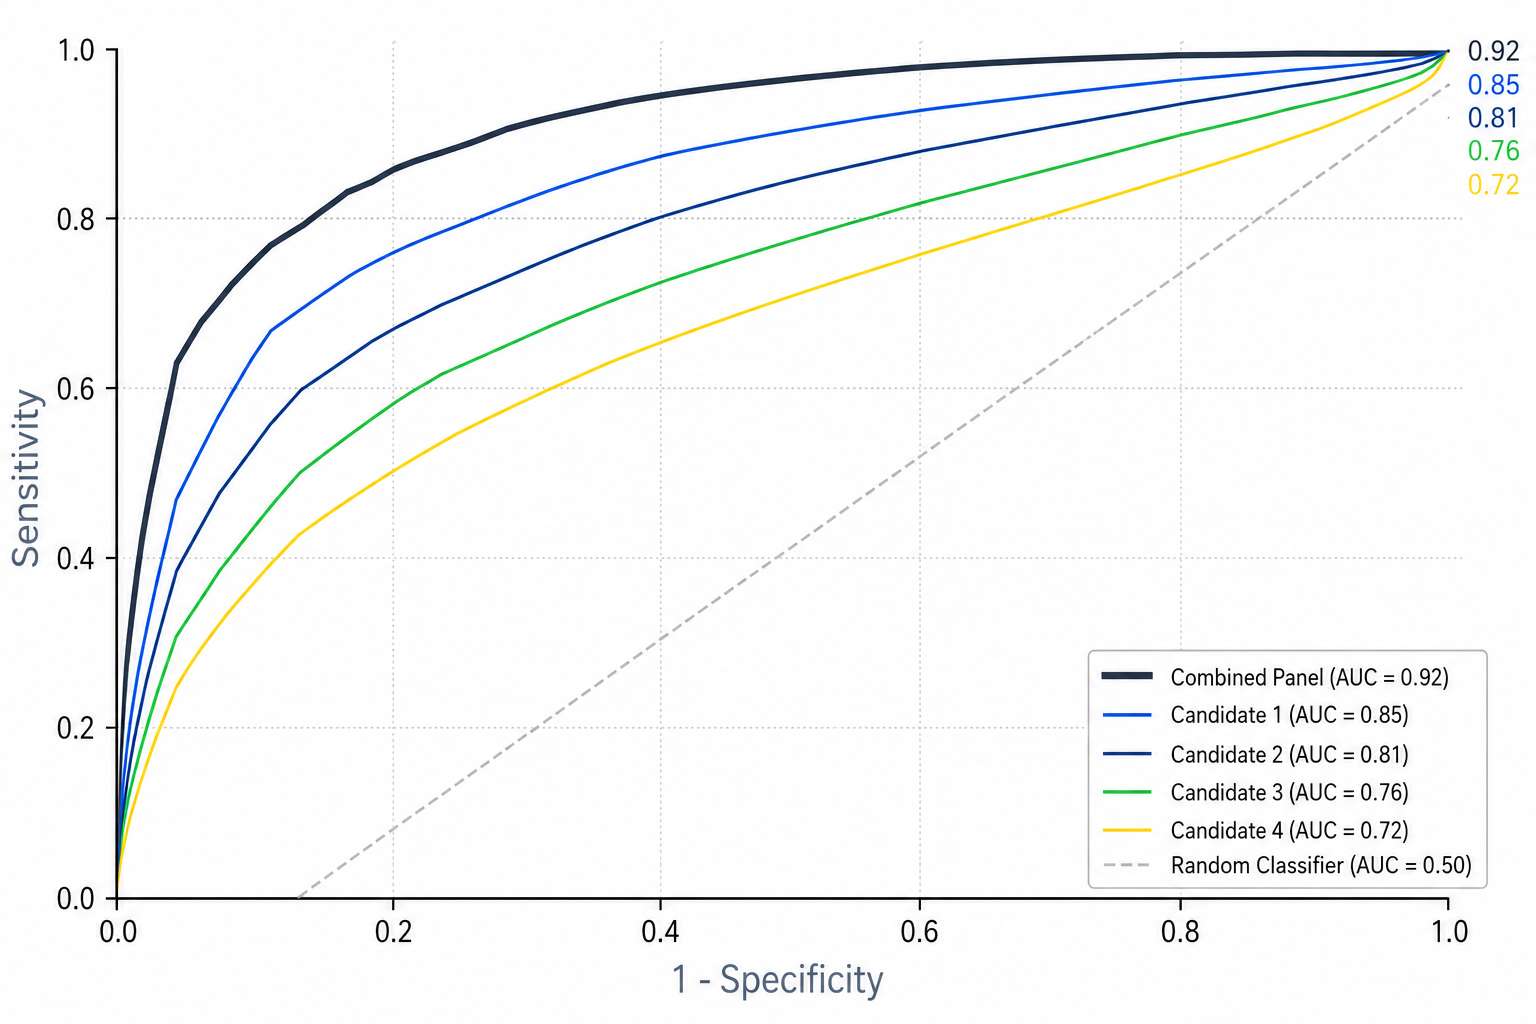
Urine biomarker ROC analysis — multiprotein classifiers built from DIA data achieve AUC 0.85-0.95 for distinguishing disease from control, matching or exceeding serum-based biomarkers.
- Protein identification and quantification matrix
(1,500+ proteins × N samples) - Creatinine-normalized protein abundances
- Differential expression analysis with statistics
- Volcano plots, PCA, hierarchical clustering
- GO, KEGG, Reactome pathway enrichment
- Protein-protein interaction networks
- Tissue-of-origin annotation (kidney/urological/systemic)
- Biomarker ROC analysis and panel development
- Raw DIA data files (.d or .raw format)
- Complete QC report with batch and normalization metrics
Urine Proteomics Frequently Asked Questions
In standard undepleted DIA urine proteomics, we routinely quantify 1,500–2,000 protein groups from 2 mL of midstream urine. With depletion of the most abundant urinary proteins (albumin, uromodulin), coverage extends to 2,500–3,500 proteins. For maximal depth, depletion combined with basic reversed-phase fractionation can exceed 5,000 urinary proteins.
The number depends on urine concentration — first-morning urine yields approximately 20–30% more identifications than random daytime samples.
Unlike plasma, urine protein concentration can vary 100-fold between individuals and even within the same individual across the day. A protein that appears "elevated" in one sample may simply reflect concentrated urine. Without normalization, hydration status is mistaken for disease signal.
We normalize to total protein content and report creatinine-adjusted values alongside raw intensities. For longitudinal studies, within-subject normalization to baseline further reduces biological noise.
Urine proteomics cannot fully replace the structural information provided by histological examination of kidney tissue. However, it provides complementary molecular information that is inaccessible from biopsy — continuous monitoring of tubular health, glomerular filtration integrity, and inflammatory status over time.
In clinical research settings, urinary proteomic classifiers have demonstrated the ability to predict fibrosis severity and CKD progression, reducing the need for repeat biopsies in monitoring studies.
A digital rectal examination (DRE) before urine collection mechanically expresses prostatic fluid into the urethra, enriching prostate-derived proteins in the voided urine by 2- to 10-fold. This simple step dramatically improves sensitivity for prostate-specific biomarkers such as PSA (KLK3), PSMA (FOLH1), and prostatic acid phosphatase without adding any cost to the proteomics workflow.
DRE is standard of care for prostate exams and takes approximately 30 seconds. The enrichment effect is robust and reproducible across patients.
The urinary proteome is remarkably stable within individuals over periods of months to years. In published longitudinal studies, intraclass correlation coefficients (ICC) exceed 0.4 for the majority of urinary proteins, meaning that more than 40% of protein variance is attributable to the individual rather than random fluctuation. This stability makes urine an excellent matrix for longitudinal biomarker monitoring.
However, individual proteins show different stability profiles — proteins derived from the kidney parenchyma tend to be more stable than those filtered from blood. Our bioinformatics pipeline characterizes stability for every protein in your dataset, flagging those with low ICC for exclusion from longitudinal analyses.
Standard DIA urine proteomics requires a minimum of 2 mL per sample. We recommend collecting and aliquoting 10–50 mL of first-morning midstream urine — the excess volume can be stored as backup aliquots. For studies combining soluble proteomics with EV/exosome enrichment, 20–50 mL is required.
For multi-site clinical studies, we provide pre-labeled collection kits with detailed instructions to standardize collection, processing, and freezing across all sites.
Case Study: Urine Proteomics Distinguishes Prostate Cancer from Benign Lesions
190
men enrolled (126 PCa)
2–10×
prostatic protein enrichment via DRE
Multi-year
longitudinal proteome stability
AUC 0.92–1
PCa vs benign classification
Background
Prostate cancer screening relies on serum PSA testing — a biomarker with well-documented limitations in specificity. Elevated PSA levels can result from benign prostatic hyperplasia, prostatitis, or recent sexual activity, leading to unnecessary biopsies. A noninvasive test that directly samples the prostatic microenvironment could reduce false positives and improve risk stratification without additional invasive procedures.
Study Design & Samples
190 men were enrolled, including 126 with biopsy-confirmed prostate cancer and 64 with benign prostatic conditions. Each participant provided post-DRE urine, which was fractionated into three components: soluble proteins (uSP), large extracellular vesicles (uEV-P20, pelleted at 20,000g), and small extracellular vesicles (uEV-P150, pelleted at 150,000g). A subset of 5 patients provided longitudinal samples over several years.
Technical Methods
Sample preparation: DRE performed by a urologist immediately before urine collection. Urine fractionated by differential ultracentrifugation into uSP, uEV-P20, and uEV-P150 fractions. Proteomics: Each fraction was analyzed by LC-MS/MS with data-dependent acquisition for discovery. Bioinformatics: Proteins annotated by subcellular origin and tissue specificity using GTEx and TCGA reference datasets. Machine learning: Biomarker panels selected based on detection frequency, prostate tissue specificity, and longitudinal stability (ICC >0.4). Classifiers trained and validated in independent cohorts.
Key Findings
| Metric | Result | Significance |
|---|---|---|
| PCa vs benign classification | AUC 0.92–1.00 | Urine multiprotein classifier dramatically outperforms serum PSA (AUC ~0.65–0.70) |
| Tumor grade stratification | AUC 0.73–0.79 | Distinguishes indolent (GG1) from aggressive (GG>1) prostate cancer |
| DRE enrichment of prostate proteins | 2–10× fold increase | A 30-second clinical exam enriches prostate-derived proteins to near-tissue concentrations in voided urine |
| Longitudinal stability | ICC >0.4 for majority of proteins | Urinary proteome is stable over years within the same individual |
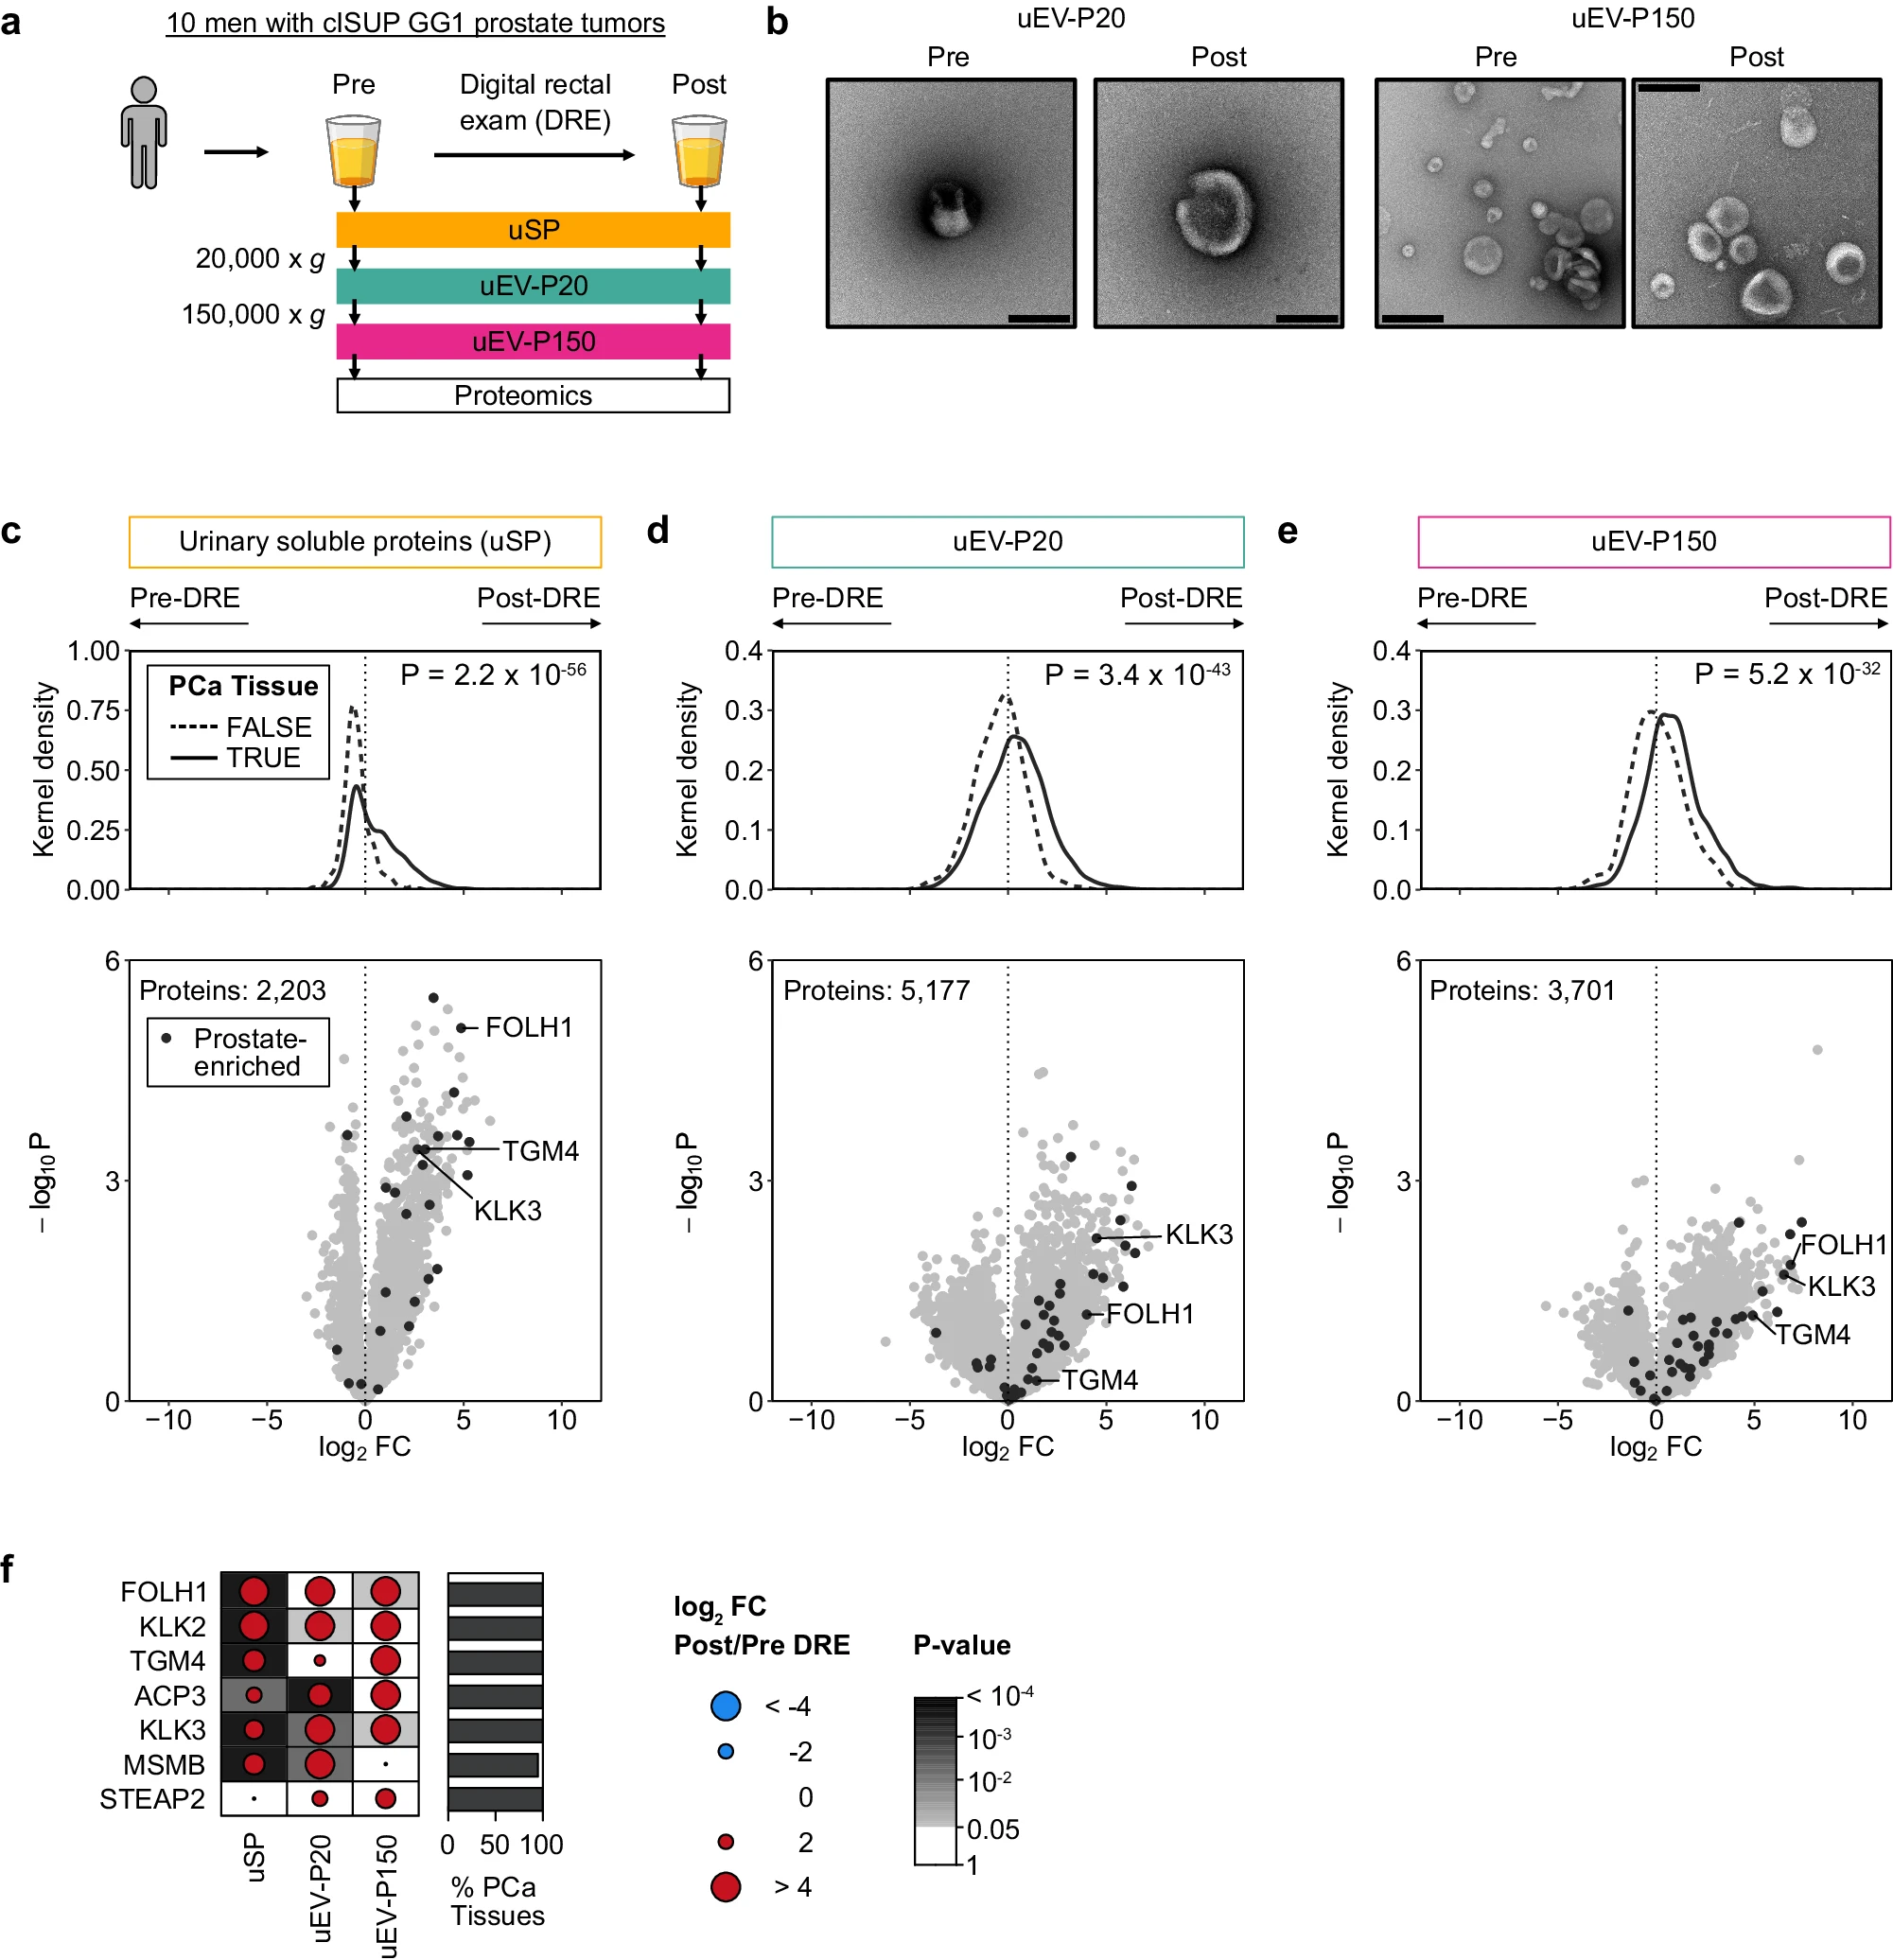
DRE enriches prostate-derived proteins in post-exam urine. Soluble and EV fractions each carry distinct protein cargo — uEV-P20 (large EVs) are the most faithful surrogate of prostate tissue proteomes.
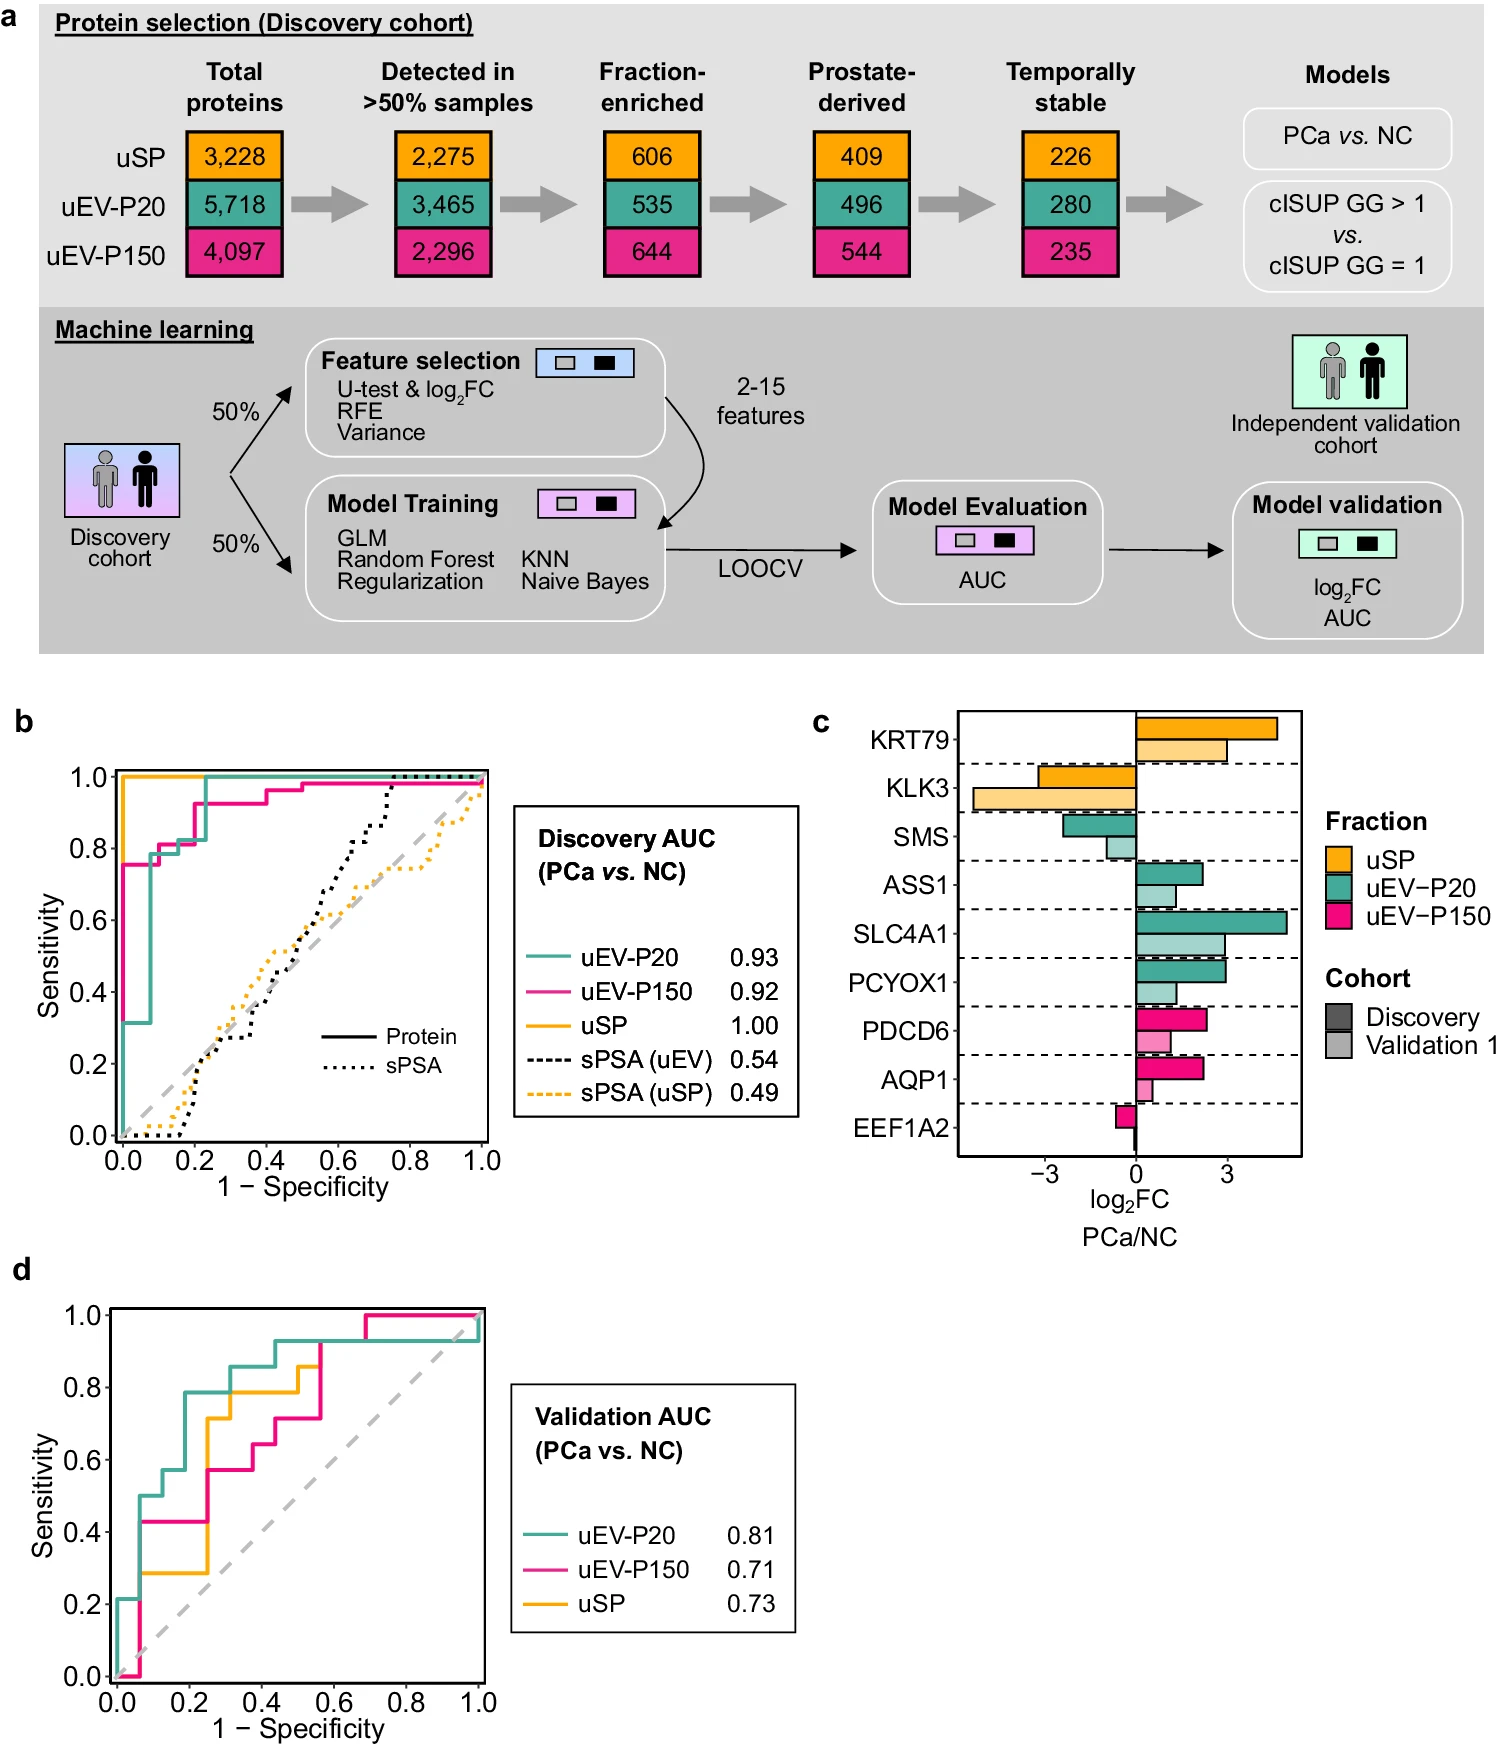
A multiprotein urinary classifier trained on DIA data distinguishes prostate cancer from benign prostatic conditions with AUC 0.92–1.00 — substantially exceeding serum PSA performance.
What This Means for Urine Proteomics Studies
- Urinary EVs are faithful tissue surrogates. The large EV fraction (uEV-P20) captures membrane proteins, transporters, and signaling molecules directly from prostate tissue — providing molecular information that rivals biopsy without the invasiveness.
- A 30-second DRE transforms biomarker sensitivity. This simple clinical step enriches prostate proteins by 2–10 fold in voided urine. For any prostate cancer biomarker study, DRE before collection should be standard protocol.
- Longitudinal stability validates urine as a monitoring matrix. The urinary proteome is stable within individuals over years. Unlike plasma, urine can be collected daily, weekly, or monthly — enabling dense longitudinal monitoring that catches disease progression in real time.
Reference: Khoo A, Govindarajan M, Qiu Z, et al. Prostate cancer reshapes the secreted and extracellular vesicle urinary proteomes. Nature Communications. 2024;15:5069. doi:10.1038/s41467-024-49424-5