Questions about the application of DIA
1. When is DIA Mass Spectrometry the preferred option?
There is no absolute advantage or disadvantage of technology itself, but a more suitable technology should be selected according to the application purpose.
Take an example of a common proteomic experimental design: control, treatment group 1, and treatment group 2, with 3 biological replicates per group, for a total of 9 samples. Is DIA suitable for this experiment?
NO, a labeled quantification technique of the conventional proteome - TMT - is usually recommended for the following reasons:
One of the advantages of DIA is stability. However, for the experiment of 16 samples, TMT 16plex can be used to do the labeling, and 16 samples are mixed and tested together,without the problem of parallelism, while DIA is 16 samples are tested individually on the machine, in this case, the stability advantage of DIA is not played.
The second advantage of DIA is the degree of coverage. For example, for animal tissue samples, TMT can quantify up to more than 8000 proteins through extensive fractionation, while DIA usually does not do fractionation and generally quantifies about 6000+ proteins.
High cost. the experimental process of DIA is complicated, and a library needs to be built first. In the case of small number of samples, it is not as economical and fast as doing TMT at once.
2. DIA is a full scan, but why is it not able to quantify all the proteins in the sample?
Although almost all the signals were collected by DIA, the response value of many signals in the spectrum was too low and the signal-to-noise ratio was poor, which made it impossible to be identified and quantified. Fractionation can separate the high and low abundance signals in advance to improve the signal-to-noise ratio (this is one of the main bottlenecks of mass spectrometry itself), which is a very effective way to increase the amount of data.
3. When is DIA strongly recommended?
1) For large cohort samples, DIA is the preferred technique.
For example, to analyze 40 samples, even if it is TMT-16plex, 1 plex can mix up to 16 samples, and at least 3 plexes must be made. Moreover, usually in order to increase the amount of data, a lot of fractionation will be done. The key point is that in this case, multiple batches of plexes are tested on the machine separately, which interferes with the parallelism and stability of the experiment. In the case of a large number of samples on the machine,the stability advantage of DIA is obvious.
2) For the analysis of blood samples, DIA is preferred! Most of the literature on blood proteome first removes high-abundance proteins (albumin, IgG, etc.) by methods such as affinity, and then performs proteome analysis. Because, without removing these high-abundance protein data that everyone does not pay attention to, very little meaningful data is obtained.
In contrast, the full scan mode of DIA, which is minimally affected by high abundance proteins, not only obtains the same amount of data as the conventional proteomic approach, but also has the benefits of (1) not having to worry about taking away other proteins when high abundance proteins are removed; (2) not having to worry about the parallelism introduced by the high abundance protein removal operation; and (3) not having to worry about the experimental cost and time involved in the high abundance protein removal experiment. The second and third points are important considerations in the analysis of large-scale samples.
Brief summary: According to the purpose of the experiment, consider whether DIA technology is a better choice; for the analysis of large-scale samples such as biomarker research, accurate disease typing, and strain comparison, DIA is the preferred recommended technology.
Questions about the experimental results of DIA
1. What factors determine the effect of DIA experiments?
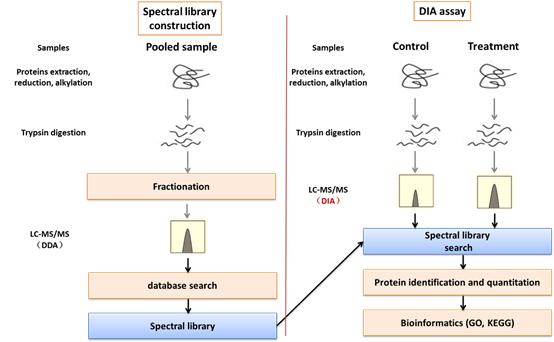
In this diagram, the biggest difference in the experimental process between DIA and conventional proteome is the library construction. In addition to getting more data, optimization of chromatography and mass spectrometry methods is also key to getting quality experimental results. creative Proteomics has spent a lot of time and effort in these areas to optimize and enhance the analytical capabilities of our DIA.
2. Why does DIA need to build a library
The identification of protein peptides by mass spectrometry is based on the primary signal and its secondary spectrum: in the scanning mode of conventional proteomes, a secondary spectrum is almost only from one primary signal; while in the scanning mode of DIA, A secondary spectrum is a mixed spectrum, which comes from multiple primary signals, which is highly complex, which leads to the search of the spectrum collected by the actual mass spectrometer, that is, the library.
Therefore, the data analysis effect of DIA depends on the library capacity and algorithm of searching the database.
3. Is the bigger the library the better?
The actual situation is that when the library capacity is raised to a certain level by fractionation, it will no longer contribute significantly to improving the final number of identifications. Therefore, it is not recommended to do a lot of fractionation blindly, and to really improve the library capacity, besides fractionation, it is more important to accumulate samples, i.e., to continuously add new samples from different experimental sources and different biological backgrounds to the library. The earlier the DIA analysis is carried out and the more the number of samples and projects are accumulated, the more advantageous the platform will be.
4. What are the commonly used analysis software?
Skyline is a classic software for proteomic research, which is often used for targeted proteomic analysis, and Skyline is also used for DIA data extraction and analysis, but because it is not specifically for DIA, its analysis effect and efficiency are not ideal, but the advantage is that public software does not charge; while Spectronaut is a representative of commercial software, and the common DIA analysis software has been evaluated in Nature Biotech, among which Spectronaut has excellent performance, but the disadvantage is the high fee.
5. How to judge the quality of DIA data?
The evaluation of proteomic data cannot only focus on the number of identifications. Whether it is accurate or not, and whether it is reliable or not, these are issues that should be given priority. Data quality are especially important for DIA analysis. DIA is more applied to large-scale sample projects, and the larger the project, the higher the quality risk.
1) Chromatography:
The peak shape, the data quantity points, and the stability of chromatography all directly determine the accuracy of quantification; in addition, the capacity ability of chromatography determines the acquisition efficiency. On this basis, the effect of chromatography will inevitably fluctuate during the separation and acquisition of a large number of samples in DIA. Therefore, not only the effect of chromatography should be examined, but also the calibration of chromatography (e.g. incorporation of iRT internal standard peptide) is required.
Search database matching: DIA data processing is very important. As conventional proteomics, there are also criteria to judge the reliability of DIA search results.
2) QC samples: QC samples are an effective method for evaluating data. We use CV value, principal component analysis, correlation and other methods to evaluate the consistency of QC samples to reflect the stability and parallelism in the whole data collection process.
 4D Proteomics with Data-Independent Acquisition (DIA)