
Why CSF Proteomics Is Harder — and Why DIA Changes What's Possible
Three properties make CSF uniquely challenging for proteomics. First, concentration: CSF contains 0.2–0.8 mg/mL total protein — roughly 1% of plasma. Second, dynamic range: albumin and IgG account for over 80% of that mass, masking the neuron-derived, synapse-derived, and glia-derived proteins you're actually interested in. Third, volume: a standard lumbar puncture yields 10–15 mL total, and individual aliquots for proteomics are typically 200–500 μL — enough for one shot, not three.
DIA quantitative proteomics addresses all three simultaneously. DIA's systematic precursor fragmentation means that even after immunodepletion, low-abundance neuropeptides aren't skipped by a stochastic selection algorithm — they're fragmented and recorded along with everything else. The result: 1,500–2,600 proteins quantified from a single 500 μL CSF sample, with the reproducibility needed to compare across clinical cohorts.
Content Guide
- CSF Proteomics Challenges
- CSF vs Plasma Proteomics
- What CSF DIA Detects
- Neurological Applications
- CSF Study Design
- Sample Requirements
- Deliverables
CSF vs Plasma: Which Matrix for Your Neurological Biomarker Study?
CSF and plasma offer complementary views of the CNS. The choice depends on what you're trying to measure and how your samples were collected.
| Dimension | CSF | Plasma/Serum |
|---|---|---|
| Proximity to CNS | Direct contact with brain interstitial fluid. Proteins reflect neuronal, synaptic, and glial activity with minimal peripheral interference. | Separated from CNS by blood-brain barrier. CNS-derived proteins are diluted 100–1,000×. Most plasma proteins reflect systemic physiology, not brain biology. |
| Proteome coverage (DIA) | 1,500–2,600 proteins (depleted). 3,600+ identifiable in deep discovery mode. | 1,000–1,500 (undepleted). 2,000+ (depleted + fractionated). |
| Best biomarkers | Synaptic proteins, neuropeptides, Aβ/tau species, neurofilament light (NfL), glial activation markers — proteins produced in the CNS | BBB leakage markers, systemic inflammation, metabolic proteins, complement factors — proteins that cross the BBB or reflect systemic status |
| Sample availability | Lumbar puncture required. Typical research collections: 200–500 μL aliquots. Limited repeat sampling. | Routine venipuncture. Multiple tubes per draw. Biobanks have millions of stored plasma samples. |
| Best study design | Small-to-medium cohorts (20–100/group) for deep discovery. Paired CSF-plasma designs for CNS-vs-systemic biomarker discrimination. | Large cohorts (100–1,000+/group) for screening. Longitudinal sampling for disease progression monitoring. |

CSF for CNS-Specific Discovery
When your question is about what's happening inside the brain — neurodegeneration, synaptic dysfunction, neuroinflammation — CSF is the matrix of choice. Proteins like NfL, GFAP, Aβ42, pTau181, and alpha-synuclein are measurable in CSF at concentrations 10–100× higher than in plasma, giving you statistical power with fewer patients.

Plasma for Accessible Screening
When your goal is a blood-based test deployable in primary care — or when you have thousands of banked plasma samples — plasma and serum proteomics provides the scale. CSF discovery can identify the candidate biomarkers; plasma verification can test whether they're detectable peripherally in larger, more accessible cohorts.
What CSF DIA Proteomics Detects
CSF proteins span the full range of CNS biology — from structural components to signaling molecules to disease-specific aggregates. DIA acquisition ensures coverage across all categories, not just the most abundant ones.
Synaptic Proteins
VGF, synaptotagmin, SNAP-25, neurexins, PSD-95 — direct readouts of synaptic integrity and function
Neurodegeneration Markers
NfL, total tau, pTau181, pTau217, Aβ42/Aβ40 ratio, alpha-synuclein — core AD and PD biomarkers quantified in a single run
Glial Activation
GFAP, TREM2, YKL-40/CHI3L1, CD163 — microglial and astrocyte activation markers for neuroinflammation
Myelin & Oligodendrocyte
MBP, PLP1, CNPase, MOG — myelin integrity markers for multiple sclerosis and leukodystrophies
Blood-Brain Barrier
Albumin CSF/serum ratio, MMPs, PDGFRβ, fibrinogen — BBB integrity assessment from the same proteomics run
Complement & Immunity
C3, C4, C1q, clusterin — complement cascade dysregulation implicated in synaptic pruning and neurodegeneration
CSF Proteomics Applications in Neurological Disease Research
Alzheimer's Disease
- Quantify Aβ42/Aβ40 ratio, pTau181, pTau217, NfL, GFAP in a single DIA run alongside 2,500+ other proteins
- Discover novel biomarkers beyond the established amyloid/tau/neurodegeneration (ATN) framework
Parkinson's Disease & Lewy Body Dementia
- CSF proteomics identified 8 validated protein biomarkers (VSTM2A, VGF, SCG2, PI16, OMD, FAM3C, EPHA4, CCK) distinguishing PD from controls
- First-ever detection of CCK in PD CSF and PI16 association with PD — discoveries that immunoassays missed
Multiple Sclerosis
- Myelin protein quantification, oligoclonal band correlation, and neuroinflammatory marker panels from a single CSF sample
- Monitor disease activity and treatment response through longitudinal CSF proteomics

ALS & Rare Neurological Disorders
- Unbiased proteomics for diseases with unknown biomarkers — TDP-43 pathology, C9orf72-associated pathways, neurofilament dynamics. For studies requiring brain tissue alongside CSF, our neuroproteomics service supports multi-matrix CNS profiling.
- Small cohort discovery with targeted proteomics follow-up for candidate validation
Designing Your CSF Proteomics Study
CSF studies face unique constraints — every aliquot is precious. Get the design right before the first patient enrolls.

Sample Size & Statistical Power
≥15 per group for differential expression (80% power, FDR <0.05). ≥30 per group for ML biomarker discovery with an independent verification set. CSF's inherently low protein concentration demands higher N than plasma studies.

Collection Protocol Standardization
Polypropylene tubes, 2,000g × 10 min at 4°C within 1 hour, 500 μL aliquots, −80°C storage. Standardize across all collection sites. Pool each patient's CSF into a single homogenized aliquot before freezing.

Paired CSF-Plasma Sampling
Draw matched plasma from the same session for every CSF collection. CNS-specific signal = elevated in CSF only. A protein elevated in both CSF and plasma reflects systemic physiology, not brain pathology.

Blood Contamination Control
We quantify hemoglobin peptides by MS — more sensitive than visual inspection. Exclude samples with Hb index >3× the cohort median. For borderline samples, include Hb index as a covariate rather than discarding data.

Cross-Sectional vs Longitudinal Design
Cross-sectional (single timepoint) is most common. Longitudinal (2–3 timepoints, 6–24 months apart) is more powerful — each patient is their own control. Inform us during design to apply paired statistical models.

Covariate & Confounder Control
CSF protein levels are affected by age, sex, circadian rhythm, and fasting status. Record these variables for every subject. Even in well-matched cohorts, include age and sex as model covariates — unadjusted CSF data often yields artifacts that mimic biological signal.
CSF Sample Collection and Requirements
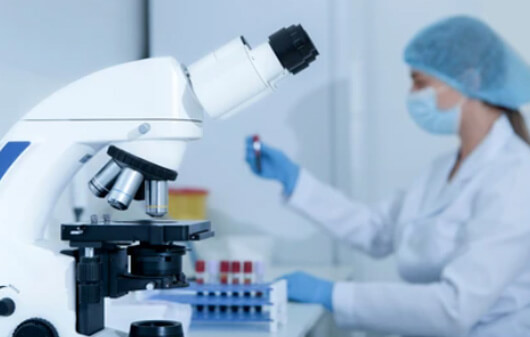
Collection protocol: Lumbar puncture into polypropylene tubes (no preservatives). Centrifuge at 2,000g × 10 min at 4°C within 1 hour of collection to remove cells. Aliquot supernatant into 200–500 μL fractions. Store at -80°C.
Blood contamination: Visibly blood-tinged CSF (>0.05% erythrocytes) will be flagged during sample receipt. Mild contamination can be corrected statistically; grossly contaminated samples should be excluded. See our study design guidance above for Hb-based thresholds.
| Sample Type | Minimum Volume | Recommended Volume | Notes |
|---|---|---|---|
| CSF (standard DIA) | 200 μL | 500 μL | Deplete high-abundance proteins before MS |
| CSF (deep discovery) | 500 μL | 1,000 μL | Depletion + fractionation for 3,000+ protein coverage |
| CSF (low-input) | 100 μL | 200 μL | Undepleted DIA; 800-1,200 proteins. For precious samples where volume is limiting. |
| Paired CSF + Plasma | CSF 200 μL + Plasma 200 μL | 500 μL each | Matched collection from same patient for CNS-vs-systemic comparison |
For multi-site clinical studies, we provide standardized CSF collection and processing SOPs — tube type, centrifugation protocol, aliquot volume, and shipping conditions.
Contact us for study-specific sample preparation guidance.
CSF Proteomics Deliverables
From lumbar puncture to biomarker candidates
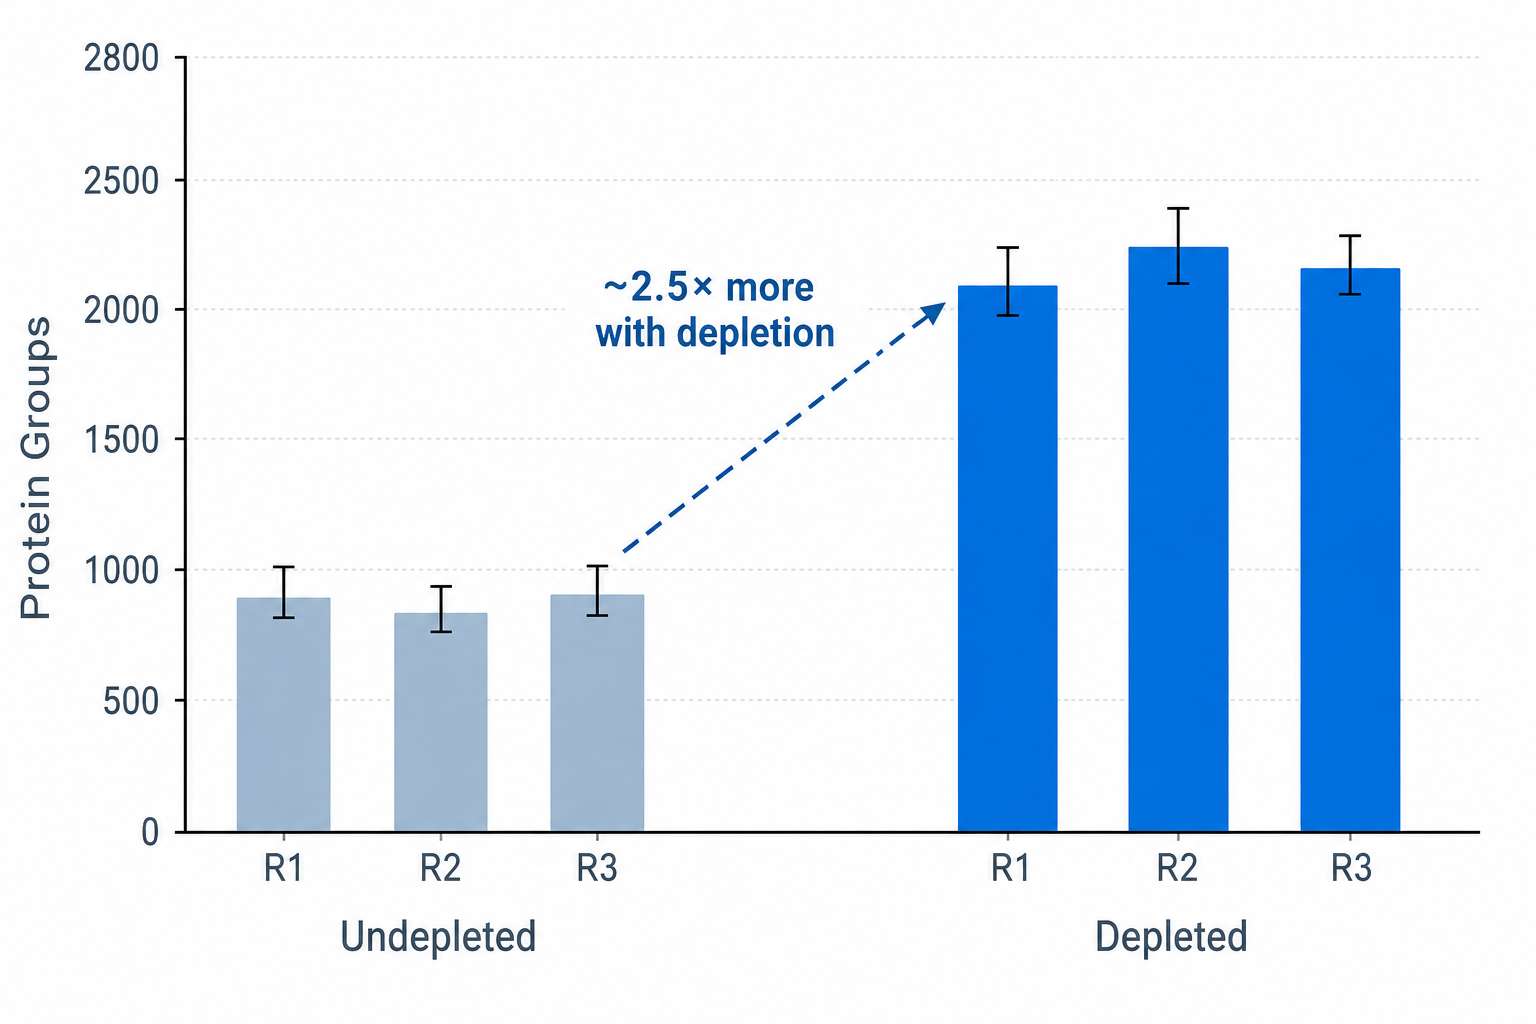
CSF protein coverage: depleted DIA quantifies 1,500-2,600 proteins from 500 μL — 3× more than undepleted workflows dominated by albumin and IgG.
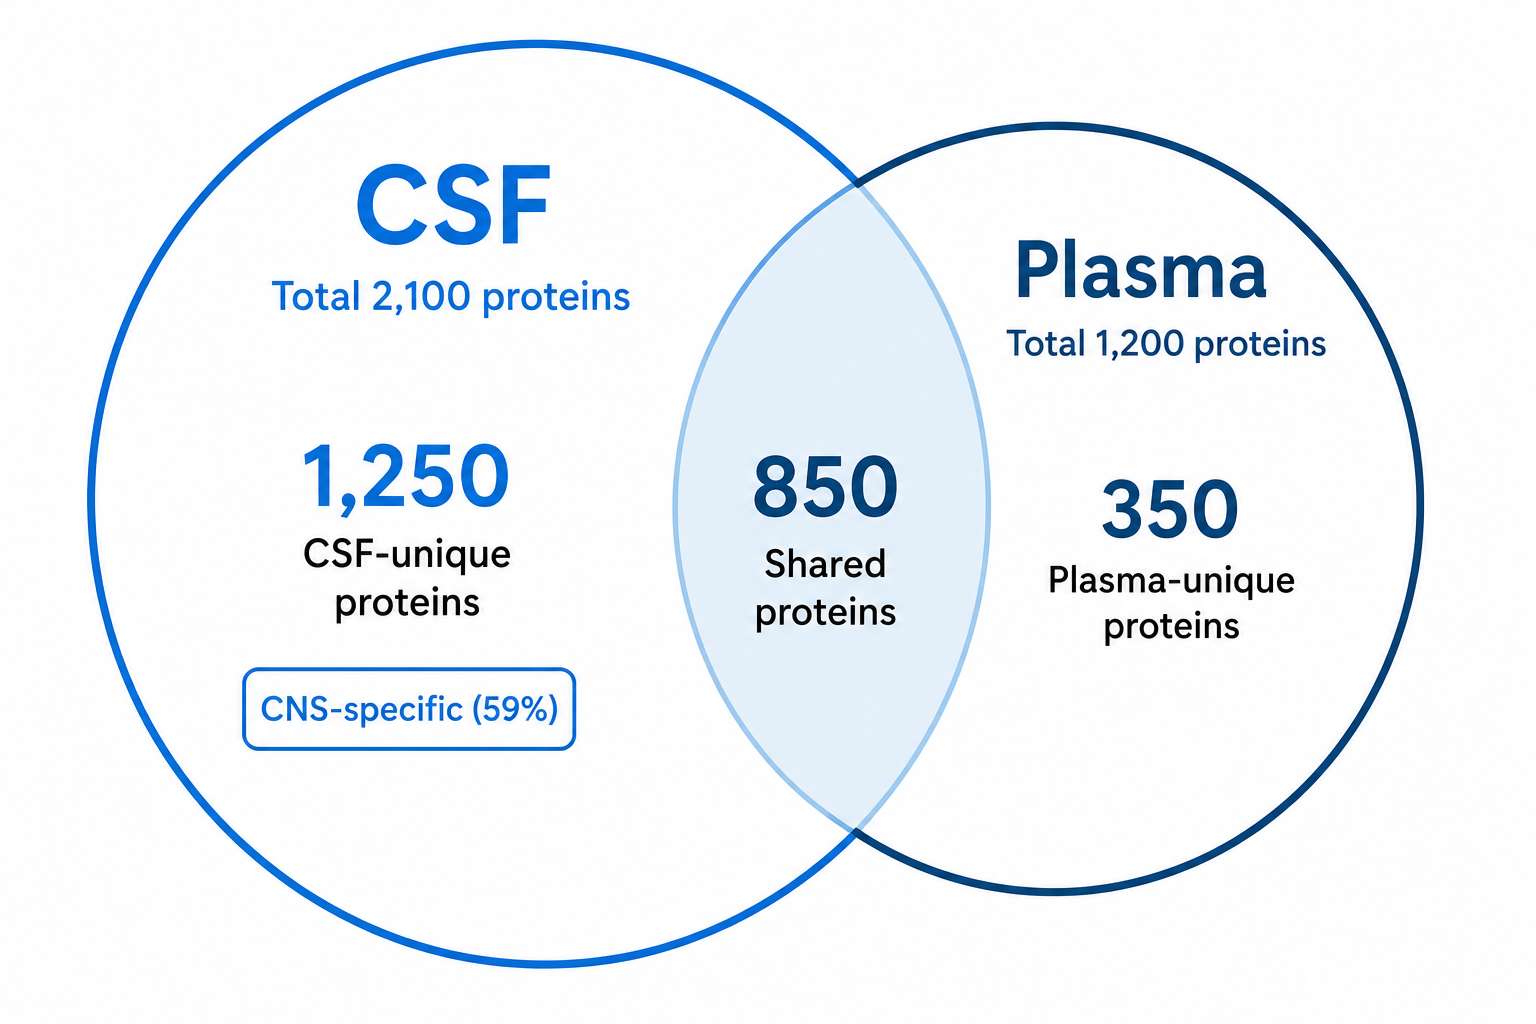
CSF vs plasma protein overlap — ~40% of CSF proteins are not detected in paired plasma samples, representing CNS-specific biology.
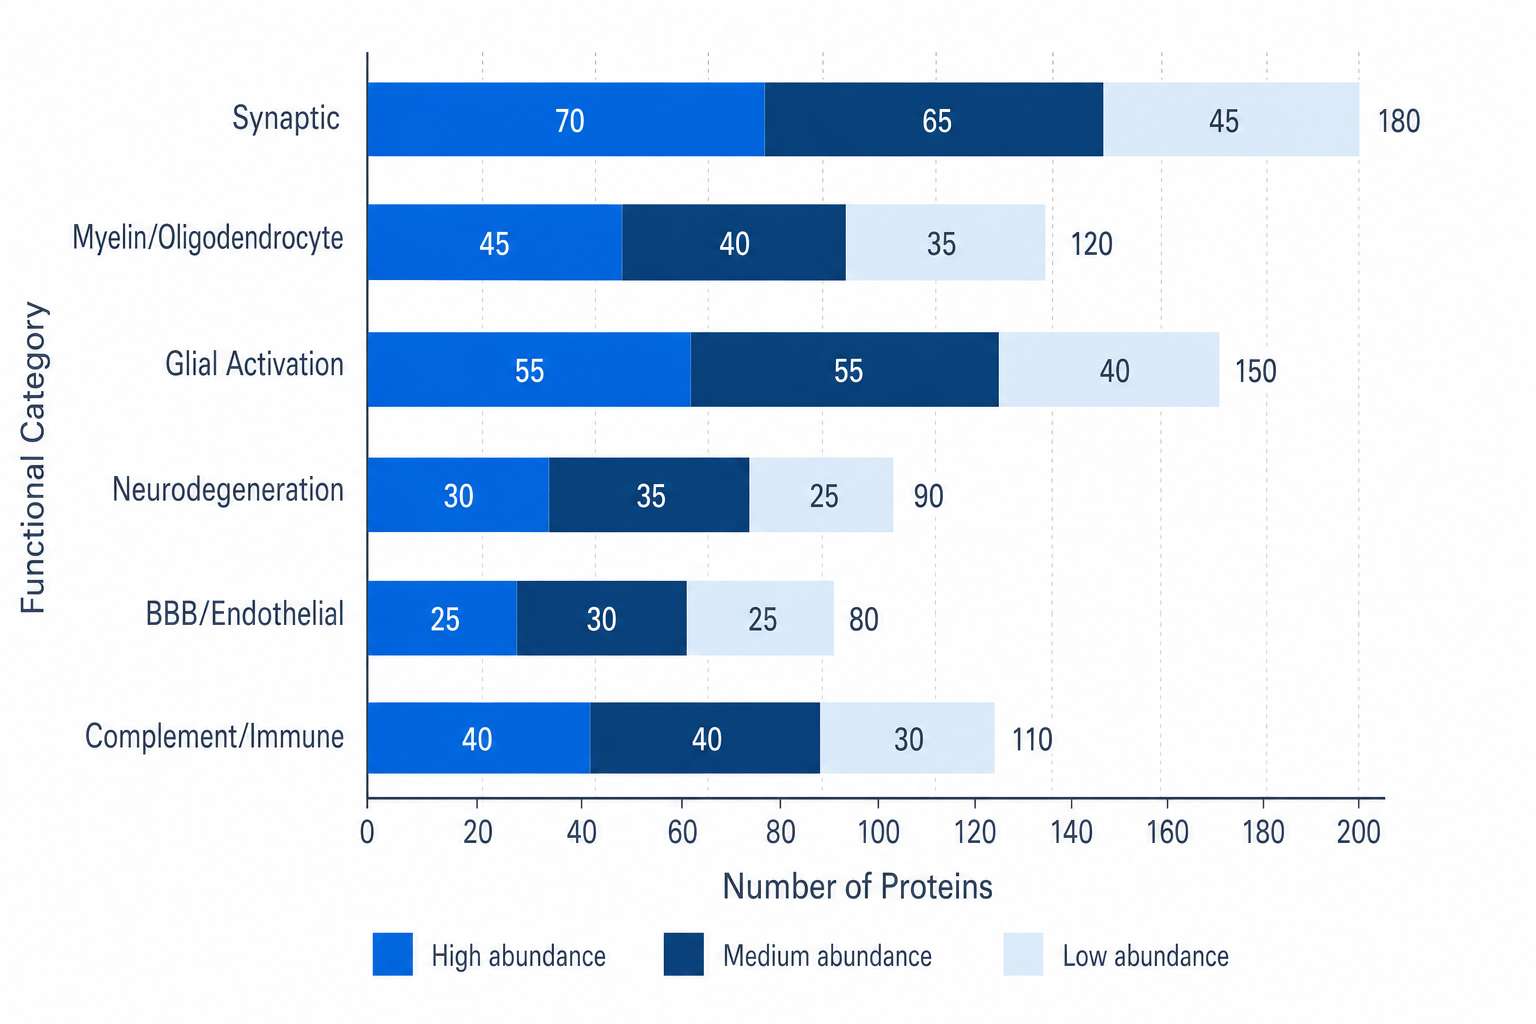
Functional annotation of CSF proteome — synaptic, myelin, glial, and neurodegeneration proteins are all quantifiable in a single DIA run.
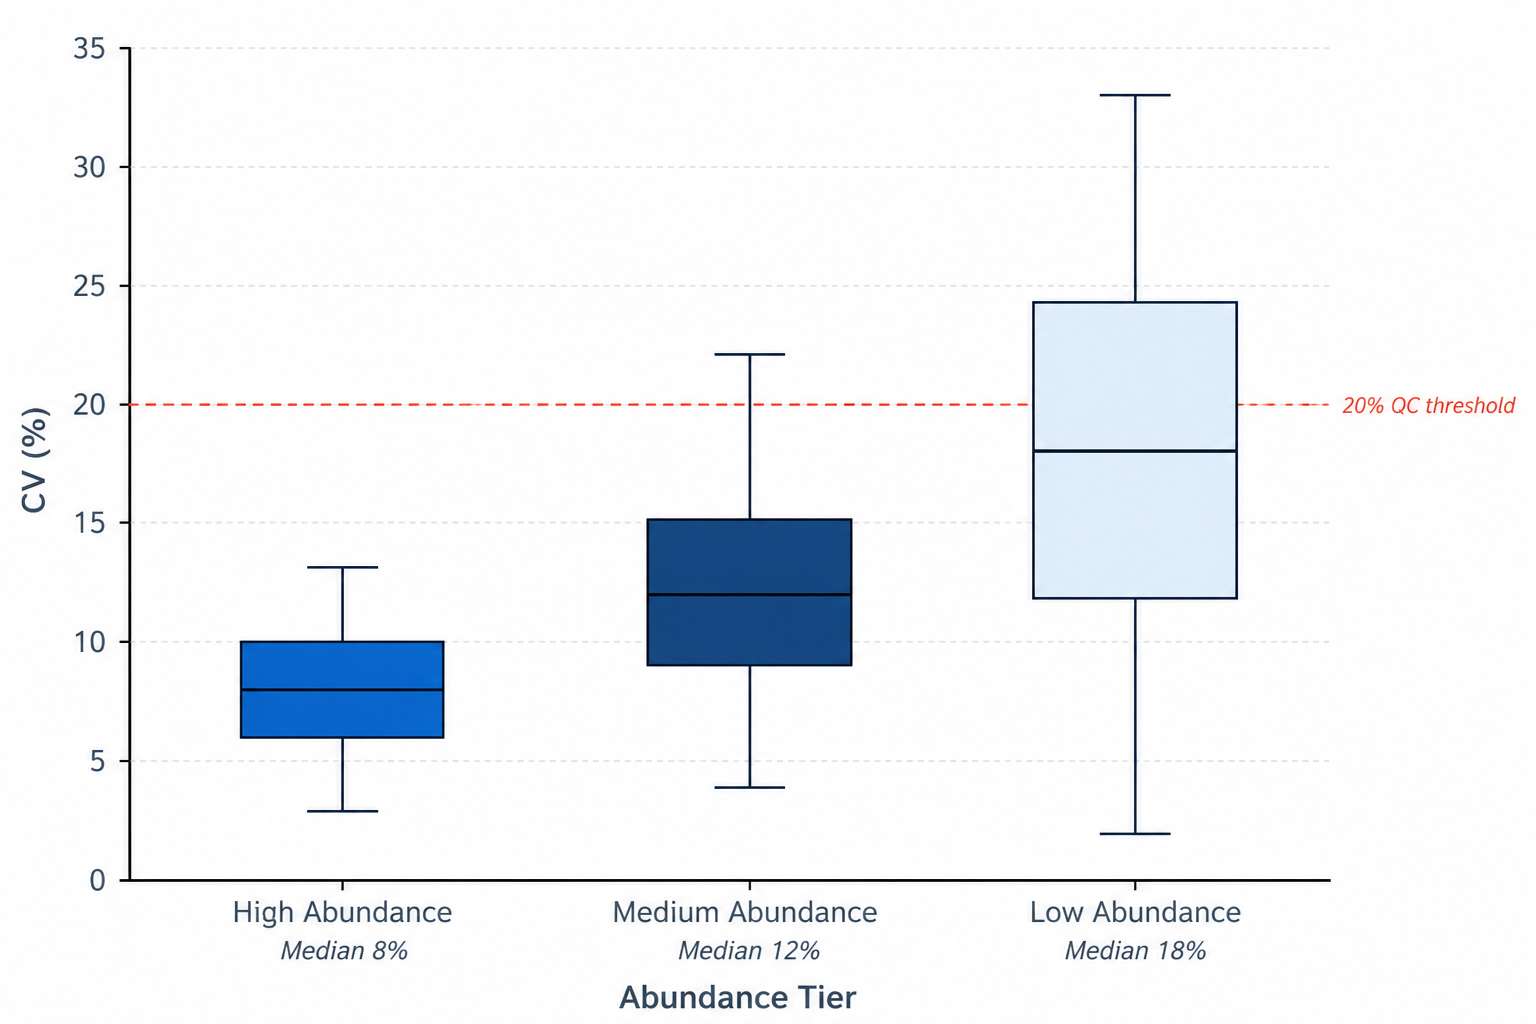
Cohort reproducibility — median CV below 15% across 100+ CSF samples, with depletion and DIA maintaining consistency across clinical batches.
- Protein identification and quantification matrix: 1,500–2,600 proteins × N samples
- Depletion efficiency QC and protein recovery report
- Differential expression analysis with full statistics
- Volcano plots, PCA, hierarchical clustering
- GO, KEGG, Reactome pathway enrichment
- Protein-protein interaction network analysis
- Biomarker ROC analysis and panel development
- Raw DIA data files (.d or .raw format)
- Complete QC report with batch and depletion metrics
- Detailed experimental methods documentation
CSF Proteomics Frequently Asked Questions
Case Study: CSF Proteomics Identifies 8 Novel Parkinson's Disease Biomarkers
3,683
CSF proteins identified
505
differentially expressed PD vs control
8
biomarkers validated by PRM
2
first-ever CSF discoveries
Background
Parkinson's disease diagnosis relies on clinical motor examination — by the time symptoms appear, substantial neuronal loss has already occurred. CSF biomarkers that reflect the underlying molecular pathology are urgently needed to enable earlier diagnosis, track disease progression, and identify targets for disease-modifying therapies. While alpha-synuclein aggregation is the hallmark pathology, the broader CSF proteomic landscape of Parkinson's disease remained largely unexplored.
Study Design & Samples
The study analyzed CSF from 40 Parkinson's patients and 40 age-matched healthy controls in the discovery phase. Proteins were depleted of high-abundance species, digested, and analyzed by TMT-based quantitative MS for deep proteome profiling. The resulting CSF proteomic data were integrated with previously published substantia nigra tissue proteomic data — a strategy that enriches for candidates with concordant changes at both the tissue and biofluid level, directly reflecting brain pathophysiology. An independent verification cohort of 80 PD patients and 80 controls was used for PRM-based validation. An additional DLB cohort (80 patients) was included to test disease specificity.
Technical Methods
Discovery: TMT-MS deep proteome profiling of CSF (40 PD, 40 control). 3,683 proteins identified, 1,425 quantified across all samples. 505 significantly differentiated PD from controls. Tissue integration: CSF candidates cross-referenced with substantia nigra tissue proteomic data to prioritize proteins with concordant brain-CSF changes. Verification: PRM targeted assays for 34 prioritized candidates, tested in an independent cohort of 80 PD and 80 controls. Disease specificity: Verified candidates tested against an 80-patient DLB cohort to assess whether biomarkers were PD-specific or reflected broader synucleinopathy.
Key Findings
| Metric | Result | Significance |
|---|---|---|
| CSF proteome depth | 3,683 proteins identified, 1,425 quantified | Deep CSF coverage capturing synaptic, glial, and neurodegenerative protein classes |
| PD vs control discrimination | 505 differentially expressed proteins | Broad proteomic remodeling detectable in CSF — not limited to a handful of known markers |
| Validated biomarkers | 8 proteins confirmed by PRM: VSTM2A, VGF, SCG2, PI16, OMD, FAM3C, EPHA4, CCK | First-ever identification of PI16 in PD and CCK in PD CSF — discoveries that targeted immunoassays would have missed |
| Disease specificity | CCK and OMD significant after controlling for age and sex | Biomarkers robust to clinical confounders — essential for translation to clinical testing |
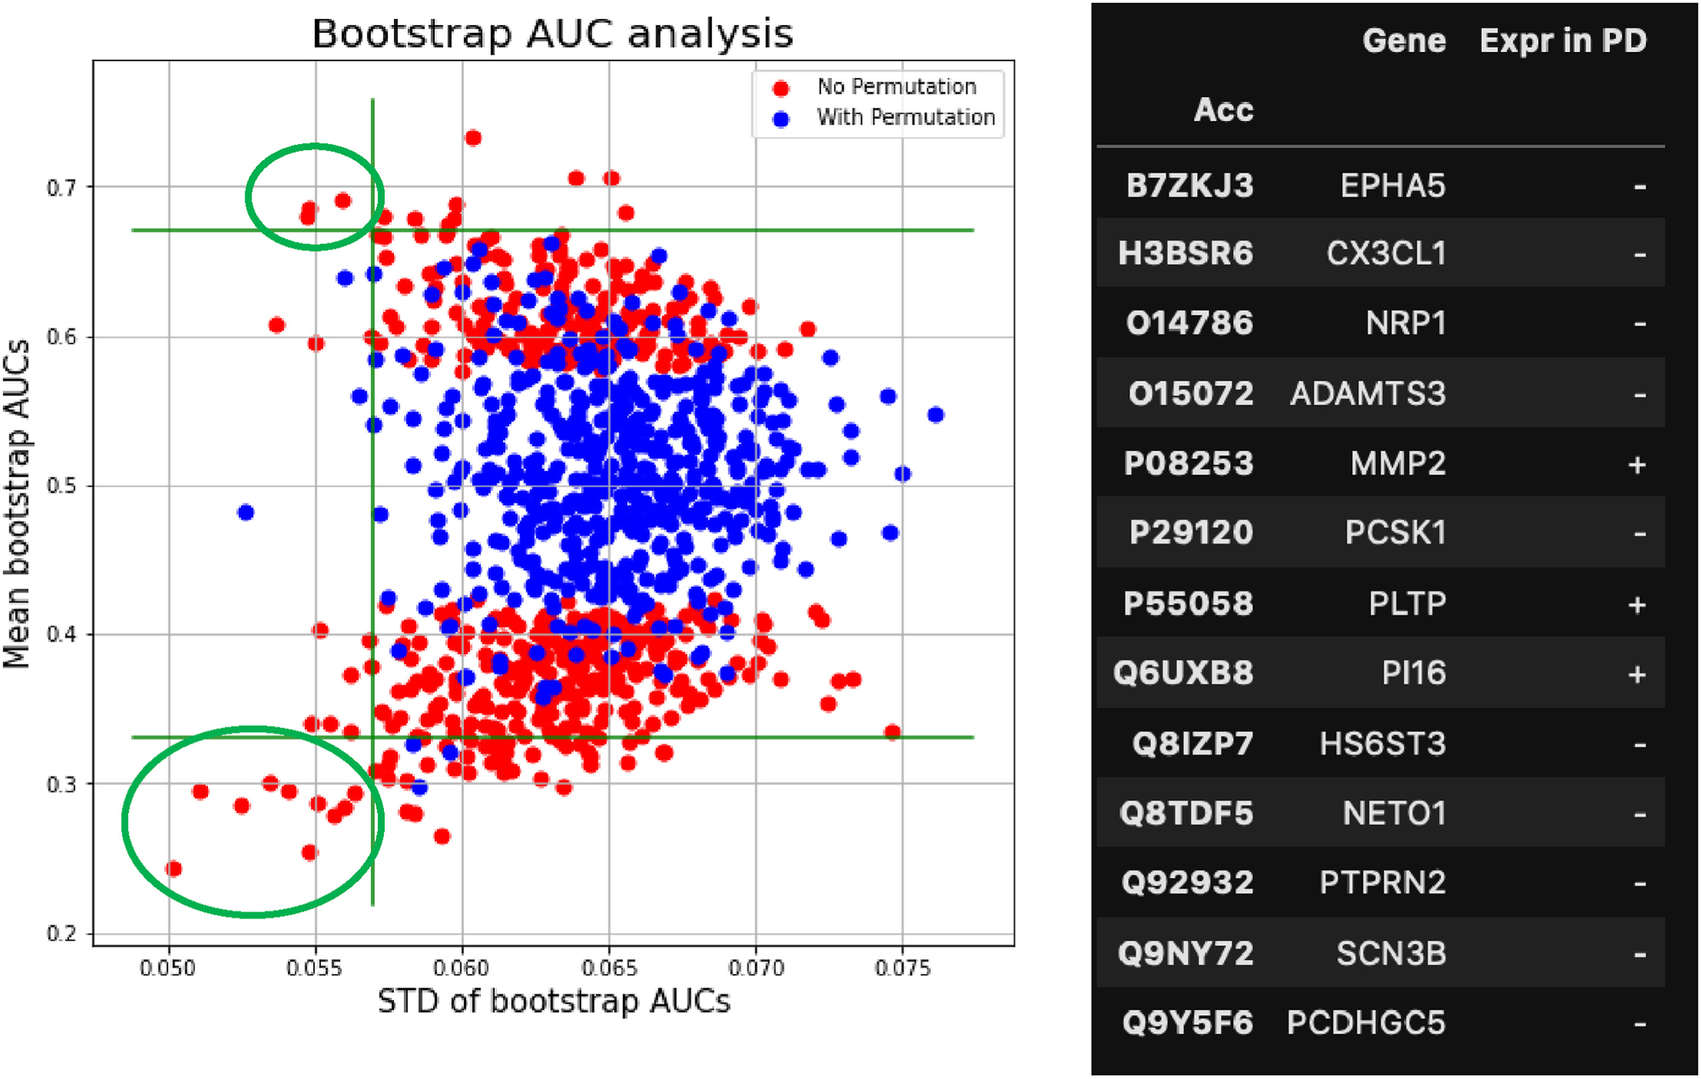
Discovery phase: TMT-MS deep proteome profiling of CSF — 3,683 proteins identified, 505 significantly differentiating Parkinson's disease from healthy controls.
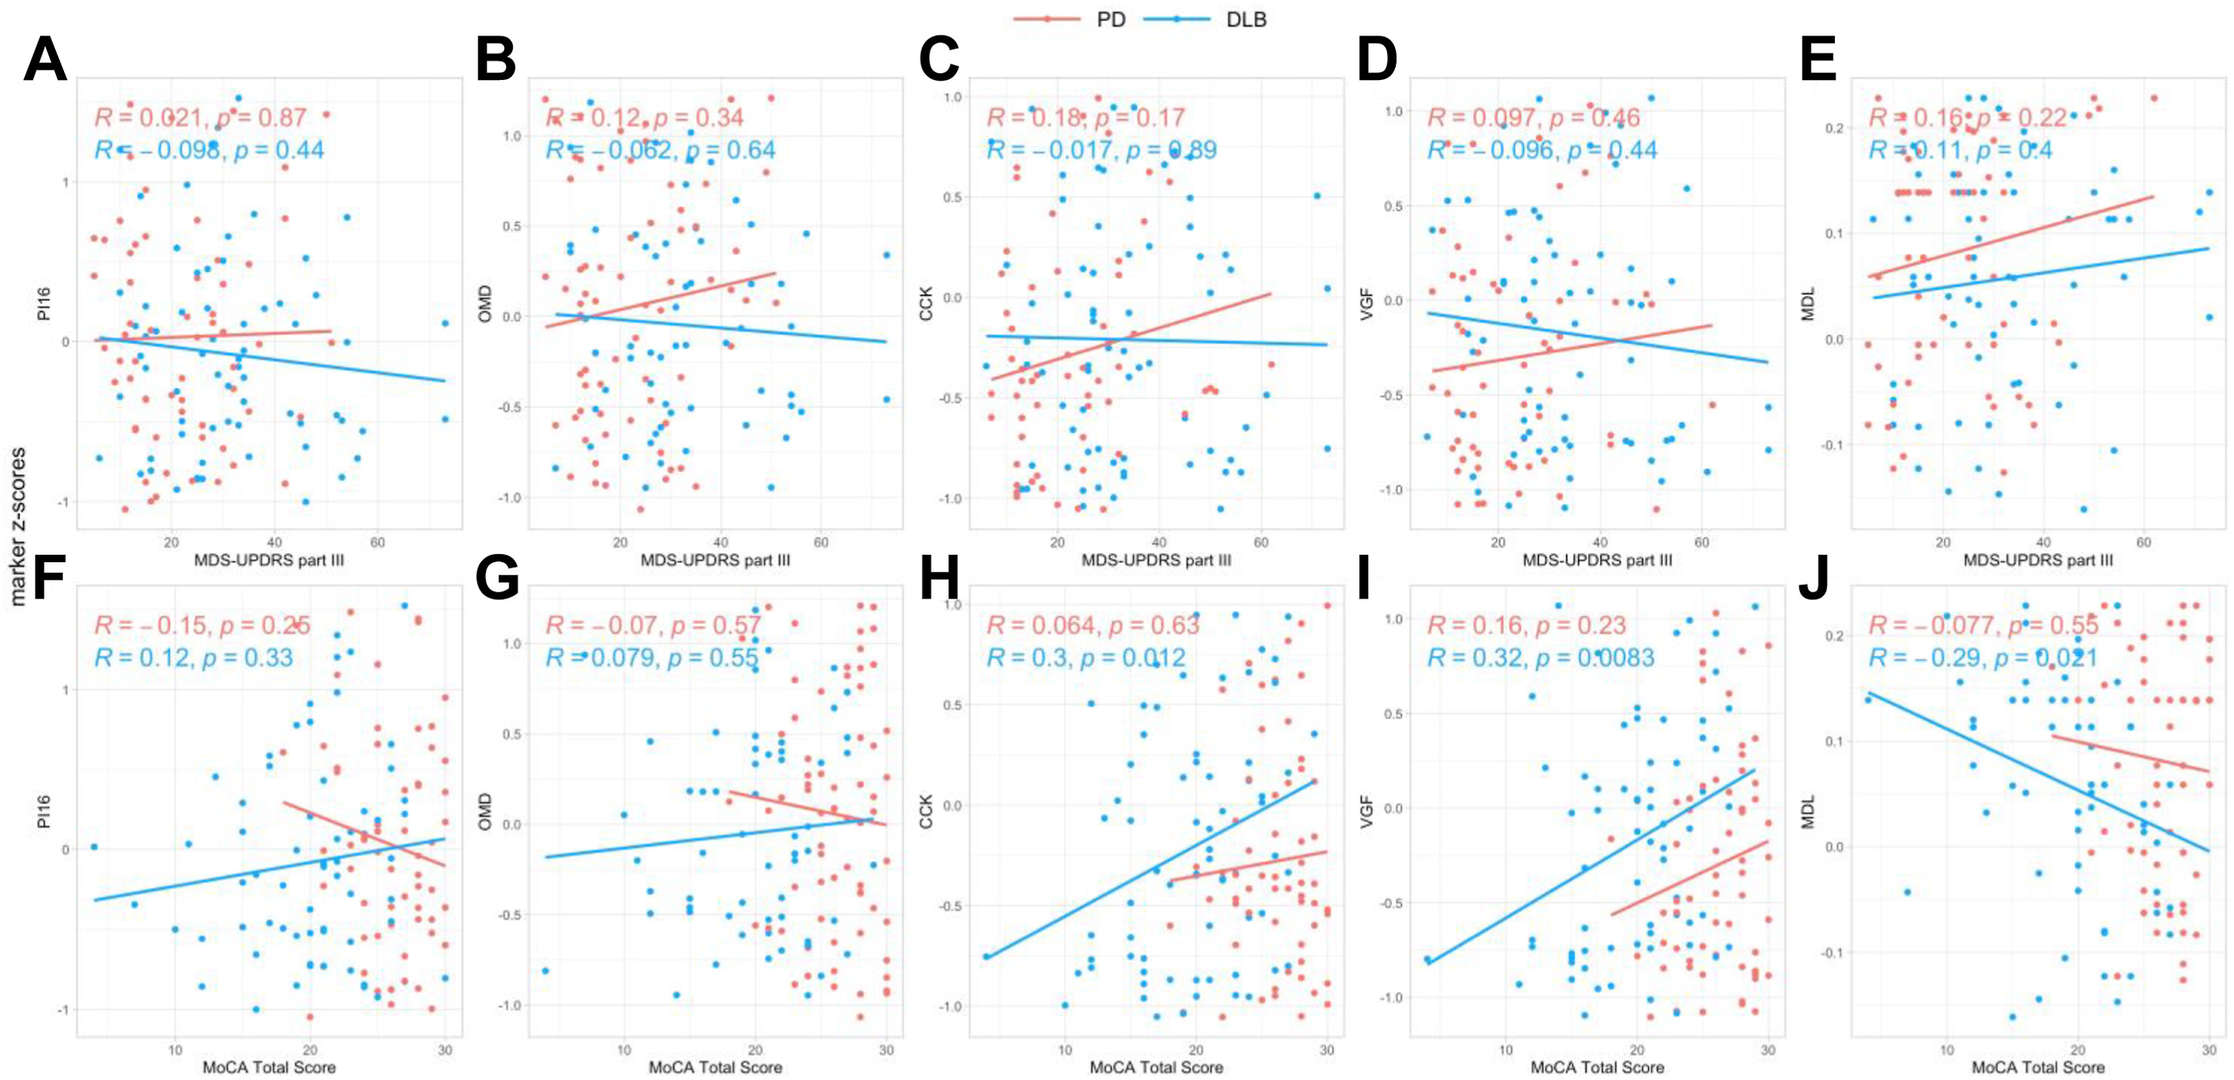
Verification phase: 8 biomarkers validated by PRM in an independent cohort — including first-ever identification of PI16 in PD and CCK in PD CSF.
What This Means for CSF Proteomics Studies
- CSF proteomics discovers what targeted assays miss. The study identified PI16 and CCK in Parkinson's CSF for the first time — proteins that no existing immunoassay panel includes. Unbiased DIA discovery is essential because neurodegenerative disease proteomics is still in its discovery phase; the most valuable biomarkers may not yet be in any commercial panel.
- Tissue-integrated CSF analysis prioritizes brain-relevant biomarkers. Cross-referencing CSF proteomics with substantia nigra tissue data filtered out systemic confounders and retained proteins with concordant changes at the site of pathology. This integration strategy dramatically increases the biological relevance of CSF biomarker candidates.
- PRM verification confirms discovery findings in independent patients. Of 34 candidates prioritized from discovery, 8 validated in a completely separate cohort — a 24% confirmation rate that reflects the rigor of the staged pipeline. Directly transitioning from discovery to clinical claims without verification is the most common cause of biomarker failure.
Reference: Oh S, Jung J, Kim J, et al. Discovery and validation of biomarkers for Parkinson's disease from human cerebrospinal fluid using mass spectrometry-based proteomics analysis. eBioMedicine. 2025. doi:10.1016/j.ebiom.2025.105844