
To Deplete or Not to Deplete — That Is the Real Question
Every plasma proteomics project starts with the same fork in the road. Do you remove albumin, IgG, and the other dominant plasma proteins before MS analysis — or leave them in and rely on DIA to handle the dynamic range?
The conventional answer has always been "deplete." Albumin alone accounts for ~55% of plasma protein mass; IgG adds another ~15%. Remove them, the logic goes, and your mass spectrometer stops wasting time on a handful of abundant proteins and starts detecting the interesting ones. But depletion has costs that compound at scale: immunoaffinity columns add $15–30 per sample, they bind not only the targets but also proteins carried on albumin and IgG, and every additional sample processing step introduces variability. Run a 500-sample cohort with depletion, and you've added two weeks of hands-on prep time and significant consumable cost — for data that still has gaps.
DIA quantitative proteomics offers a third path. Because DIA doesn't select precursors — it fragments everything — high-abundance peptides don't monopolize the instrument. Albumin peptides still appear in the spectra, but they don't crowd out low-abundance signals the way they do in DDA. The result: 1,000+ quantified proteins from undepleted plasma. No columns. No extra cost. No albumin-bound protein loss. For screening studies, population cohorts, and any project where simplicity and reproducibility matter more than maximum depth, this changes the economics of plasma proteomics.
Content Guide
- Undepleted vs Depleted: The Two Paths
- What Undepleted DIA Covers
- When Deep Plasma Coverage Is Needed
- Plasma Sample Quality Factors
- Sample Requirements
- Deliverables
Undepleted vs Depleted Plasma Proteomics: How to Choose
Most labs default to depletion because that's what they've always done. The right choice depends on what you're actually trying to measure and how many samples you have.
| Path A: Undepleted DIA | Path B: Depleted + Fractionated DIA | |
|---|---|---|
| Proteins per sample | 1,000–1,500 | 2,000+ |
| What you see | Acute phase proteins, complement cascade, coagulation factors, apolipoproteins, moderate-abundance tissue leakage markers, protease inhibitors | Everything in Path A, plus: cytokines, growth factors, low-abundance signaling proteins, deep tissue leakage markers, proteins in the pg/mL range |
| What you don't see | Proteins below ~100 ng/mL — most cytokines, many growth factors, low-level tissue-specific proteins | Proteins below ~1 ng/mL — requires targeted assays or affinity-based methods |
| Sample prep per 100 samples | ~4 hours total. Direct digest → S-Trap cleanup → MS | ~16 hours total. Depletion → buffer exchange → digest → fractionation → MS |
| Reproducibility (median CV) | <15% across 500-sample cohorts | <20% across 200-sample cohorts (additional steps add variability) |
| Best fit | Biobank screening (100–1,000+ samples), population proteomics, biomarker discovery for abundant plasma proteins, clinical trial baseline profiling | Deep mechanistic studies (<100 samples), cytokine/growth factor discovery, projects where the biology is in the low-abundance range |
Still not sure which path fits your project? The practical answer is often:
Start with Path A on your full cohort
Undepleted DIA on all 100–1,000+ samples for statistical power. Screen for differentially expressed proteins, build preliminary biomarker panels, identify subgroups.
Then apply Path B on a subset
Depleted + fractionated DIA on 20–30 samples per phenotype group for deep characterization. Discover low-abundance markers, map signaling networks.
This two-tier approach gives you both statistical power and mechanistic depth — at roughly half the cost of running the entire cohort through depletion.
What Undepleted Plasma DIA Detects
The question we hear most often: "If I don't deplete, am I just measuring albumin and a few acute phase proteins?" The answer is no — and the data proves it.
In undepleted plasma DIA, albumin and IgG still dominate the total ion current, but DIA's systematic fragmentation captures peptides from proteins across the full dynamic range. The 1,000+ proteins you identify are distributed across all major plasma protein classes:
Complement
C3, C4, C5–C9, factor H, factor B, C1-inhibitor, MBL
Coagulation
Fibrinogen, prothrombin, antithrombin, plasminogen, factor X, protein S
Apolipoproteins
ApoA-I through ApoE, Apo(a), ApoM, ApoC-III, ApoH
Acute Phase
CRP, SAA, haptoglobin, ceruloplasmin, α1-acid glycoprotein
Protease Inhibitors
α1-antitrypsin, α2-macroglobulin, antichymotrypsin, serpins
Tissue Leakage
Troponin, BNP, liver enzymes, LDH, neuron-specific enolase
What you won't see without depletion: most interleukins, TNF-family cytokines, chemokines below ~100 pg/mL, and very low-abundance tissue-specific proteins. These require the deep workflow — or, for the lowest-abundance targets, affinity-based methods. Our service is transparent about these boundaries because choosing the right tool matters more than claiming universal coverage.
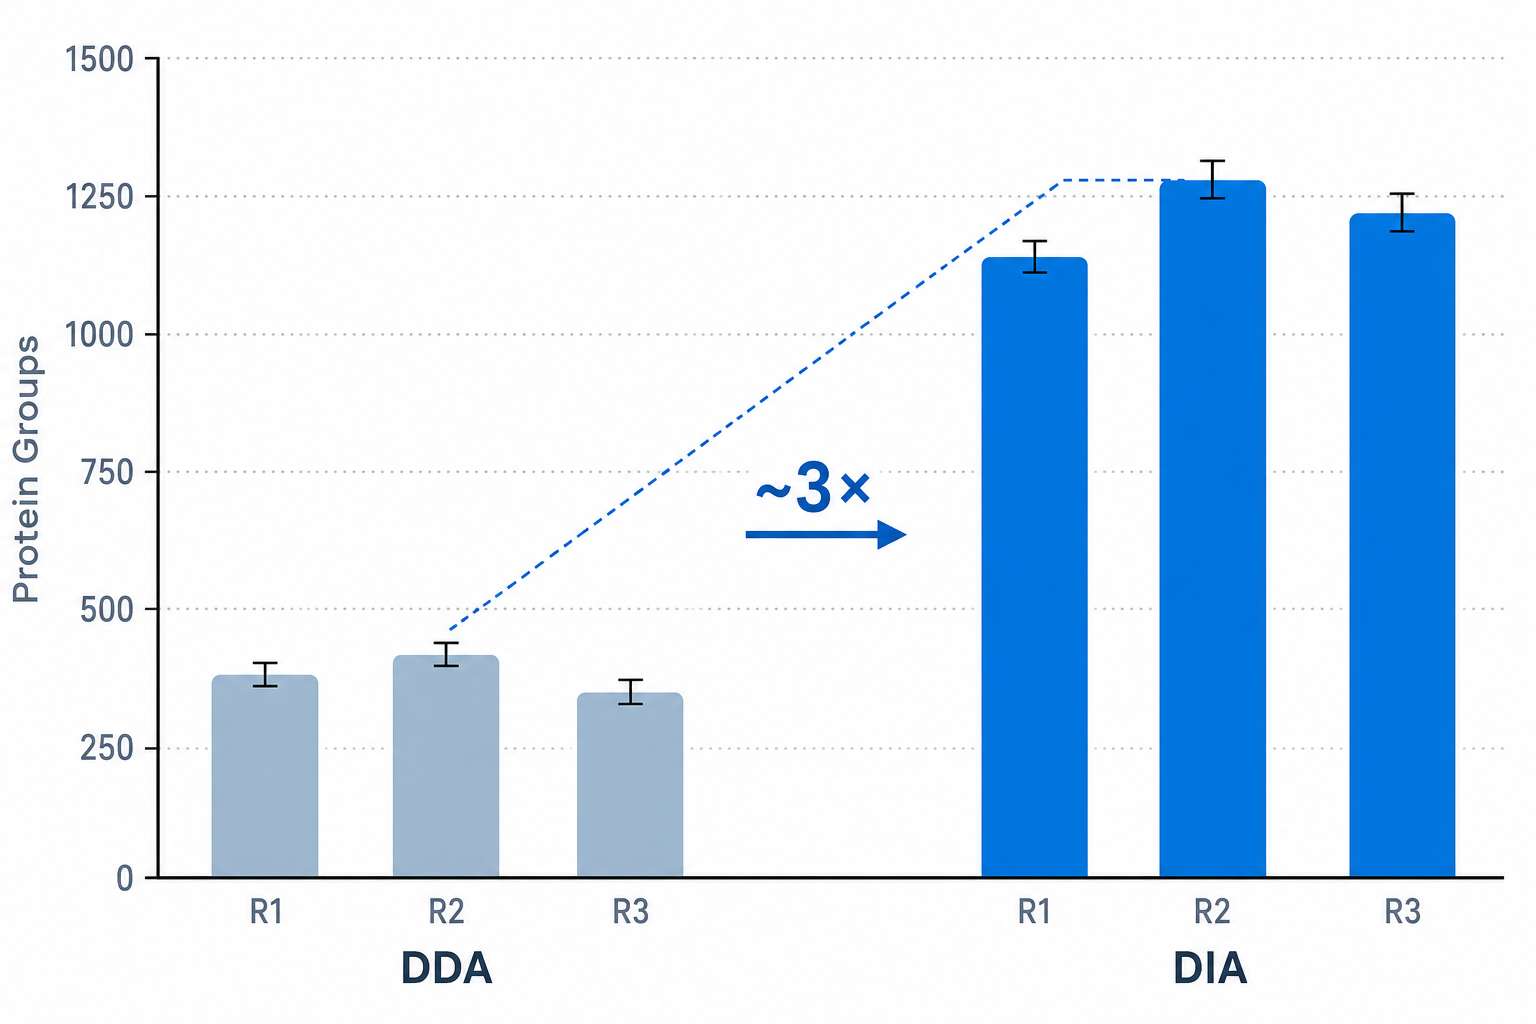
Same undepleted plasma sample, two acquisition methods. DDA: 380 proteins. DIA: 1,220 proteins. The difference is systematic precursor fragmentation — not a different sample or protocol.
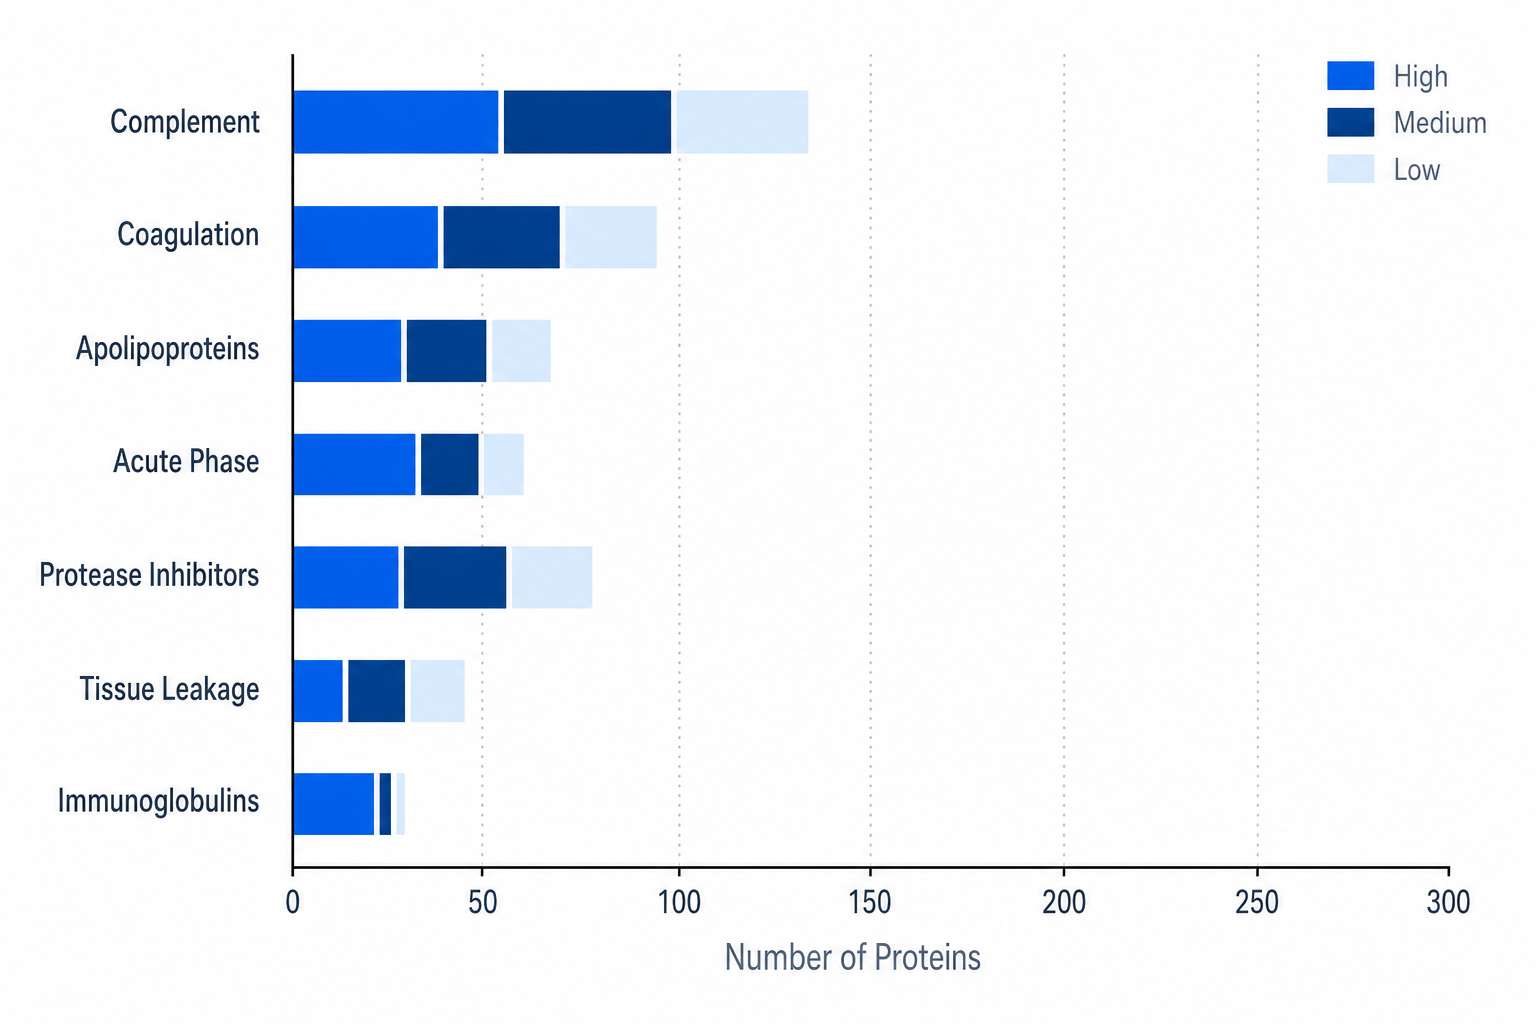
Protein classes quantified from undepleted plasma — complement, coagulation, apolipoproteins, protease inhibitors, and tissue leakage markers all represented across abundance tiers.
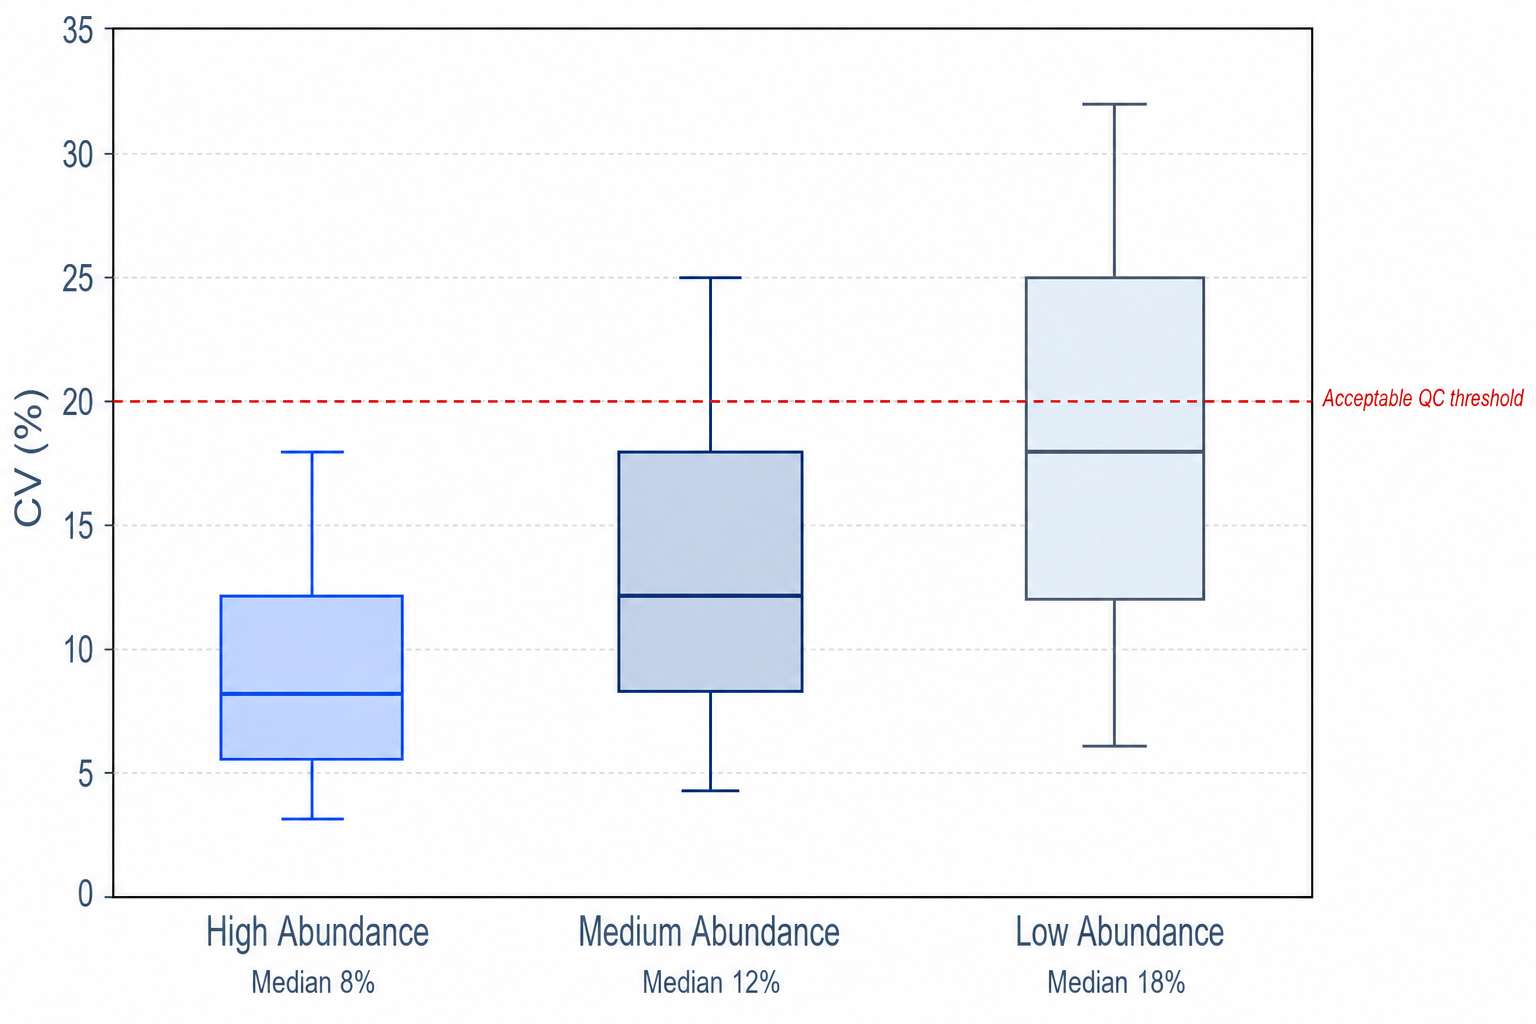
CV distribution across a 500-sample undepleted plasma cohort. Median CV below 15% — the simpler prep translates directly to better reproducibility at scale.
Deep Plasma Proteomics with Depletion and Fractionation
Some biological questions live entirely in the low-abundance range. Cytokine storm characterization. Growth factor signaling in tumor microenvironments. Neurodegenerative disease biomarkers at pg/mL concentrations. For these projects, depletion is necessary — and we offer a workflow optimized for depth without sacrificing rigor.
Our depleted workflow uses Top12 or Top14 immunoaffinity columns to remove albumin, IgG, and additional high-abundance proteins, followed by off-line high-pH reversed-phase fractionation into 6 or 12 fractions per sample. Each fraction is acquired by DIA and the results are combined computationally. The tradeoff is throughput — fractionation multiplies instrument time by the number of fractions — but the gain is access to an additional order of magnitude in protein concentration. A typical depleted + fractionated plasma DIA run quantifies 2,000+ proteins, including cytokines and growth factors in the low ng/mL to pg/mL range.
A practical note for cohort studies: don't run your entire 500-sample cohort through fractionation. Instead, fractionate a representative subset (n = 20–30 per group) to identify candidate biomarkers in the deep proteome, then develop targeted proteomics PRM assays to quantify those specific candidates across the full cohort. This hybrid strategy gives you both discovery depth and statistical power without breaking your budget on fractionation.
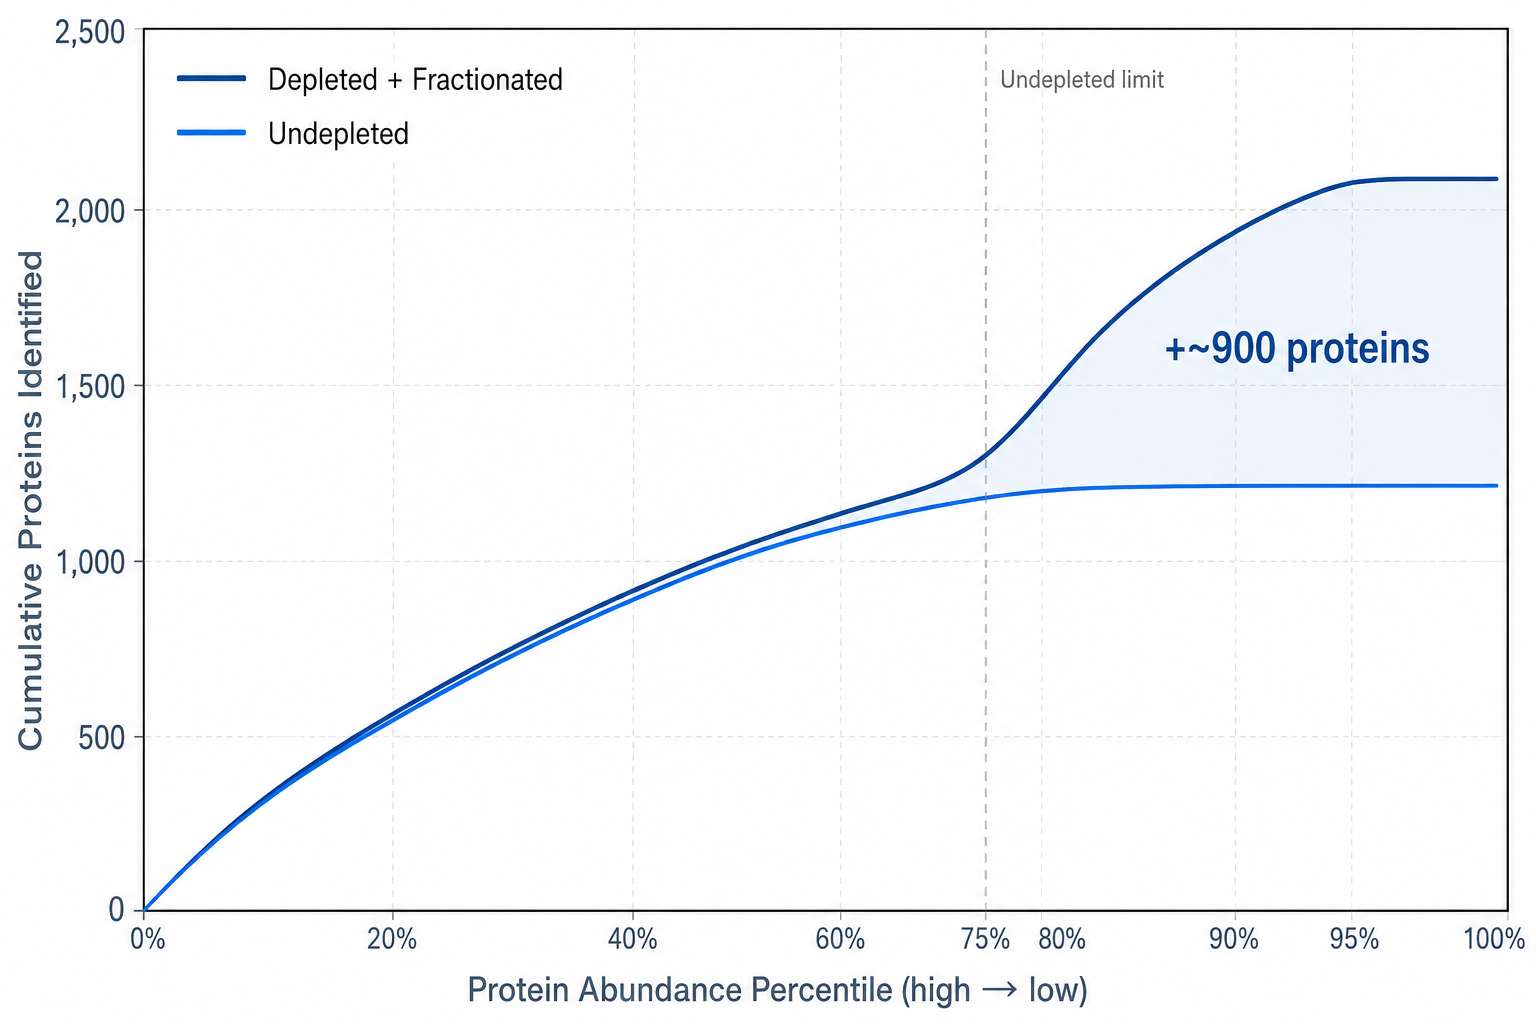
Undepleted vs depleted cumulative coverage — depletion extends detection by roughly one order of magnitude, adding ~900 proteins in the low-abundance range.
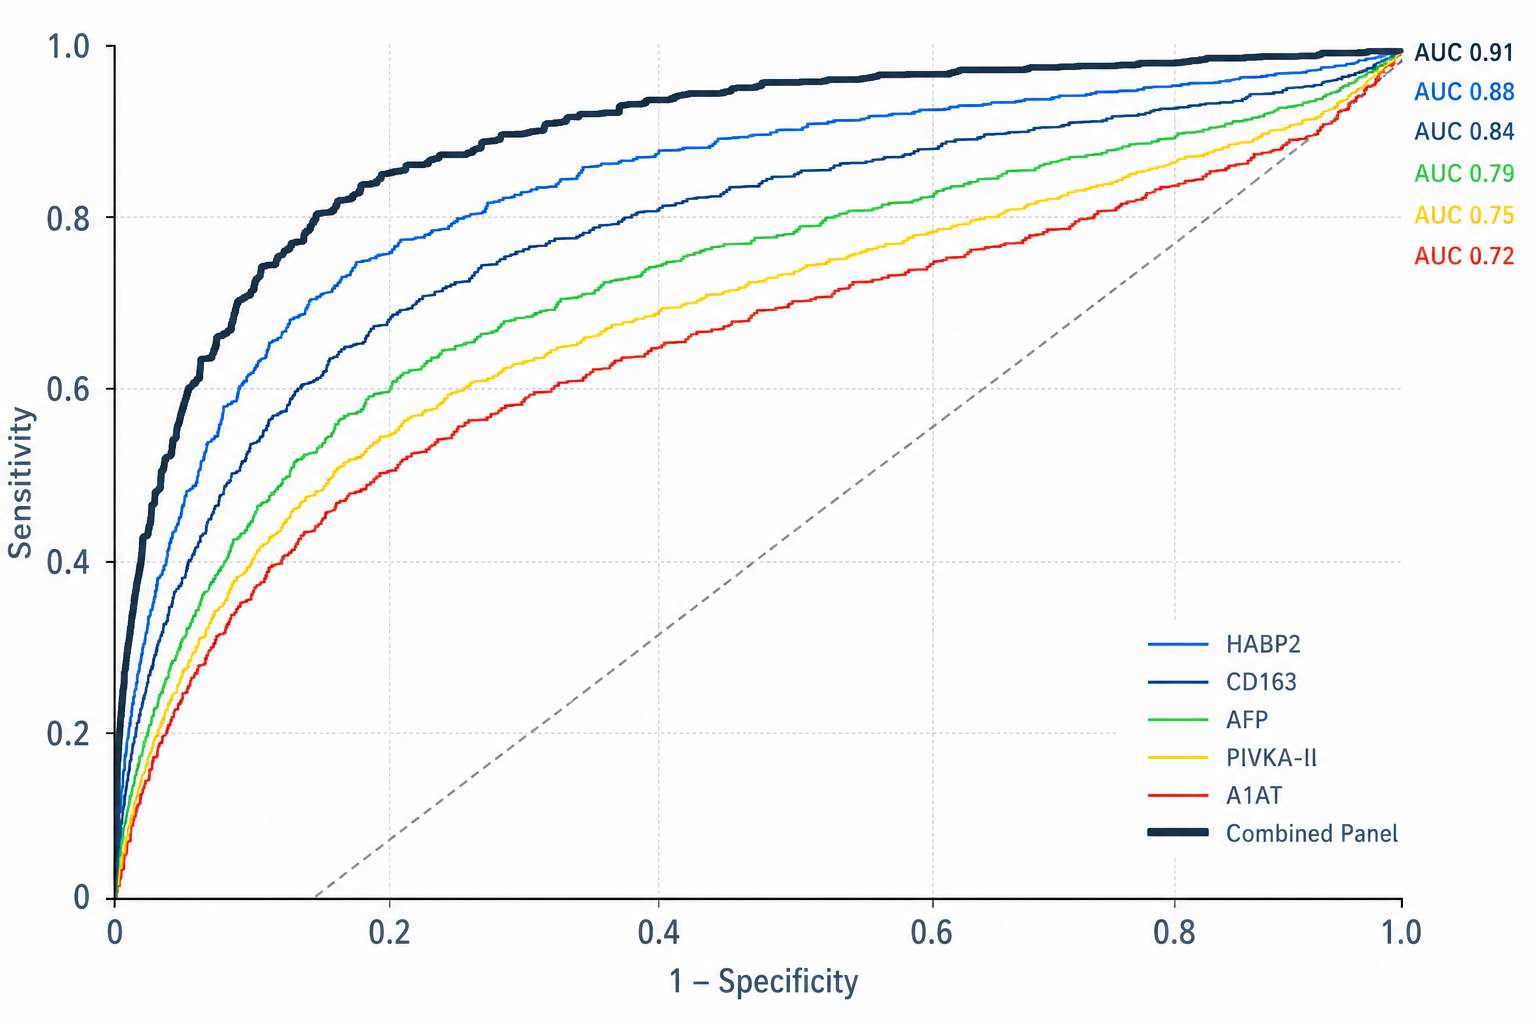
Plasma protein biomarker ROC analysis — five individual candidates with AUC 0.72–0.88, combined panel AUC 0.91.
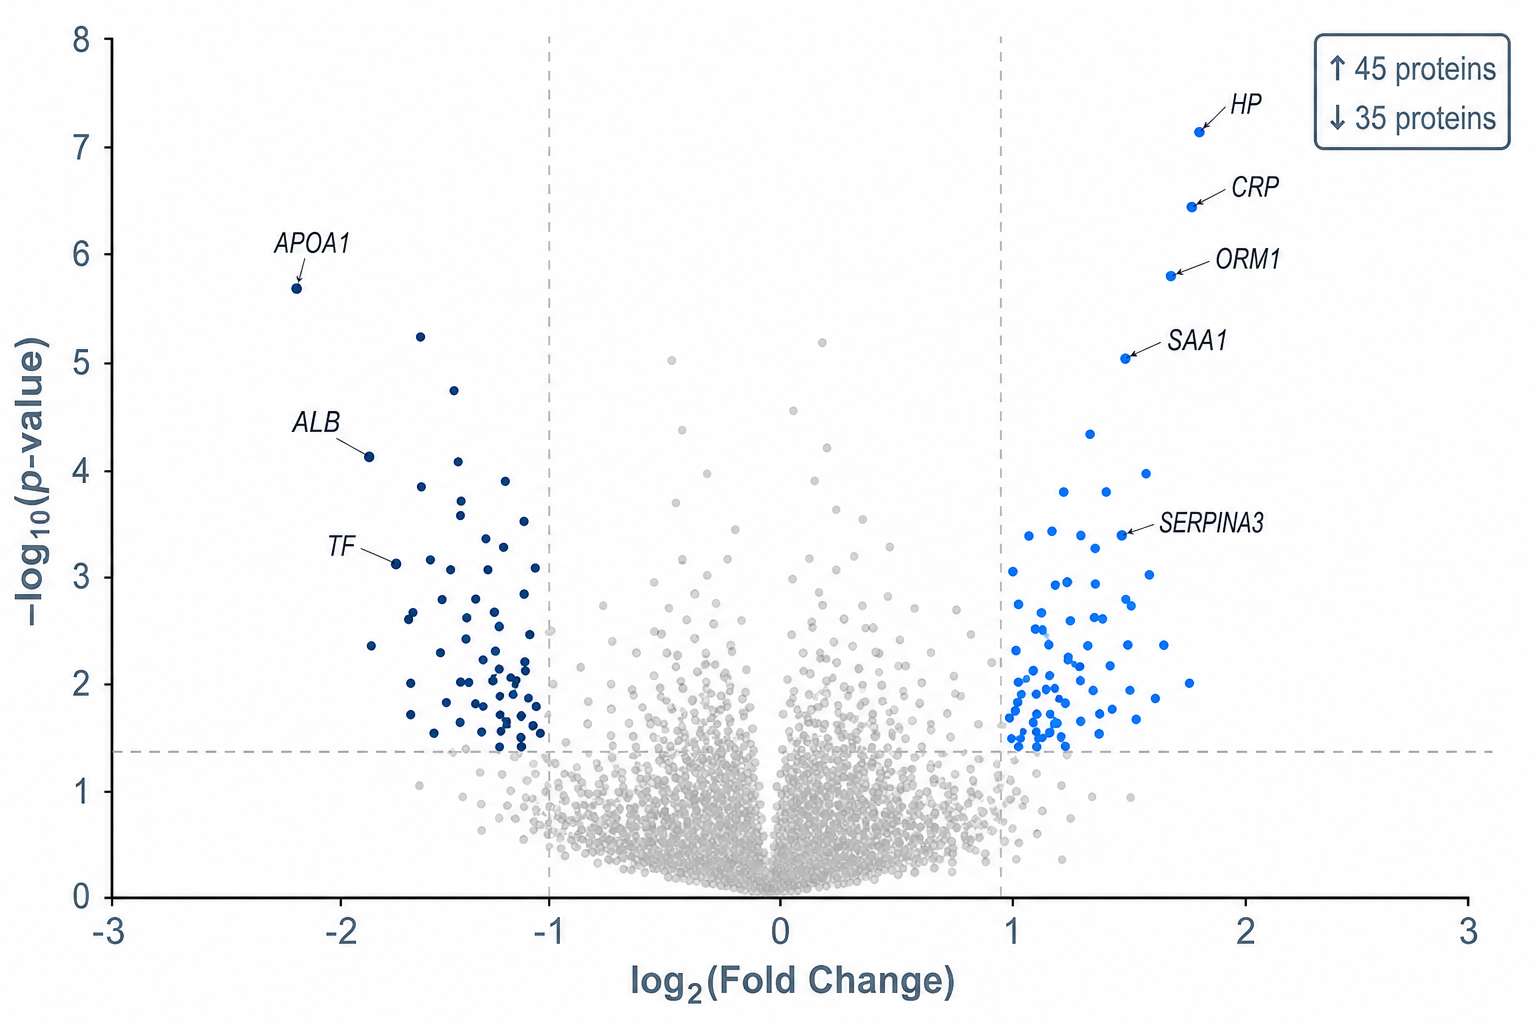
Differential plasma protein analysis — volcano plot showing significantly up- and down-regulated proteins between groups, with top candidates annotated by gene name.
Plasma-Specific Factors That Determine Data Quality
Plasma proteomics is uniquely sensitive to pre-analytical variables. The same patient's plasma can yield dramatically different proteomics results depending on how the blood was drawn, processed, and stored. These factors matter more than the mass spectrometer you use.
| Factor | What Happens If You Get It Wrong | Our Recommendation |
|---|---|---|
| Tube type | Heparin tubes produce co-precipitates that suppress peptide ionization, reducing IDs by 30–50%. Citrate dilutes plasma (~10%), shifting protein concentrations. Serum clotting activates platelets and proteases, altering the coagulation and complement proteomes. | EDTA plasma is the standard. If your biobank only has citrate or serum, we can work with it — but note the limitation in the final report. Do not use heparin. |
| Time to centrifugation | Blood left at room temperature for >4 hours shows increased protease activity, degrading low-abundance proteins and generating peptide fragments that inflate apparent protein counts without biological meaning. | Centrifuge within 2 hours of collection. For multi-site studies, provide site-specific SOPs and log collection-to-centrifugation time for every sample. |
| Hemolysis | Hemolyzed plasma (pink/red) contains hemoglobin and erythrocyte proteins that dominate MS spectra, masking true plasma proteins. Even mild hemolysis can reduce quantification accuracy by 20–30% for low-abundance targets. | Score hemolysis at every sample. We quantify hemoglobin peptides by MS as an objective hemolysis index. Samples with scores above threshold are flagged and can be excluded from quantitative comparisons. |
| Freeze-thaw cycles | Each freeze-thaw cycle degrades proteins progressively — low-abundance proteins are disproportionately affected. Three cycles can reduce detectable protein counts by 15–25%. | Aliquot on first thaw. Maximum 2 freeze-thaw cycles. If your biobank samples have unknown freeze-thaw history, we can assess degradation by MS and advise on exclusions. |
| Collection site variability | Different sites use different tube brands, centrifuge speeds, and processing delays. This introduces systematic proteomic differences that can be mistaken for biological signal. | Standardize collection SOPs across all sites. Randomize cases and controls within each site. Include site as a covariate in statistical models. |
- Pre-analytical QC is included with every project — hemolysis scoring, peptide degradation assessment, and freeze-thaw quality metrics on every sample
- Collection SOPs provided for multi-site studies — tube type, centrifugation protocol, aliquot volume, shipping conditions
- For biobanks with existing samples of unknown provenance, we offer a 10-sample pilot with comprehensive quality scoring before you commit to the full cohort
Plasma and Serum Sample Collection Requirements
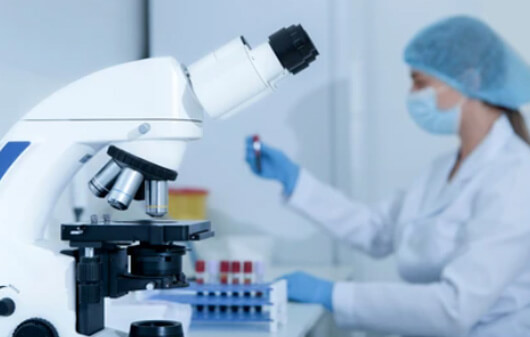
Samples we accept: EDTA plasma (preferred), citrate plasma, serum. Heparin plasma is not compatible with trypsin digestion — we cannot accept heparinized samples.
Biobank samples with unknown history: Submit 5–10 representative samples for pilot quality assessment. We measure hemolysis index, peptide degradation, and protein yield to determine cohort eligibility.
| Sample Type | Minimum Volume | Recommended Volume | Collection Notes |
|---|---|---|---|
| EDTA Plasma | 200 μL | 500 μL | Centrifuge at 2,000g × 10 min, 4°C, within 2 h of collection. Aliquot supernatant. Store at -80°C. |
| Citrate Plasma | 200 μL | 500 μL | Note: ~10% dilution from liquid anticoagulant. Centrifuge as above. |
| Serum | 200 μL | 500 μL | Allow 30 min clotting at RT before centrifugation. Note: coagulation/platelet proteins differ from plasma. |
| Whole Blood (EDTA) | 1 mL | 2 mL | We process to plasma in-house. Ship on cold packs, process within 24 h of collection. |
For studies involving clinical proteomics endpoints, we provide GCP-compatible sample tracking and chain-of-custody documentation.
Plasma Proteomics Deliverables
What you receive depends on the path you choose — but every project includes pre-analytical QC.
Path A Deliverables (Undepleted DIA)
- Protein identification and quantification matrix: 1,000–1,500 proteins × N samples
- Pre-analytical quality report: hemolysis index, degradation score, outlier flagging for every sample
- Differential expression analysis between groups, with multiple testing correction
- Volcano plots, PCA, hierarchical clustering heatmaps
- GO, KEGG, Reactome pathway enrichment of differentially expressed proteins
- Biomarker ROC analysis: individual candidate AUCs plus combined panel
- Raw DIA data files (.d or .raw) and Spectronaut search output
Path B Additions (Depleted + Fractionated DIA)
- Extended quantification matrix: 2,000+ proteins
- Fraction-level QC: peptide and protein IDs per fraction, overlap analysis
- Deep proteome coverage report: protein classes gained vs Path A, by abundance tier
- Network analysis: protein-protein interaction networks and co-expression modules
- Optional: biomarker proteomics panel design — transition top candidates to targeted PRM/MRM assays
Plasma Proteomics Frequently Asked Questions
It matters significantly. EDTA plasma is the standard for proteomics — it chelates calcium and inhibits metalloproteases, preserving the proteome during collection and storage. Citrate plasma introduces ~10% dilution from the liquid anticoagulant. Serum is missing coagulation factors (consumed during clotting) and has a different complement profile (activated by the clotting cascade).
Heparin is not compatible — it co-purifies with peptides and suppresses ionization, reducing protein identifications by 30–50%. If your biobank samples are heparinized, we unfortunately cannot process them for MS-based proteomics.
DIA-MS and affinity-based proteomic approaches provide complementary views of the plasma proteome. High-plex affinity assays measure predefined protein targets using antibodies or other affinity reagents and can offer sensitive detection of many low-abundance proteins. In contrast, DIA-MS directly measures peptides by mass spectrometry and is not restricted to a predefined protein panel, making it useful for broader discovery and characterization of detectable plasma proteins.
Our DIA-based workflow can quantify more than 1,000 proteins in blood, plasma, or serum without high-abundance protein depletion. For selected candidates requiring focused follow-up, targeted mass spectrometry can also be incorporated. The most appropriate strategy depends on the required proteome coverage, target abundance, sample availability, and study objectives.
Case Study: DIA Serum Proteomics Enables HCC Early Detection 11 Months Before Imaging
1,002
individuals screened
0.979
AUC for HCC vs cirrhosis
11.4
months before imaging diagnosis
4
proteins in diagnostic panel
Background
Hepatocellular carcinoma is the fourth leading cause of cancer death worldwide, primarily because most patients are diagnosed too late for curative treatment. Existing serum biomarkers — AFP and PIVKA-II — lack sensitivity for early-stage disease, particularly in distinguishing HCC from benign cirrhosis. A blood test that could detect HCC months before it becomes visible on imaging would fundamentally change patient outcomes, enabling curative resection or ablation while the tumor is still localized.
Study Design & Samples
The study enrolled 1,002 individuals across three independent cohorts. The discovery cohort comprised 320 subjects: 163 HCC patients, 53 cirrhosis patients, 64 patients with underlying liver disease (chronic hepatitis B, alcoholic liver disease, NAFLD), and 40 asymptomatic HBV carriers. The retrospective verification cohort included 429 independent subjects (210 HCC, 115 cirrhosis, 104 healthy controls). The prospective validation cohort enrolled 253 cirrhosis patients followed longitudinally over time for HCC development.
Technical Methods
Discovery: DIA-MS on undepleted serum from the 320-subject cohort. Differentially expressed proteins identified by statistical analysis. Verification: PRM targeted assays developed for candidate biomarkers, applied to 429 independent samples. Machine learning (LASSO regression) used to select a minimal 4-protein panel (HABP2, CD163, AFP, PIVKA-II). Prospective validation: The locked P4 panel was tested on 253 cirrhosis patients with longitudinal follow-up — predicting which patients would develop HCC using only baseline serum samples collected before any imaging evidence of tumors.
Key Findings
| Metric | Result | Significance |
|---|---|---|
| HCC vs cirrhosis discrimination | AUC 0.979, sensitivity 0.925, specificity 0.915 | DIA serum proteomics outperforms AFP alone (AUC ~0.80) for distinguishing cancer from benign liver disease |
| Predicting future HCC in cirrhosis | Median 11.4 months before imaging | Serum proteins change before tumors are radiologically visible — a window for early intervention |
| Prospective validation | Confirmed in independent external cohort (NCT03588442) | DIA-derived biomarkers are reproducible when pre-analytical variables are controlled |
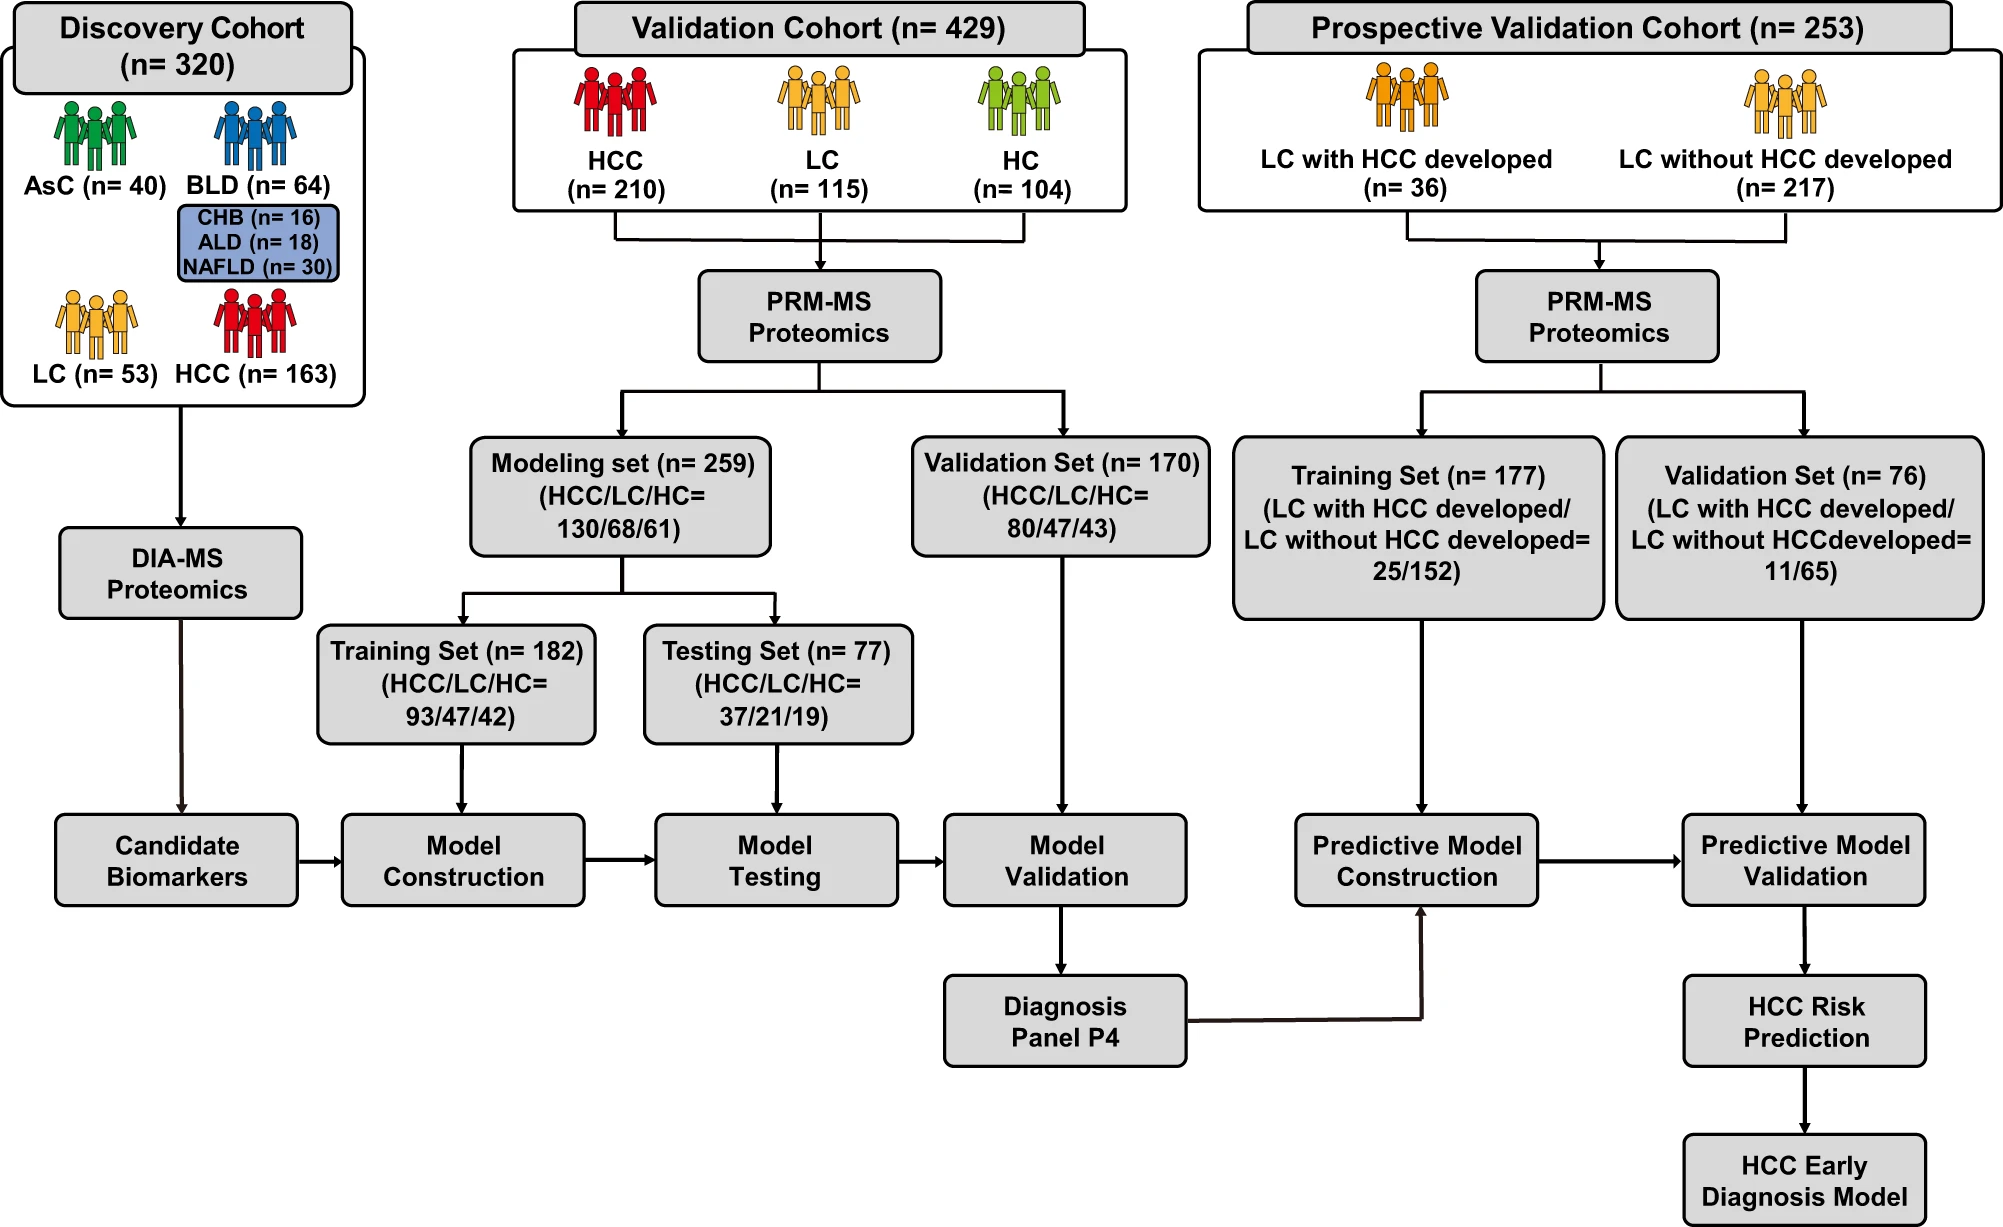
Three-stage DIA-MS workflow: discovery cohort (n=320) → verification by PRM → independent validation (n=429) → prospective prediction cohort (n=253).
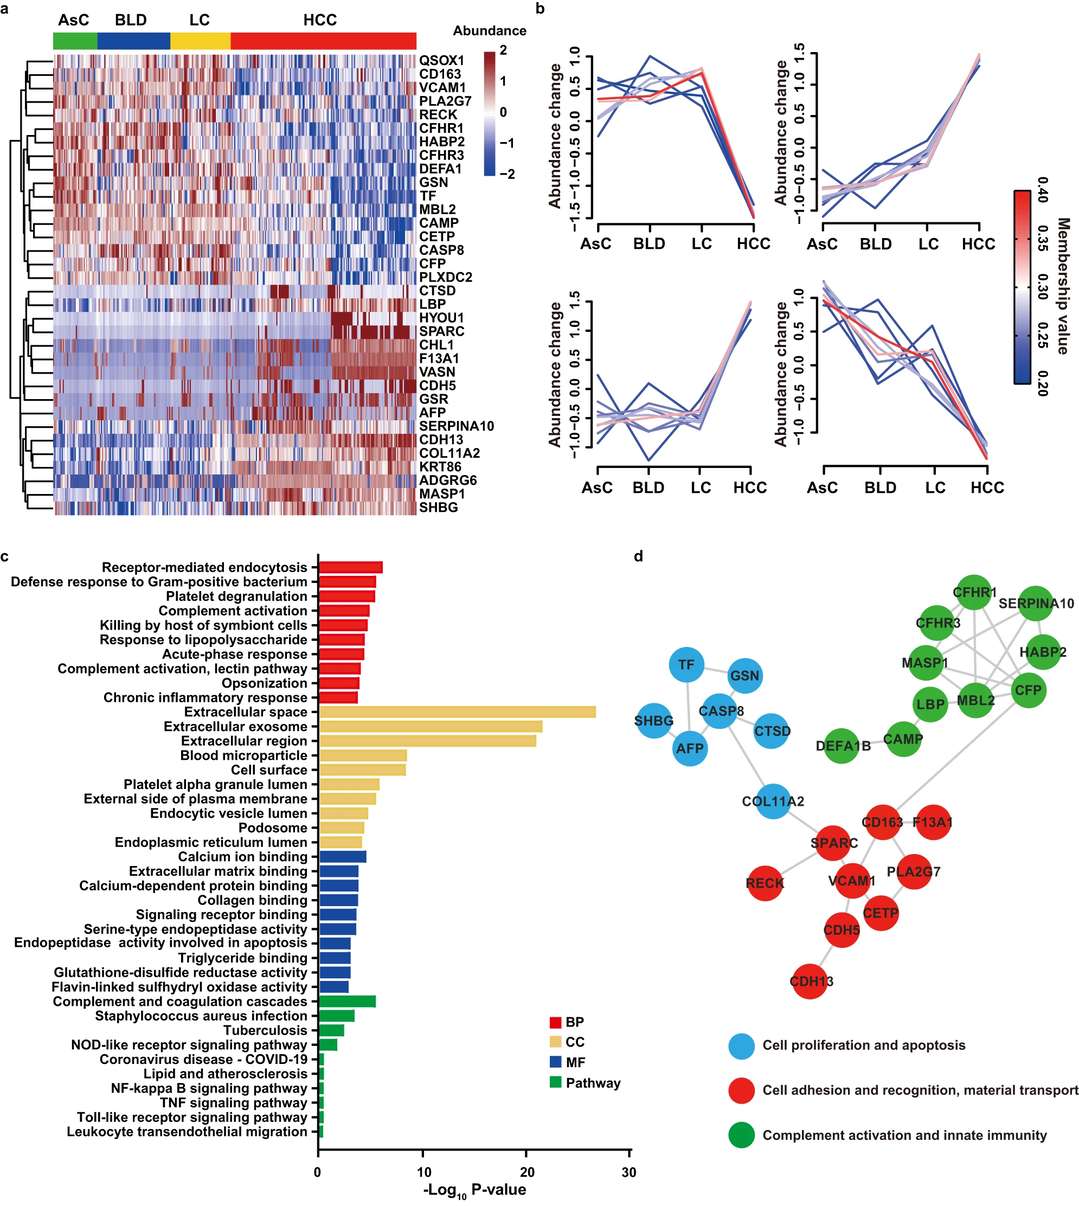
P4 panel performance: AUC 0.979 for HCC vs cirrhosis, outperforming AFP alone. Panel correctly predicted HCC conversion a median of 11.4 months before imaging diagnosis.
What This Means for Serum Proteomics Studies
- DIA serum proteomics identifies biomarkers that outperform existing clinical tests. The P4 panel achieved an AUC of 0.979 vs cirrhosis — far exceeding AFP alone. DIA-MS is not just a research tool; it generates clinically actionable biomarker panels.
- Proteins signal disease before imaging can see it. Cirrhosis patients who converted to HCC showed detectable serum proteomic changes a median of 11.4 months before tumors appeared on CT or MRI. This is the clinical value of plasma proteomics — catching disease when it's still treatable.
- Reproducibility across independent cohorts validates the approach. The P4 panel replicated in an external prospective cohort — demonstrating that DIA serum proteomics produces generalizable biomarkers when discovery, verification, and validation are properly staged.
Reference: Xing X, Cai L, Ouyang J, et al. Proteomics-driven noninvasive screening of circulating serum protein panels for the early diagnosis of hepatocellular carcinoma. Nature Communications. 2023;14:8392. doi:10.1038/s41467-023-44255-2