What Is 4D-DIA Proteomics?
To overcome the limitations of traditional mass spectrometry in complex biological matrices, 4D Proteomics Services integrate Trapped Ion Mobility Spectrometry (TIMS) with Data-Independent Acquisition (DIA), a methodology commonly known as diaPASEF.
Instead of measuring just mass and retention time, 4D-DIA rigorously separates and measures peptide signals along four orthogonal axes:
- m/z (Mass-to-charge ratio)
- Retention time (Chromatography)
- Intensity (Quantitative signal)
- Ion mobility (CCS - Collisional Cross Section): A gas-phase separation based on the three-dimensional size and shape of the molecule.
By synchronizing quadrupole isolation with ion mobility elution, 4D-DIA effectively focuses the ion beam. This empowers the instrument to distinguish between co-eluting, isobaric peptides, dramatically reducing spectral complexity and unlocking deeper proteome coverage without sacrificing throughput.
Content Guide
- What Is 4D-DIA Proteomics?
- Why 4D-DIA Is the Better Choice
- What Research Challenges Can 4D-DIA Help Solve?
- Advantages of Our Service
- Solutions Tailored to Your Goals
- How to Choose the Right Path
- Step-by-Step Workflow
- Platforms and Acquisition Strategies
- Sample Requirements
- What You’ll Receive: Expected Results
Why 4D-DIA Is the Better Choice for Complex Samples and Large Cohorts
The Decision Logic: 4D-DIA vs Standard DIA
While a standard DIA Quantitative Proteomics Service is excellent for basic models, it can struggle with spectral congestion in extreme dynamic range matrices. 4D-DIA introduces physical ion mobility separation prior to fragmentation, offering clean spectra combined with absolute data completeness.
Where Ion Mobility Adds Decision-Grade Value
If your project involves plasma, FFPE, or large-scale cohorts, standard DIA carries a higher risk of missing values that can compromise translational decisions. Ion mobility physically rescues the signal of low-abundance peptides from background noise, delivering decision-grade quantification to confidently narrow your biomarker shortlist.
When 4D-DIA Is Worth the Investment
For screening highly homogeneous samples, Label-Free DIA Quantitative Proteomics remains cost-effective. However, if your target is securing cross-batch comparability for a translational program where reproducibility is non-negotiable, 4D-DIA minimizes decision uncertainty and ensures high statistical power.
What Research Challenges Can 4D-DIA Help Solve?

Sample Feasibility Uncertainty
We turn difficult matrices into interpretable readouts, mitigating the risk of returning uninformative data from precious FFPE or clinical specimens.

Low-Abundance Protein Interference
4D selectivity lifts scarce peptides above the noise threshold, allowing you to prioritize biologically critical targets like kinases.

Pilot-to-Cohort Scalability
IM-aware alignment ensures that data from a feasibility pilot aligns seamlessly with a 500-sample cohort processed months later.

The Downstream Interpretation Gap
We provide a continuous path from global discovery to validation by transferring precise CCS coordinates directly into targeted verification panels.
Advantages of Our 4D-DIA Proteomics Service
Comprehensive Protein Profiling
7,000–9,000 Proteins / Run
Profile thousands of proteins per run, providing an unbiased view of biological pathways.
Quantitative Precision
Protein CV ≤ 10–15%
Deliver stable label-free quantitation across large-scale, multi-batch translational studies.
Data Completeness
< 2–5% Missingness
IM-aware alignment ensures cross-run comparability and maintains high statistical power.
Dynamic Range
~5–6 Orders of Magnitude
Detect proteins across wide abundance levels to capture subtle differences in biofluids.
Flexible Library Strategies
Library-Free or Hybrid
Start immediately with directDIA algorithms or build hybrid spectral libraries for maximum depth.
Actionable Insights
Target Deconvolution
Go beyond raw data with advanced biological context to prioritize your next targeted steps.
4D-DIA Solutions Tailored to Your Research Goals

Biomarker discovery and translational cohorts
Robust, multi-batch workflows with strict statistical power calculations. Explore our Biomarker Proteomics Solutions.

Tissue, FFPE, and biofluid projects
Specialized extraction for degraded FFPE cores or liquid biopsies. Learn more about Deep Blood 4D-DIA Proteomics.
Mechanism and pathway-focused studies
Uncover drug mechanisms of action (MOA) by accurately profiling whole-proteome shifts in complex models.

Discovery-to-targeted follow-up options
Utilize our Discovery Proteomics Service to identify targets, transitioning seamlessly to verification assays.
4D-DIA vs DIA vs Targeted Follow-Up: How to Choose the Right Path
| Study Goal / Rationale | Best Sample Scenarios | Recommended Technology | Typical Output |
|---|---|---|---|
| Broad profiling with consistency; baseline studies without severe co-elution. | Cell lines, fresh tissues, basic biofluids. | Standard DIA | Deep protein matrices. Ready for follow-up. |
| Maximum depth & complex matrices; resolving co-elution in plasma or FFPE. | Plasma/serum, FFPE, multi-center large cohorts. | Discovery 4D-DIA | Deepest matrices, batch control, CCS values. |
| Absolute quantification or verification; validating panels across clinical cohorts. | Clinical trial biofluids, bioprocess CQAs. | Targeted Follow-Up / 4D-PRM | Multiplexed panel quantitation. Absolute validation. |
Selection Strategy: Choose standard DIA when gain from ion mobility isn't essential. Choose 4D-DIA when matrix complexity or low-abundance interference is a risk. Choose Targeted Proteomics or 4D-PRM Target Proteomics Services for strict panel validation.
Step-by-Step 4D-DIA Workflow
We align on biological questions and expected effect sizes. If sample volume poses a risk, we design custom low-input carrier strategies before committing resources.
Samples undergo matrix-specific lysis (e.g., S-Trap/SP3). We evaluate yield and peptide integrity; poor recovery triggers immediate rescue protocols.
Data is acquired using optimized ion-mobility windows. Continuous system suitability testing using iRT peptides prevents drift from affecting analytical batches.
Library-free or hybrid extraction is applied via neural networks. Strict 1% False Discovery Rate (FDR) limits eliminate false positives from your biomarker shortlist.
IM-aware alignment normalizes data. If pooled QCs indicate unacceptable batch drift, we deploy alignment algorithms or trigger re-runs to ensure reportability.
Data matrices are transformed into actionable decisions, translating discovery lists into robust mechanism-of-action models.
- Start library-free and deepen later: Secure initial findings without deep fractionation costs, scaling seamlessly from pilot to cohort.
- Maintain cohort-grade consistency: Bridge-sample strategies and alignment algorithms prevent data drift across translational studies.
- Support low-input samples: Detergent-aware cleanup rescues degraded FFPE and limited biopsies where standard methods fail.
- Expert interpretation: We act as your collaborative informatics partner, translating complex matrices into next-step validation decisions.
Advanced Mass Spectrometry Platforms Powering Our Services
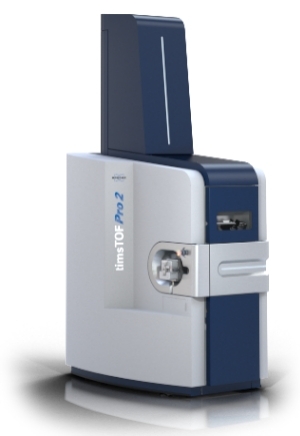
timsTOF Pro / Pro 2 (Bruker) - The Engine of 4D-DIA
Technology: Trapped Ion Mobility Spectrometry (TIMS) combined with PASEF. This is the exclusive architecture that drives true 4D-DIA (diaPASEF).
Acquisition Strategy: diaPASEF for deep discovery proteomics, with seamless transition capabilities to prm-PASEF for rapid targeted validation.
Strengths: 4D separation resolves co-eluting peptides, maximizes ion utilization (duty cycle approaching 100%), and delivers deeper coverage with exceptionally low missing values in complex matrices like plasma and FFPE.
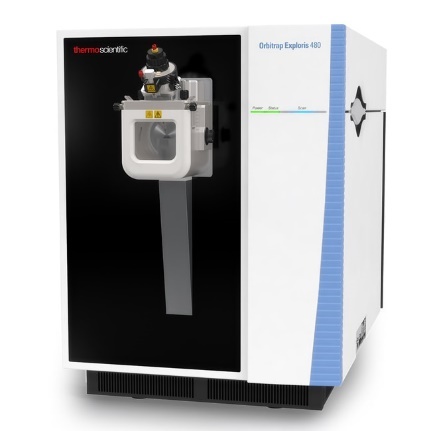
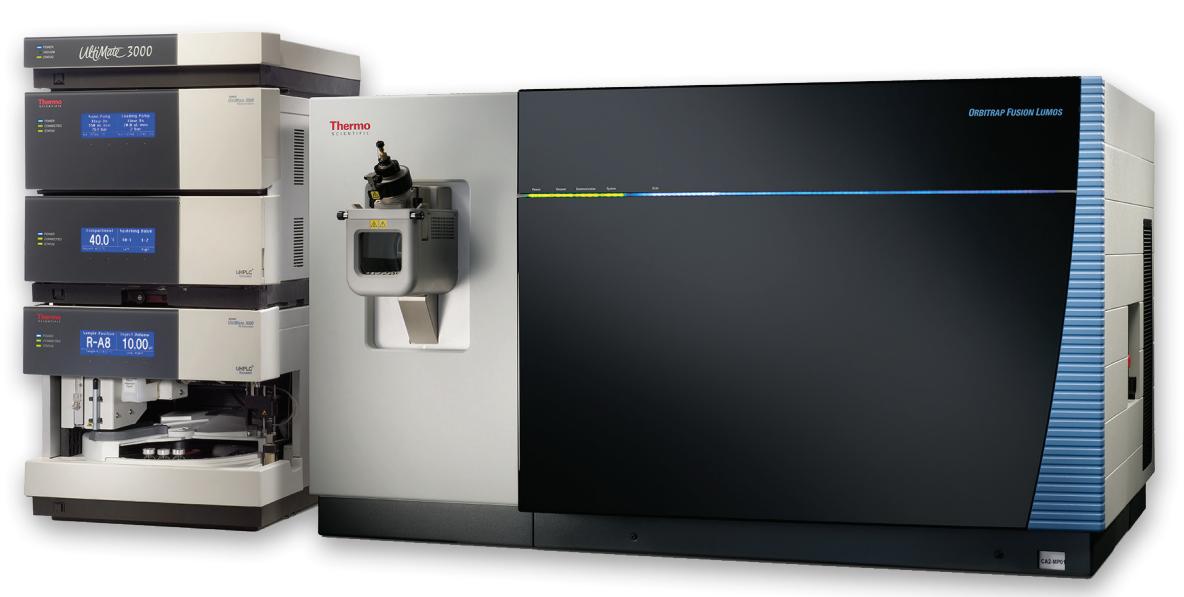
Orbitrap Exploris 480 / Fusion Lumos (Thermo) - The Standard DIA Complement
Technology: High-field Orbitrap mass analyzer with advanced quadrupole selection. These provide exceptional mass accuracy (< 2 ppm) and stability.
Acquisition Strategy: Employed for our Standard DIA, baseline cohort studies on well-characterized models, or targeted PRM verification panels where extreme dynamic range interference is less of a barrier.
Sample Requirements for 4D-DIA Proteomics
QC controls: We incorporate system-suitability standards (iRT, reference digests) and recommend pooled QC + biological replicates.
| Matrix / Type | Recommended Input (typical) | Preferred State | Storage & Shipping | Special Handling Notes |
|---|---|---|---|---|
| Plasma / Serum | 50–200 µL | Unhemolyzed | Dry ice (-80°C) | Avoid freeze-thaw cycles. Specify anticoagulant. |
| FFPE Sections | 5–10 curls (10 µm) | Mounted/unmounted | Ambient / ice packs | Provide H&E stain if microdissection required. |
| Tissue (fresh/frozen) | 20–50 mg wet weight | Flash-frozen | Dry ice (-80°C) | Minimize ischemia time during collection. |
| Cells / Organoids | 1–5 × 10⁶ cells | Washed cell pellet | Dry ice (-80°C) | Remove culture media and harsh detergents. |
Not sure whether your samples meet the requirements?
Contact us — we're happy to help design the best strategy for your 4D proteomics study.
What You’ll Receive: Expected Results & Deliverables
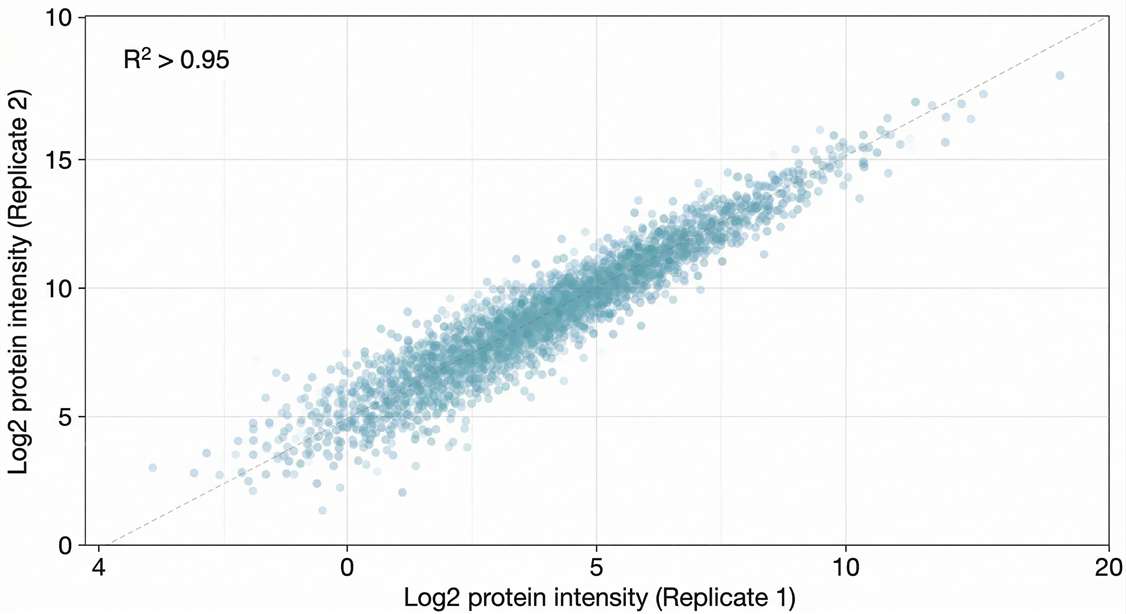
Quantitative Reproducibility: Tight clustering (R² > 0.95) proves high consistency across biological replicates.
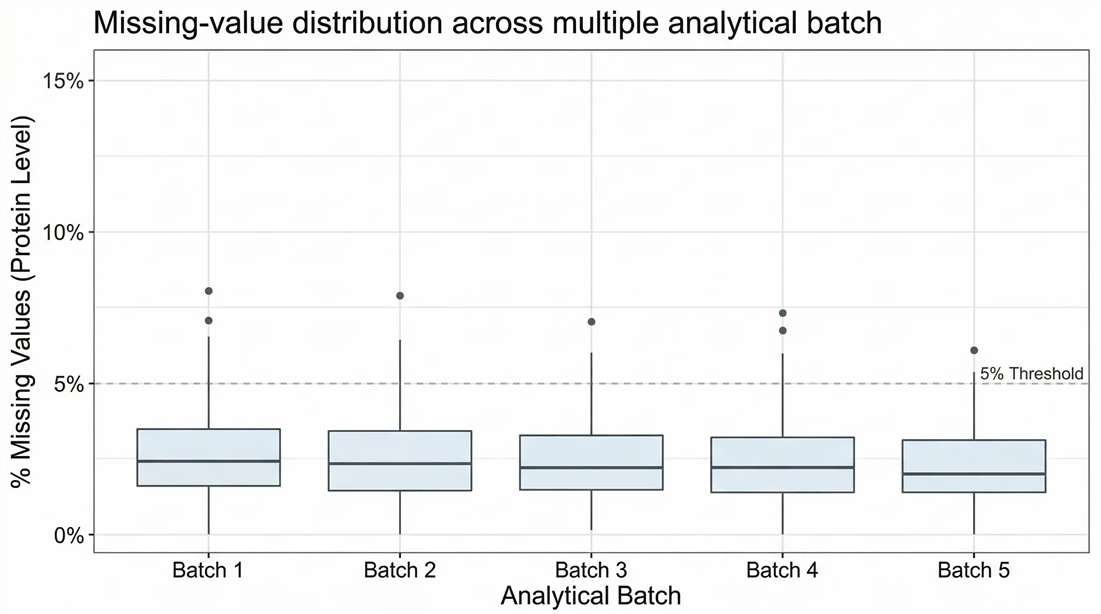
Batch-Level Completeness: Missing values <5% across a multi-batch cohort confirms statistical power.
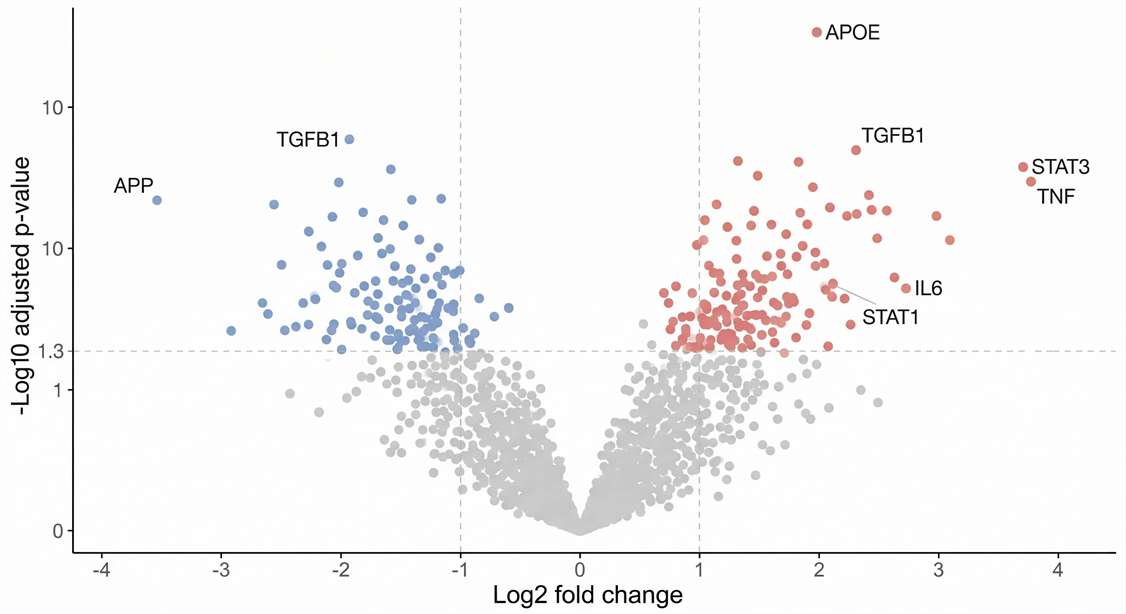
Differential Expression: Highlights statistically significant proteins to instantly identify prime biomarker candidates.
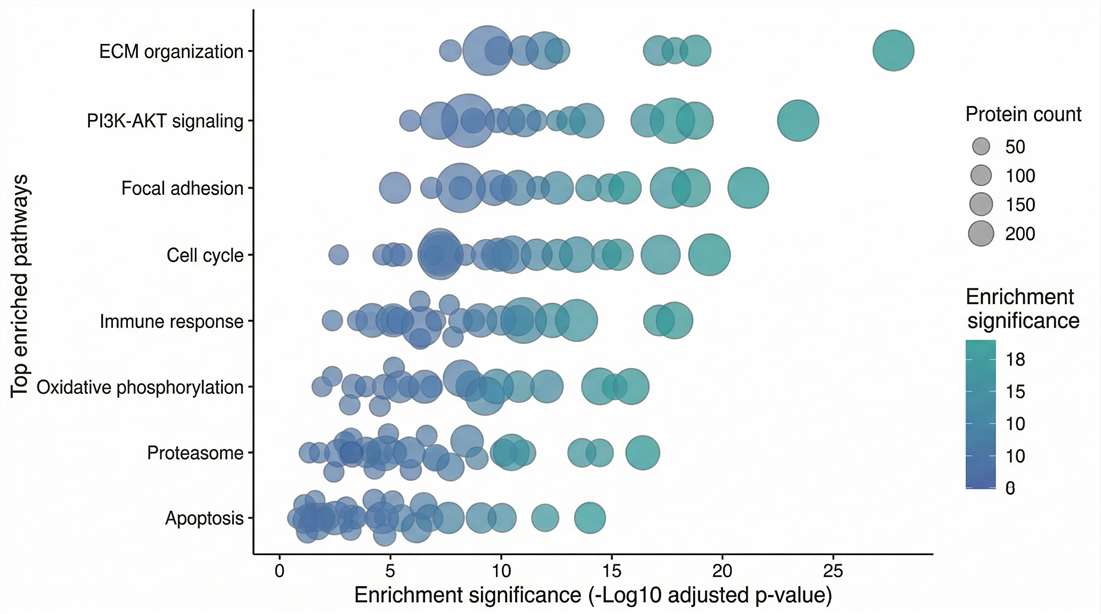
Pathway Enrichment: Visualizes upregulated KEGG pathways, mapping protein changes to disease mechanisms.
Through our integrated Proteomics Bioinformatics Analysis Service, your package transforms raw signals into verification-ready targets:
Raw Data
- Native instrument files (.d or .raw) and complete acquisition logs.
Processed Quantitative Tables
- Protein/peptide matrices designed to accelerate your biomarker shortlist narrowing.
Quality Control Pack
- Transparent drift and CV reports across cohorts, essential for partner review and IND filings.
Advanced Bioinformatics
- Differential analysis, pathway clustering, and prioritization for immediate targeted testing plans.
Method & Documentation
- Comprehensive SOPs ensuring full project traceability and cross-cohort reproducibility.
Success Stories with 4D-DIA Proteomics
Hybrid DDA/DIA-PASEF Enables Deep Proteotyping of Triple-Negative Breast Cancer
Journal: Scientific Data · Published: 2024
Study Scope
Researchers developed a hybrid DDA/DIA-PASEF assay library for deep proteotyping of triple-negative breast cancer (TNBC), a biologically aggressive breast cancer subtype that requires broader and more consistent proteome coverage for molecular characterization. The study combined large-scale library generation with downstream DIA-PASEF application to individual TNBC tissue samples.
- Proteins were extracted from 105 TNBC tissues and used to build a deep hybrid assay library.
- Pooled samples were fractionated and analyzed in DDA-PASEF mode to expand library depth.
- 16 individual TNBC lysates were analyzed in DIA-PASEF mode to demonstrate real-sample applicability.
- The resulting library supported deeper identification and improved quantification relative to library-free processing alone.
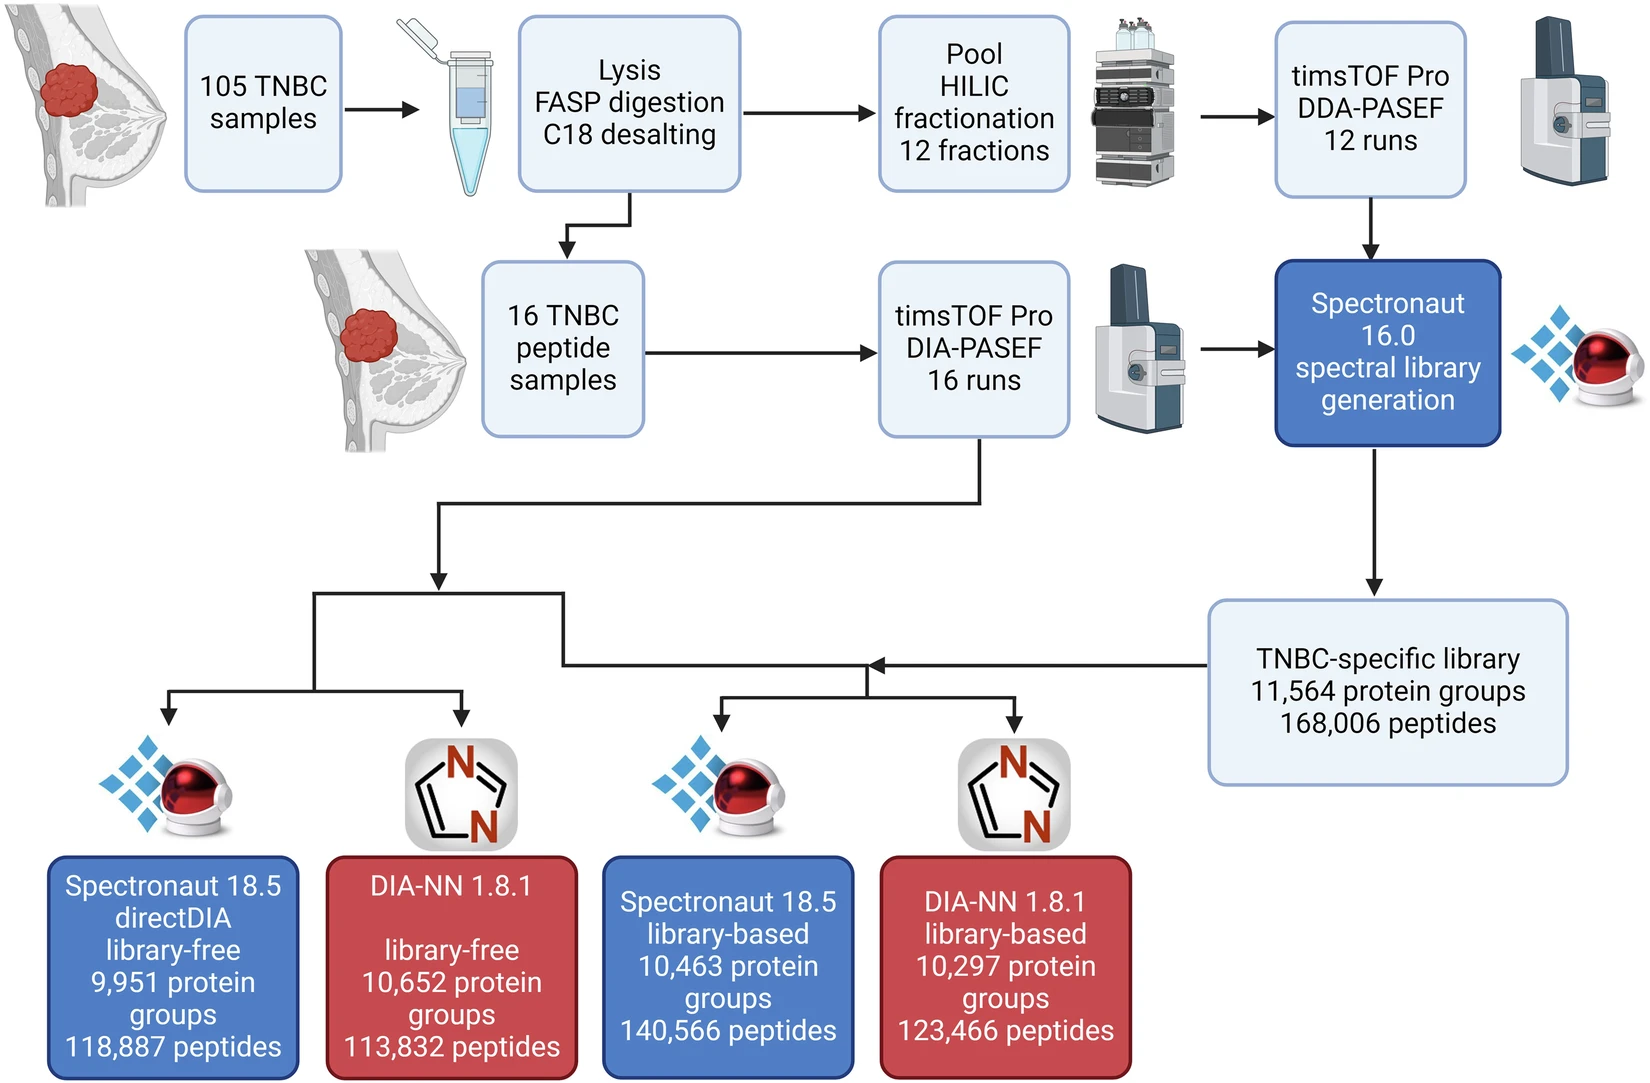 Workflow of the study.
Proteomic Coverage and Data Quality
- The hybrid TNBC assay library covered 244,464 precursors, 168,006 peptides, and 11,564 protein groups at 1% FDR.
- When applied to the 16 TNBC tissue lysates, the library-enabled workflow increased identifications compared with library-free DIA processing.
- The best-performing configuration reported 190,310 precursors, 140,566 peptides, and 10,463 protein groups in Spectronaut.
- The application data also showed sample clustering, intensity consistency, missing-value behavior, completeness, and coefficient-of-variation distributions suitable for assessing cohort-style quantitative performance.
These results show why hybrid DDA/DIA-PASEF can be valuable for high-complexity tissue projects: deeper proteome coverage is achieved without sacrificing the structured quantitative outputs needed for downstream biological interpretation.
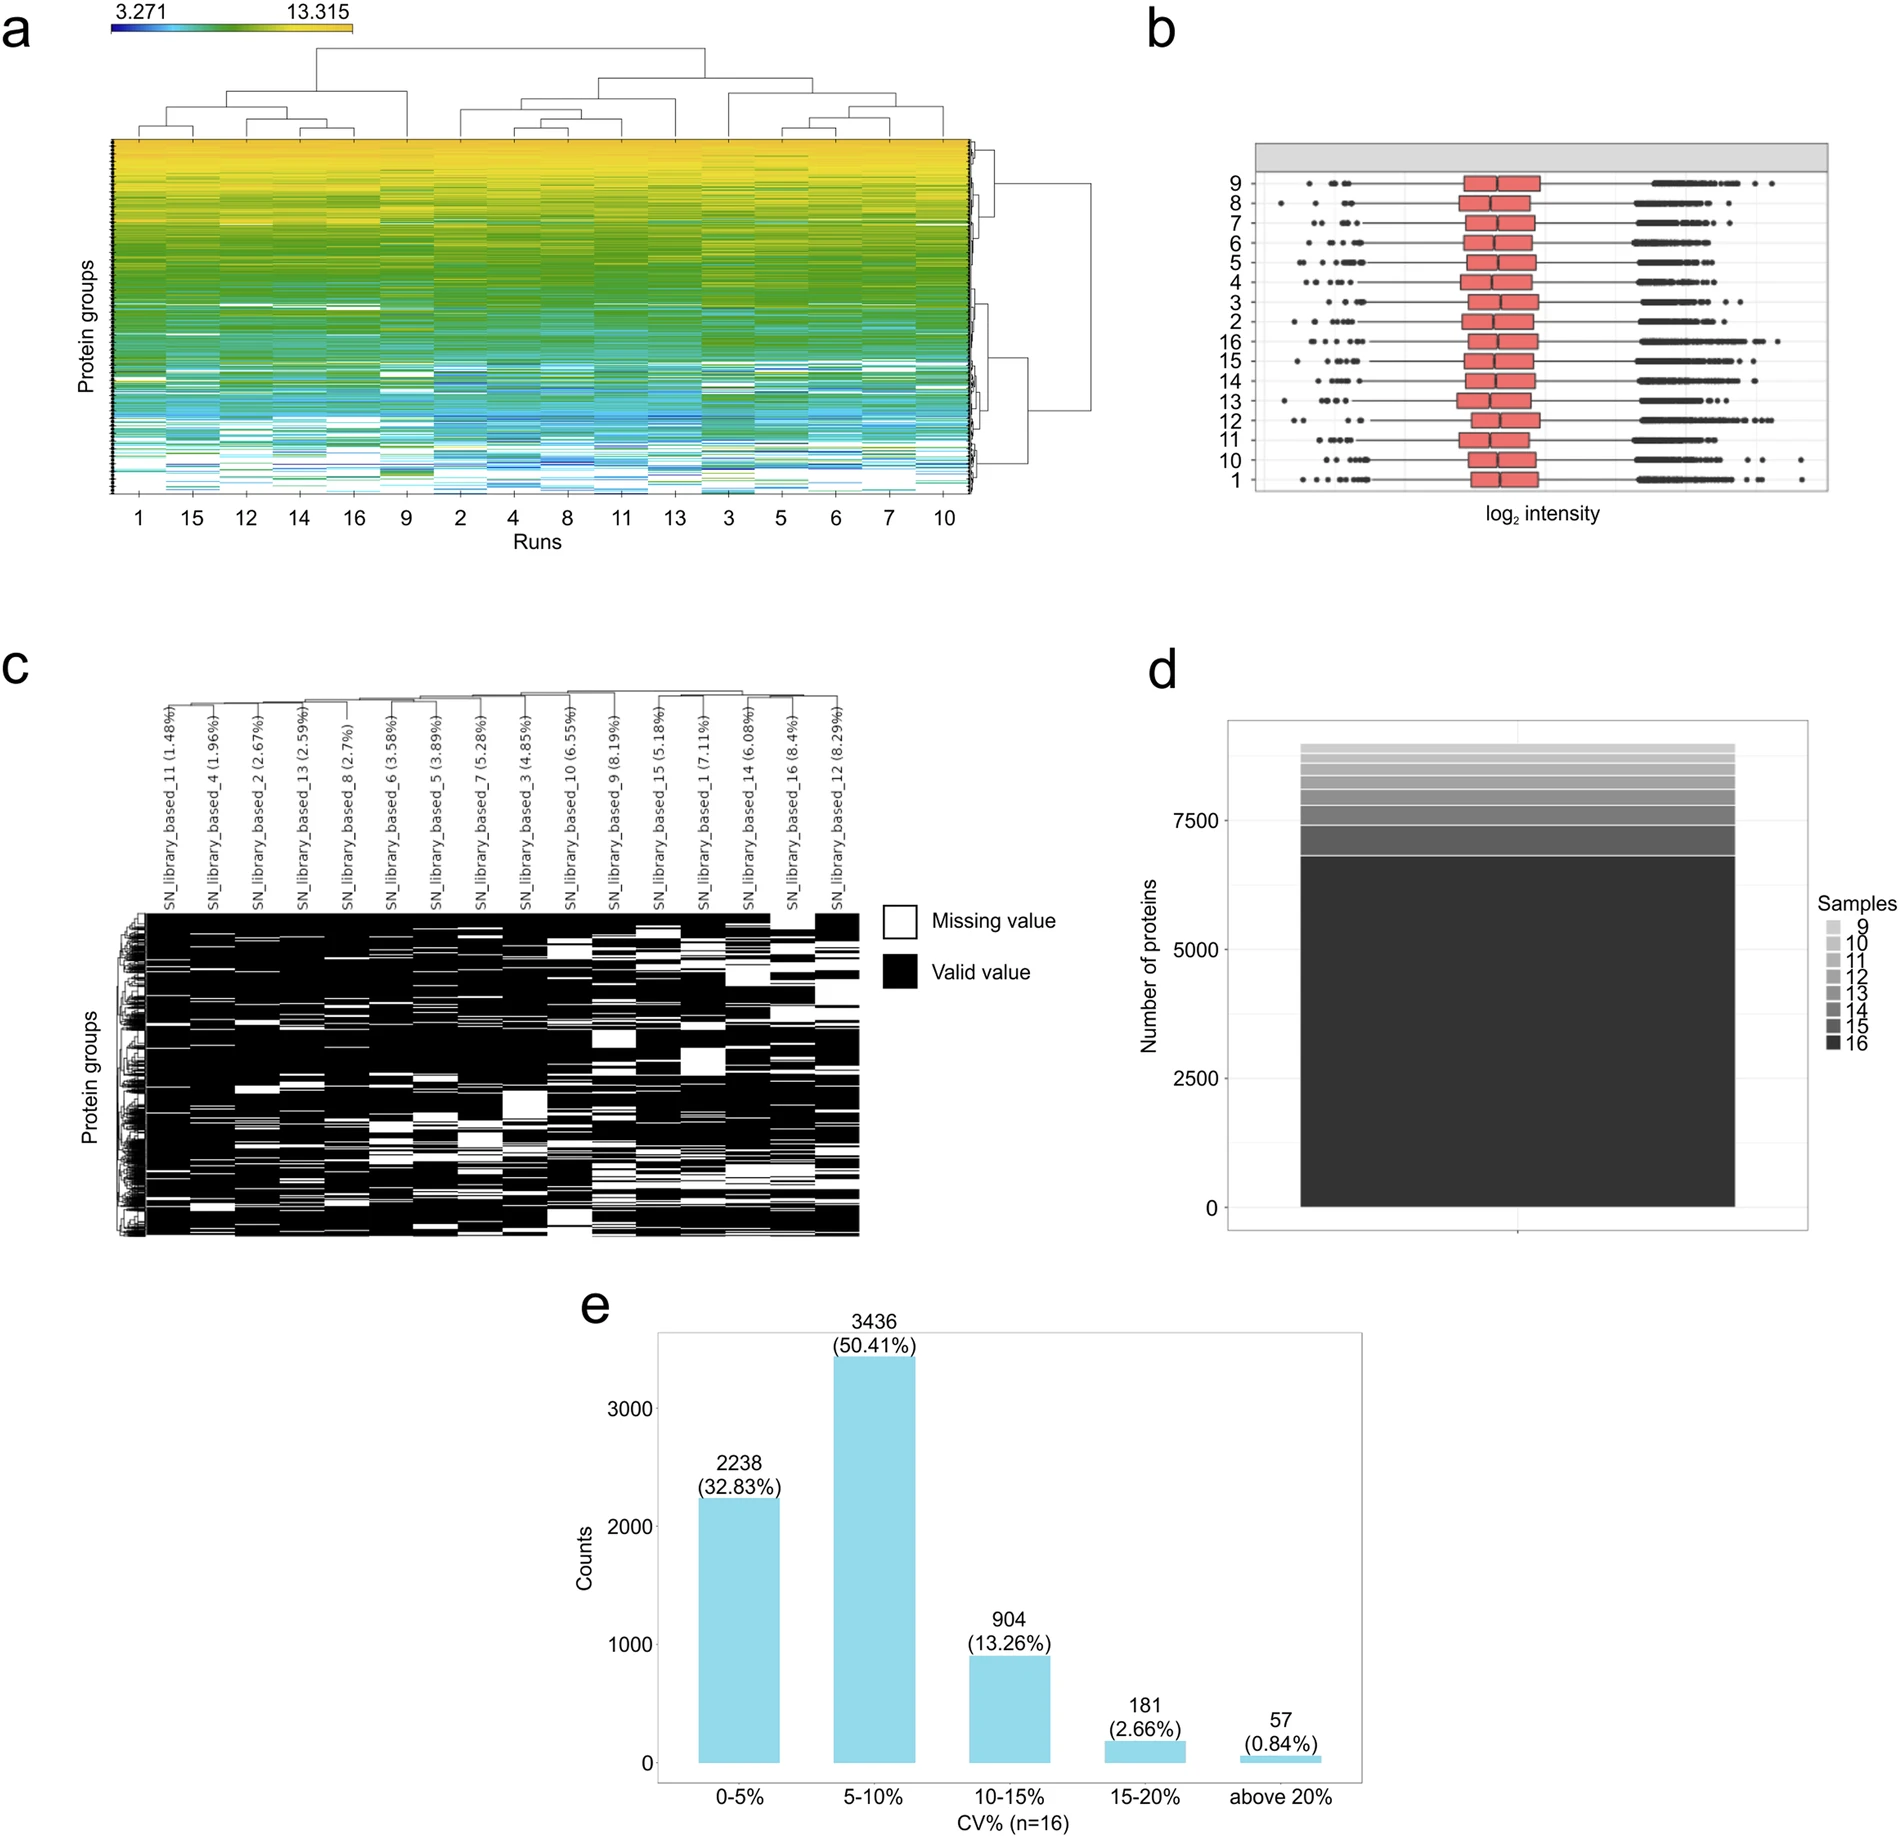 DIA-PASEF application to TNBC samples demonstrates quantitative coverage and data-quality characteristics.
Biological Insights
The study supports several practical takeaways for deep tissue proteomics:
- A hybrid assay library can substantially improve identification depth in a difficult disease matrix.
- DIA-PASEF enables quantitative application to individual TNBC tissue samples after deep library construction.
- The resulting dataset structure supports subgroup comparison, coverage evaluation, and downstream biological interpretation in cancer-focused proteomics studies.
Technical Highlights
- Large-scale assay-library generation from pooled TNBC tissues.
- DDA-PASEF for library expansion plus DIA-PASEF for individual-sample quantification.
- Direct comparison between library-based and library-free processing approaches.
- Result outputs include quantitative depth, missing-value behavior, completeness, and CV-based precision review.
Why It Matters
This study is a strong fit for a 4D-DIA service page because it connects method design with real tissue application. It shows how deep library construction and DIA-PASEF quantification can work together to improve proteome coverage in a clinically relevant, high-complexity cancer matrix while preserving the result types decision-makers care about most: completeness, consistency, and interpretability.
Reference
Lapcik, Petr, et al. "A hybrid DDA/DIA-PASEF based assay library for a deep proteotyping of triple-negative breast cancer." Scientific Data 11, 794 (2024).