
The Genomics-to-Protein Gap in Mutation Analysis
Next-generation sequencing (NGS) has cataloged millions of somatic mutations across human cancers and rare diseases. However, predicting biological causality from genomic coordinates remains a major bottleneck in translational medicine and oncology drug development.
Over 40% of non-synonymous single-nucleotide variants (missense SNVs) destabilize protein tertiary structure, triggering rapid chaperone-mediated ubiquitination and proteasomal degradation. In these cases, high mRNA levels correlate with complete protein-level loss of function. Conversely, oncogenic gain-of-function variants (e.g., KRAS G12D, PIK3CA H1047R) and drug-resistant secondary mutations (e.g., EGFR T790M/C797S) often alter catalytic velocity, rewrite kinase cascades, or remodel protein-protein interactions without changing baseline mRNA abundance.
Because mutant-specific commercial antibodies exist for fewer than 1% of known clinical variants, high-resolution LC-MS/MS mass spectrometry is the only unbiased technology capable of directly detecting mutated peptide sequences, quantifying variant protein stability, and mapping downstream functional rewiring.
Content Guide
- Four Analytical Pillars
- Variant Classes & Models
- Proteogenomics Workflow
- Study Design Architectures
- Platform Decision Guide
- Sample Requirements
- Deliverables & Data Outputs
Four Methodological Pillars for Functional Mutation Proteomics
Depending on whether your objective is verifying mutant peptide expression, measuring biophysical stability, mapping interactome remodeling, or profiling downstream signaling networks, we deploy four specialized proteomic modalities:

1. Proteogenomic SAAV Detection
Customized FASTA databases generated from matched WES/RNA-seq identify exact Single Amino Acid Variant (SAAV) peptides, novel splice junctions, and gene fusion breakpoint peptides with rigorous 1% spectral FDR.

2. Thermal Proteome Profiling (TPP-MS)
Cellular Thermal Shift Assay (CETSA) coupled with multiplexed TMT/DIA mass spectrometry determines variant-induced thermal melting shifts (ΔTm), distinguishing misfolded, destabilized mutants from stabilized active conformations.

3. Interactome Remodeling (AP-MS)
Affinity purification (FLAG/HA/BioID) comparing WT versus mutant proteins identifies loss of physiological tumor suppressor complexes (e.g., p53-MDM2, PTEN) or gain of aberrant oncogenic binding partners.

4. Global Signaling & PTM Rewiring
Deep DIA proteomics paired with 4D-phosphoproteomics quantifies whole-proteome pathway alterations, constitutive kinase phosphorylation (MAPK, PI3K/Akt, STAT), and compensatory survival pathways triggered by the variant.
Variant Classes, Biological Questions, and Analytical Strategies
| Variant Category | Representative Biological Models | Primary Analytical Question | Recommended Strategy |
|---|---|---|---|
| Clinical Variants of Uncertain Significance (VUS) | Germline or somatic missense variants in BRCA1/2, TP53, PTEN, mismatch repair genes. | Does the missense change cause protein destabilization, loss of expression, or aberrant turnover? | Deep DIA quantification + TPP stability assay (ΔTm measurement). |
| Oncogenic Hotspot Gain-of-Function | KRAS (G12C/D/V, G13D, Q61H), BRAF (V600E), PIK3CA (E545K, H1047R), IDH1 (R132H). | Which downstream kinase cascades and metabolic pathways are constitutively activated? | Paired 4D-Phosphoproteomics + Global DIA pathway enrichment (KSEA). |
| Secondary Kinase Gatekeeper Resistance | EGFR (T790M, C797S), BTK (C481S), ALK (G1202R), BCR-ABL (T315I). | How does the secondary mutation prevent inhibitor binding or recruit alternative signaling hubs? | CETSA-MS drug-binding competition + AP-MS interactome mapping. |
| Chromosomal Translocations & Fusion Proteins | EML4-ALK, BCR-ABL1, TMPRSS2-ERG, FGFR3-TACC3, SS18-SSX. | Is the chimeric junction peptide expressed, and what novel multiprotein complexes does it recruit? | Custom fusion breakpoint FASTA searching + Co-IP MS interactome analysis. |
| Truncating & Frameshift Indels | Premature termination codons (PTCs), alternative translation reinitiation, exon skipping. | Does residual truncated protein escape nonsense-mediated decay (NMD) and persist? | Sequence-mapped peptide-level coverage analysis (N-terminal vs. C-terminal recovery). |
Customized Proteogenomics Database Construction & Verification Rules
Detecting mutant peptides from shotgun mass spectrometry data requires rigorous bioinformatic controls to prevent inflated false-discovery rates caused by database inflation:

- Sample-Matched Database Customization: We extract non-synonymous SNVs, insertions/deletions, and RNA-seq junction reads from your matched genomic data, appending variant sequences directly to the canonical UniProt reference proteome.
- Two-Pass Search & 1% Spectral FDR: To control the search space, MS/MS spectra are searched using target-decoy approaches with strict 1% false discovery rate applied independently at both peptide-spectrum match (PSM) and variant-peptide levels.
- Distinguishing Homologous Isoforms: Bioinformatic filters distinguish true somatic mutant peptides from common single-nucleotide polymorphisms (dbSNP) and homologous pseudogene products.
- Synthetic Heavy Peptide (AQUA) Validation: For high-priority biomarker candidates or clinical decisions, we synthesize stable isotope-labeled heavy reference peptides to co-elute and match MS/MS fragmentation patterns exactly, providing 100% conclusive analytical verification.
Study Design Architectures for Mutation Projects
| Experimental Design | Core Biological Comparison | What This Design Establishes |
|---|---|---|
| Isogenic WT vs. Mutant Knock-In | Parental isogenic cell line compared to CRISPR-engineered single-amino-acid mutant clone(s). | Isolates the phenotypic effect of the single variant from genetic background variations. |
| Multi-Clone Concordance Design | Wild-type parental vs. 3+ independently derived mutant clones targeting the same codon. | Separates genuine mutation-driven proteomic shifts from clonal drift and culture artifacts. |
| Inhibitor Sensitivity ± Drug Challenge | WT vs. Gatekeeper Mutant cells treated with escalating doses of targeted kinase inhibitors. | Measures resistance index, persistent downstream phosphorylation, and bypass pathway activation. |
| Thermal Melting Curve Series (TPP) | Intact cells or lysates heated across a 10-temperature gradient (37°C to 67°C) ± ligand. | Calculates exact melting temperature (ΔTm) shifts induced by mutation or drug binding. |
Functional Variant Proteomics Analytical Platform Decision Guide
Match your variant class, sample type, and biological question with the optimal acquisition strategy and mass spectrometry platform.
| Study Objective & Scenario | Recommended Strategy | Primary MS Platform | Technical Rationale & Deliverables |
|---|---|---|---|
| Proteome-Wide Impact & Pathway Rewiring (Isogenic Knock-in / Cancer Cell Lines) |
Discovery DIA Quantitative Proteomics | Orbitrap Astral / Exploris 480 / timsTOF Pro 2 | Single-shot depth (>6,500–8,500+ proteins), CV < 15%, deep coverage of metabolic pathways, transcription factors, and compensatory proteins. |
| Conformational Stability & Misfolding (VUS Characterization / Ligand Binding) |
Thermal Proteome Profiling (TPP-MS / CETSA) | Orbitrap Exploris 480 (TMT-Multiplexed / DIA-TPP) | 10-point thermal melting curves for thousands of proteins; precise melting point (ΔTm) shifts quantify variant biophysical stability. |
| Interactome Remodeling & Complex Assembly (AP-MS / Flag / HA / TurboID Proximity) |
High-Resolution Affinity Purification MS | Orbitrap Exploris 480 / timsTOF Pro 2 | Label-free quantification (LFQ) with SAINTexpress statistical filtering to distinguish true mutant-specific interactors from background contaminants. |
| Constitutive Kinase & Signaling Cascades (Oncogenic Hotspots / Gatekeeper Mutants) |
4D Phosphoproteomics (Ti-IMAC / Fe-NTA Enrichment) |
timsTOF Pro 2 (TIMS-DIA) / Orbitrap Exploris 480 | Captures >15,000–25,000+ phosphosites; Kinase-Substrate Enrichment Analysis (KSEA) maps constitutive downstream pathway hyperactivation. |
| Low-Abundance SAAV Peptide Verification (Biomarker Validation / Clinical Cohorts) |
Targeted PRM / 4D-PRM with Heavy Standards | Orbitrap PRM / Triple Quadrupole (TSQ Altis / QTRAP 6500+) | Absolute quantification of mutant versus wild-type peptide ratios using synthetic AQUA heavy peptides with zero false-discovery risk. |
Sample Submission Requirements
| Sample Category | Recommended Input | Minimum Feasibility | Harvesting & Shipping Guidelines |
|---|---|---|---|
| Standard Cell Pellets (Global DIA) | 1–5 × 10⁶ cells (20–50 μg protein) |
2 × 10⁵ cells (≥2 μg protein) |
Wash 2× with ice-cold PBS; aspirate completely; flash-freeze pellet in liquid N2. Ship on dry ice (-80°C). |
| Fresh-Frozen Tissues / Tumors | 20–50 mg wet weight | 5 mg wet weight | Dissect rapidly; snap-freeze immediately in liquid N2; avoid repeated freeze-thaw cycles. Ship on dry ice. |
| TPP / CETSA Thermal Assays | 1–2 × 10⁷ live intact cells or clarified lysate | 5 × 10⁶ cells | Harvest live cells with non-enzymatic dissociation; perform thermal gradient heating per SOP before lysis. Ship on dry ice. |
| Affinity Purification (AP-MS) | 1–2 × 10⁷ cells expressing tagged bait | 5 × 10⁶ cells | Lyse in non-denaturing buffer (e.g., 0.5% NP-40/Tris-HCl) to preserve native protein complexes. Ship on dry ice. |
| Pre-Extracted Lysates | 20–50 μL at 1–2 mg/mL | 5 μg total protein | SDS/RapiGest buffer; BCA quantified; provide matched genomic VCF or sequence files. Ship on dry ice. |
Deliverables and Decision-Ready Outputs
Quantitative matrices, spectral proof, and functional pathway interpretation
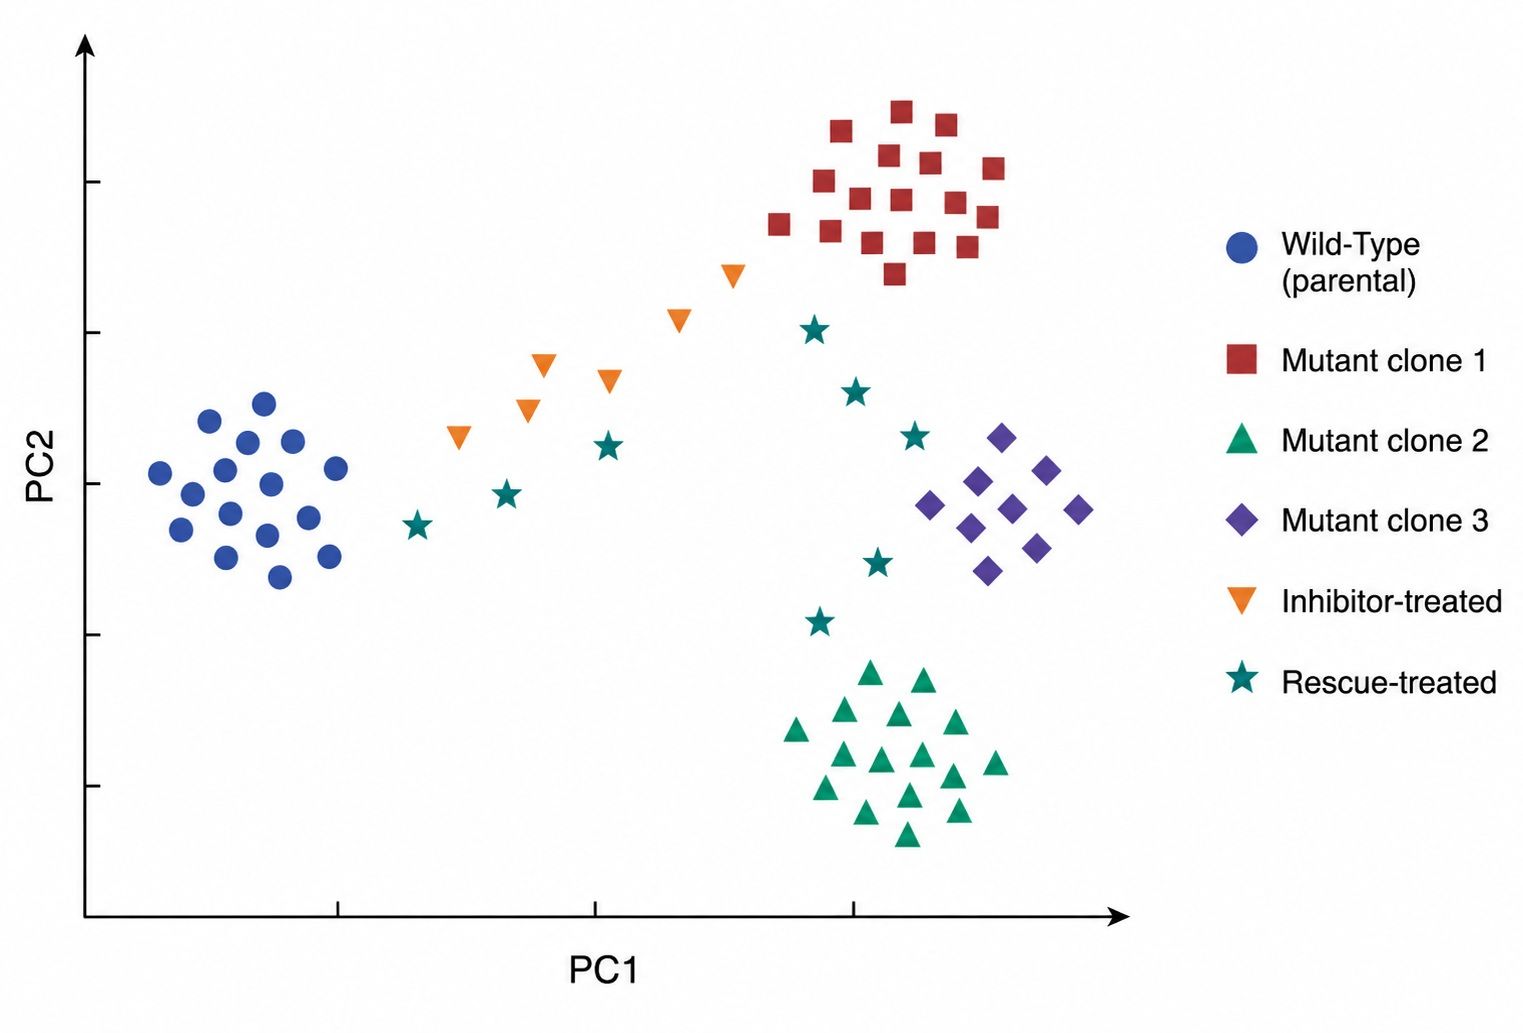
Sample-level PCA/UMAP evaluates whether global proteome profiles cluster strictly by genotype (WT vs. Mutant) across biological replicates.
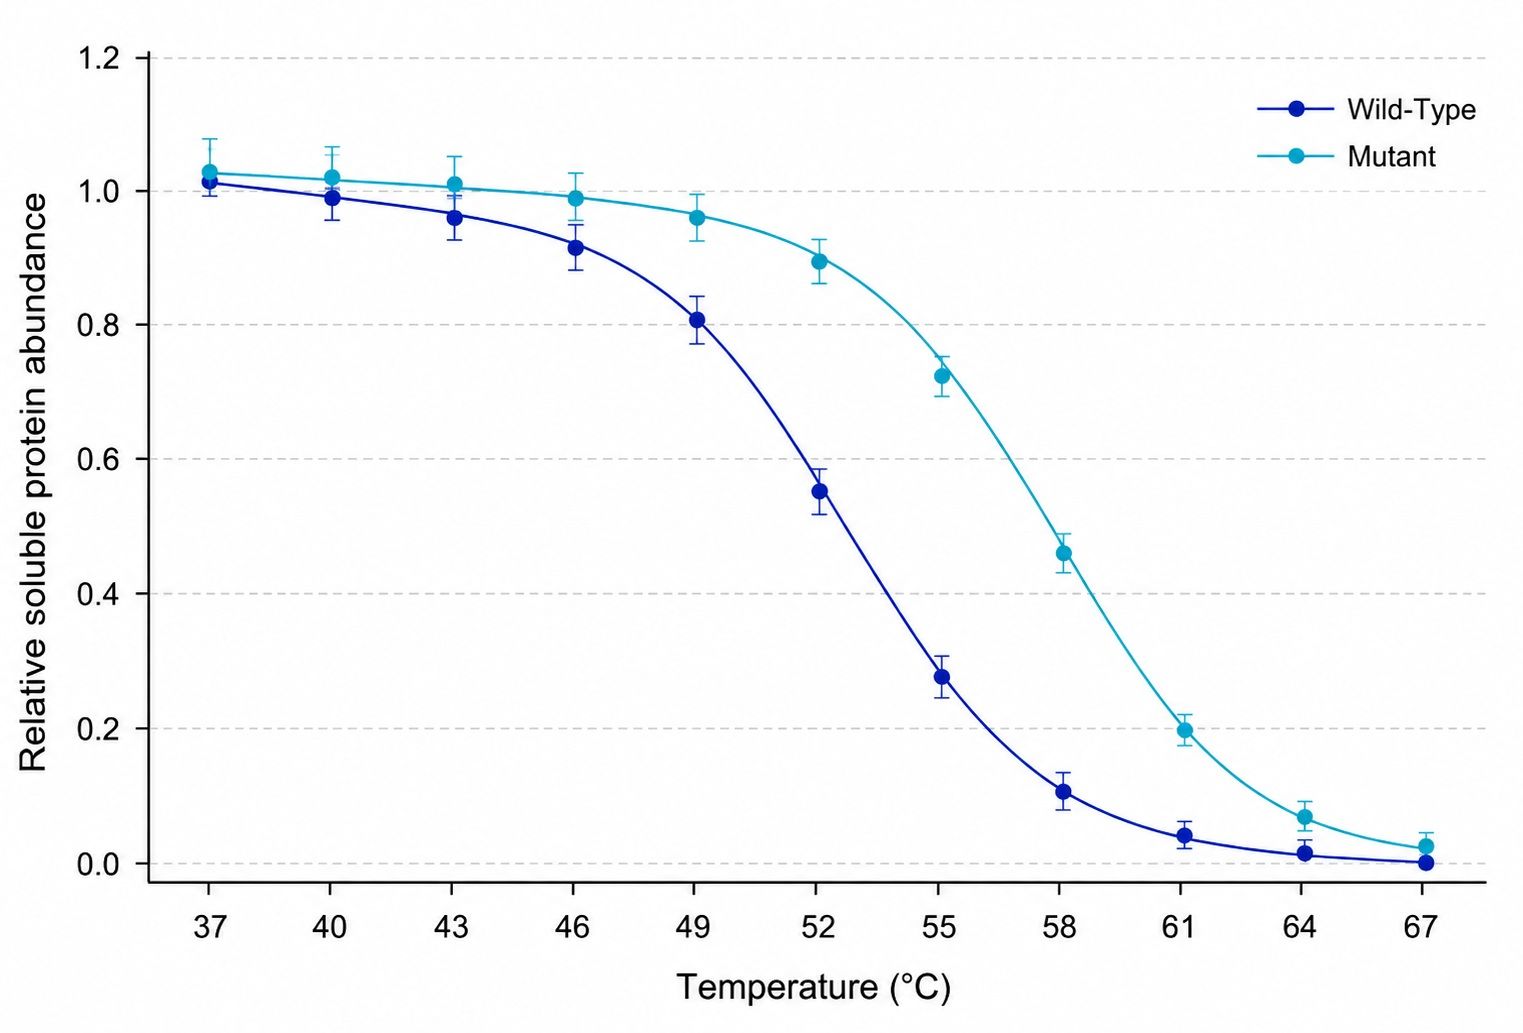
Thermal melting curves from TPP-MS quantify exact melting temperature shifts (ΔTm), establishing biophysical stability or misfolding.
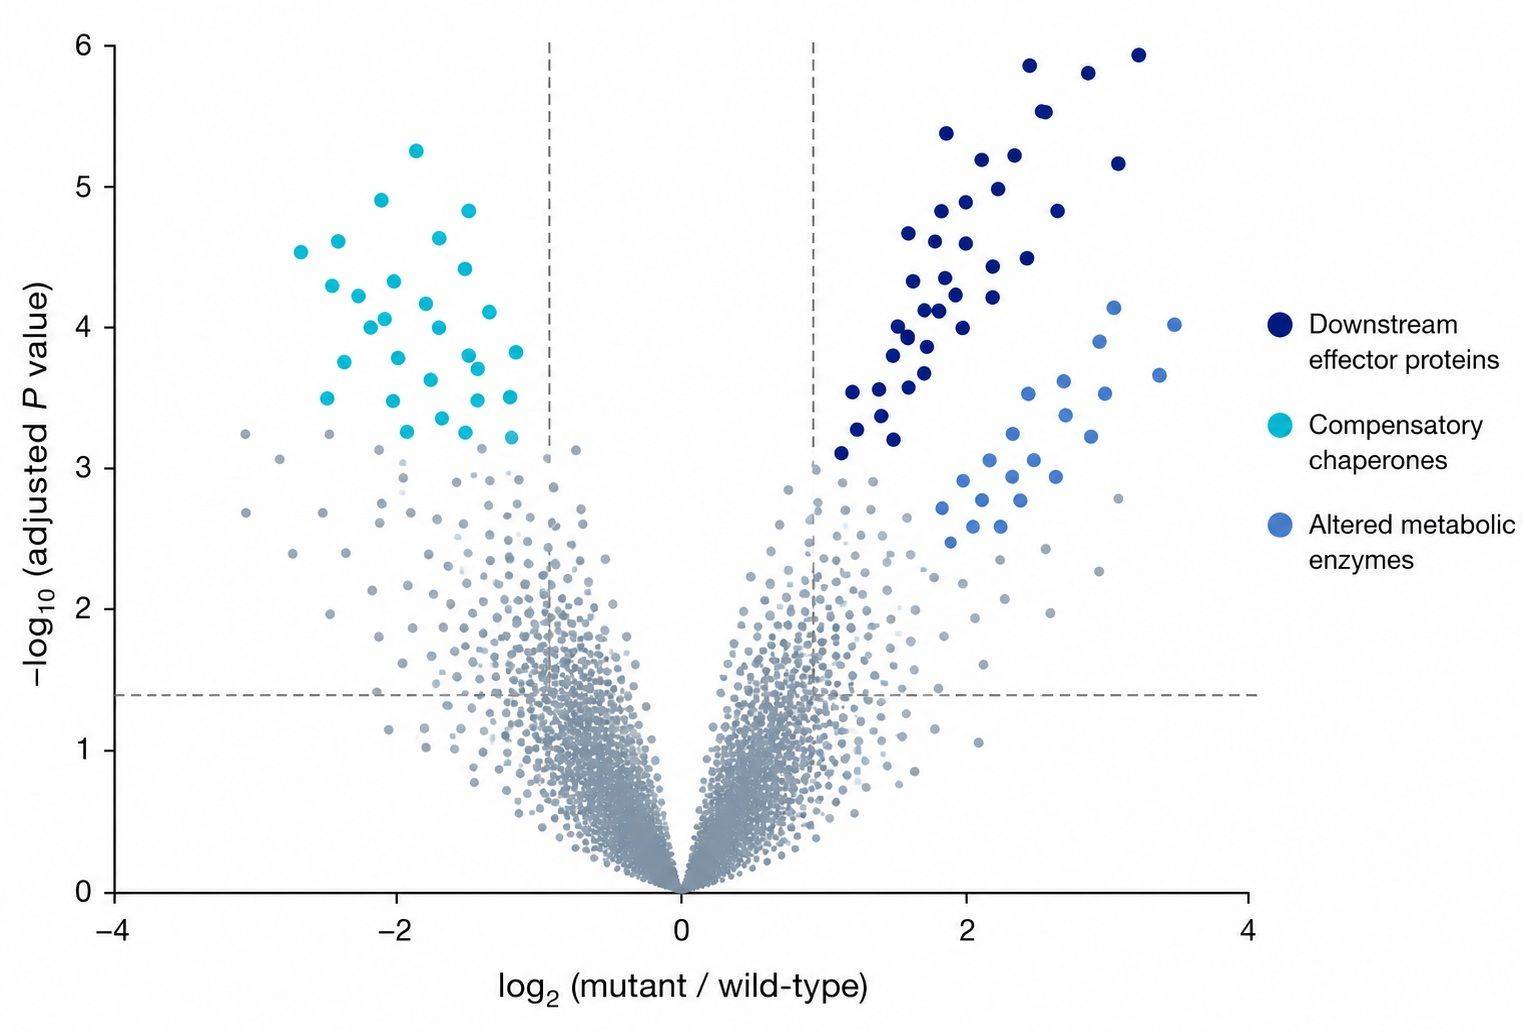
Differential volcano plots prioritize significant downstream effector proteins, compensatory chaperones, and altered metabolic enzymes.
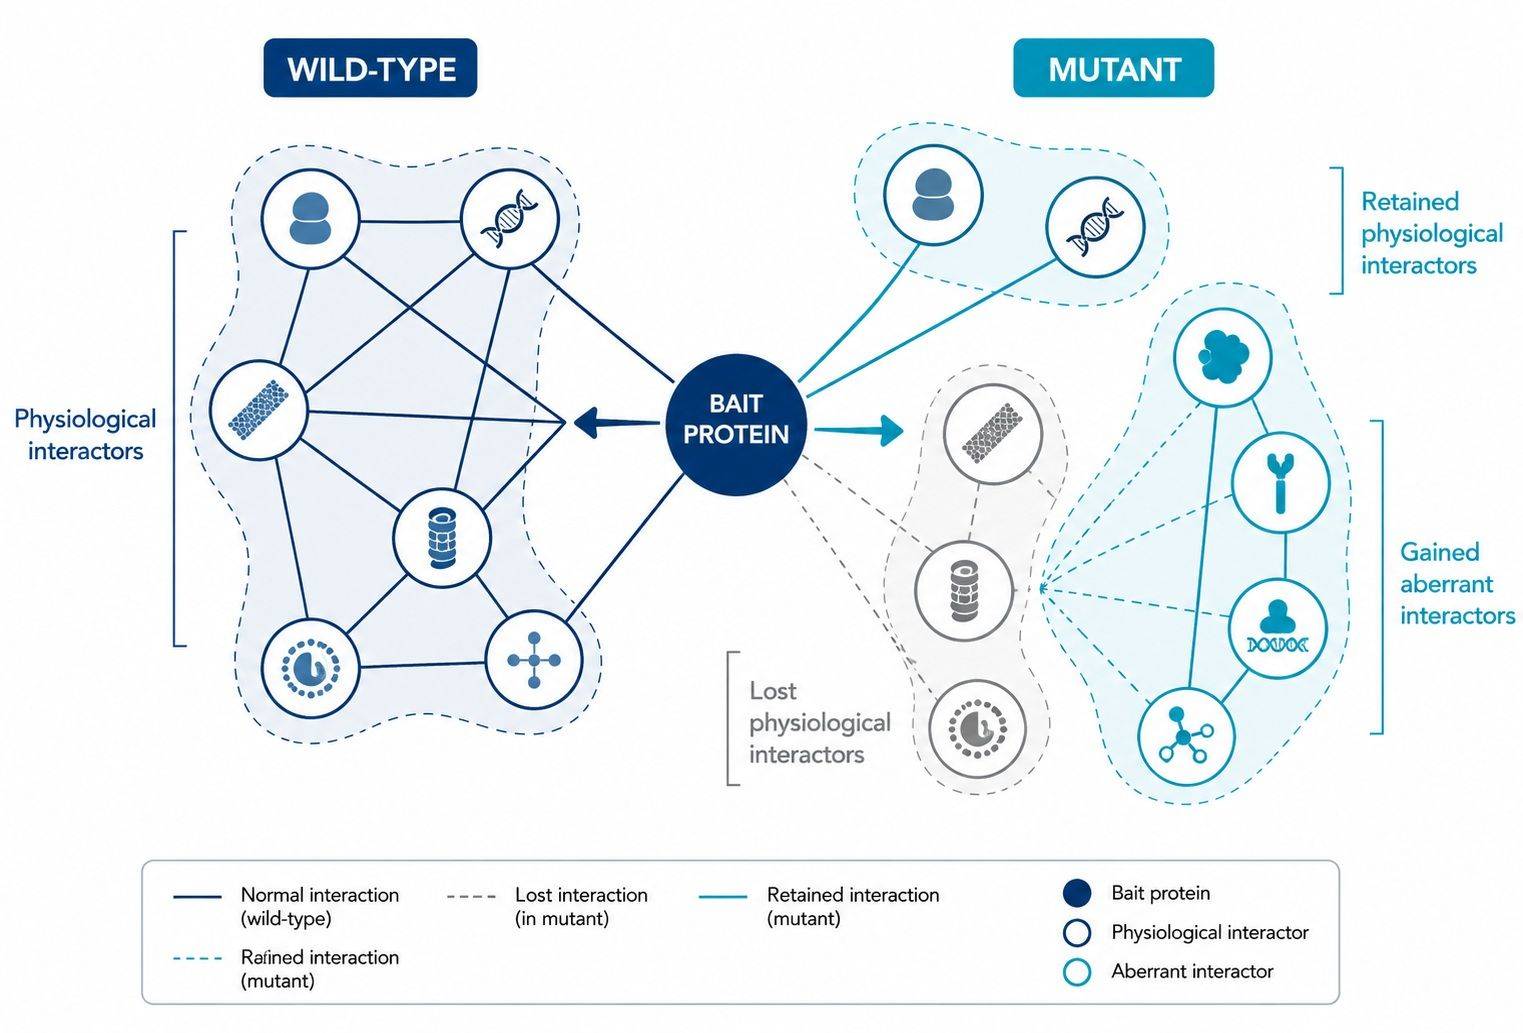
Interactome network diagrams highlight lost physiological complexes and newly acquired aberrant protein-protein interactions.

Variant Peptide Evidence Tables
- Annotated MS/MS spectra, precursor mass accuracy, retention time alignment, and variant peptide sequence confirmation.

Quality Assessment Summary
- Digestion completeness metrics, proteome depth, pooled QC CV distributions, and clone concordance assessment.

Differential Expression & TPP Curves
- Statistical testing (limma FDR ≤ 0.05), fold-change ranking, and fitted Boltzmann thermal denaturation melting curves.

Pathway & Interactome Mapping
- GSEA functional pathway enrichment, KSEA kinase activity networks, and SAINTexpress filtered interactome tables.

Comprehensive Final Report
- Publication-ready figures, auditable methods documentation, and candidate shortlists for targeted PRM validation.