
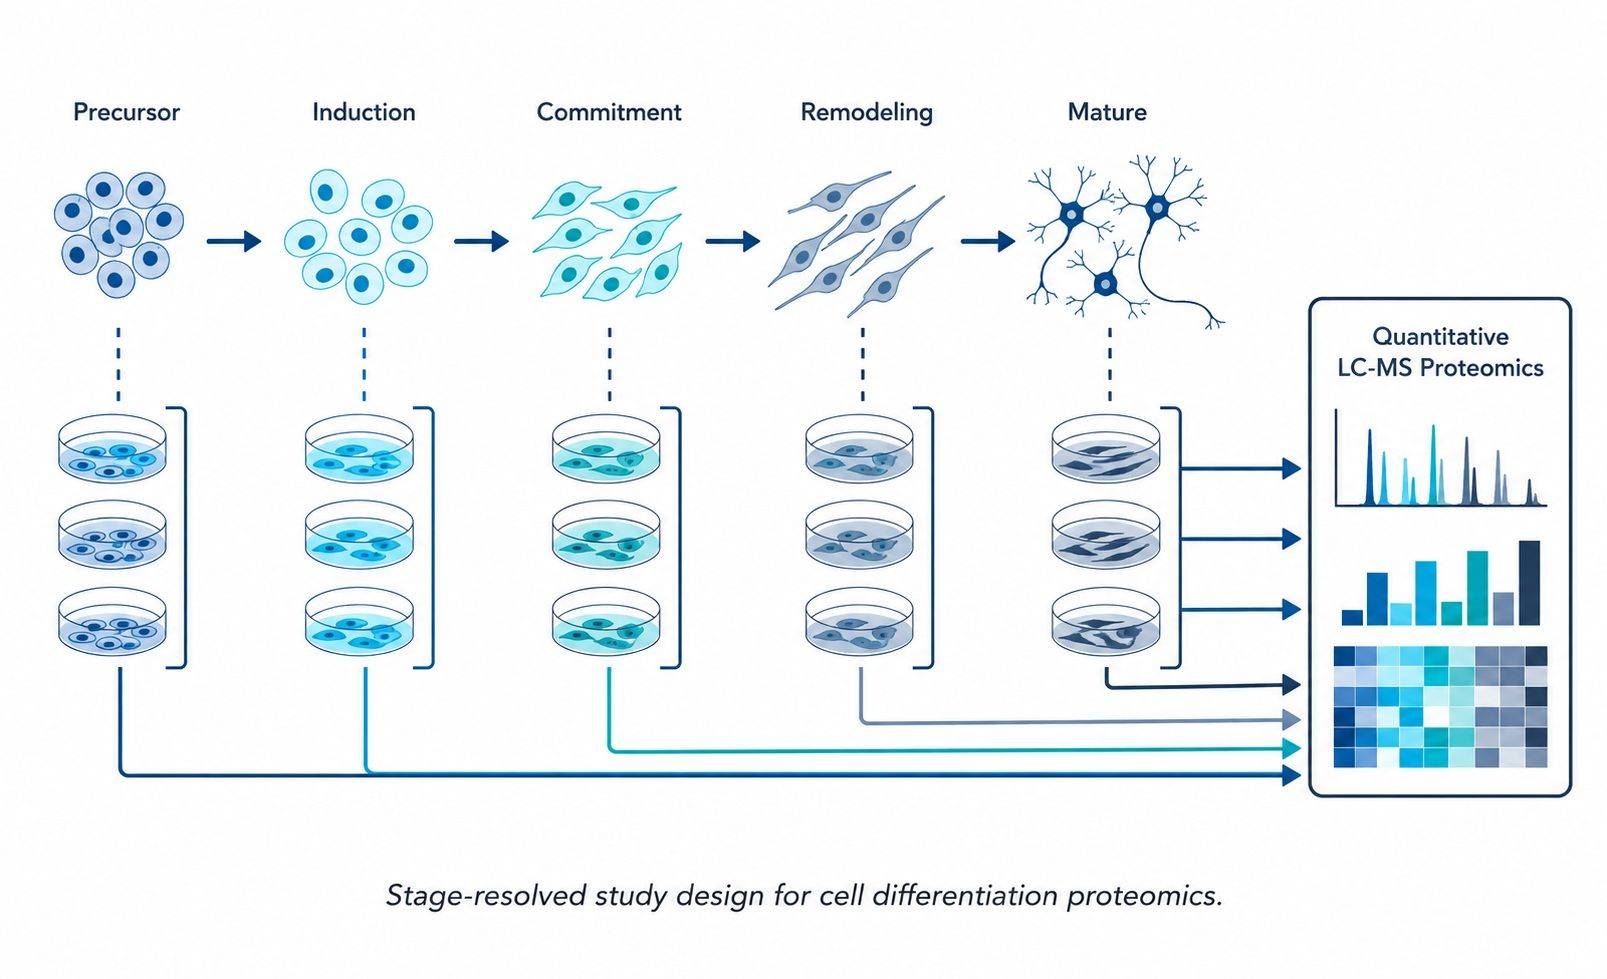
Cell Differentiation Proteomics for Stage-Resolved Molecular Characterization
Cell differentiation proteomics is the quantitative LC-MS/MS characterization of protein abundance and regulatory modification states across defined differentiation stages to evaluate cell-fate progression, lineage specification, and functional maturation.
Cell differentiation is a regulated sequence of induction, lineage commitment, structural and metabolic remodeling, and functional maturation. These events may not occur simultaneously, and their protein-level signatures can differ substantially between models. A stage-resolved proteomics design provides a structured basis for examining how protein abundance and pathway activity change across defined states.
Protein abundance reflects translational control, protein turnover, subcellular localization, complex assembly, and post-translational regulation. Quantitative proteomics therefore complements transcriptomic, phenotypic, and functional measurements when investigators need to evaluate whether an experimental system is progressing through the intended differentiation program.
Content Guide
- Definition & Rationale
- Time-Course Design
- Study Architectures
- Lineage Marker Context
- DIA & 4D-DIA Options
- Batch & Background Control
- Temporal Analytics
- Project Workflow
- Sample Submission
- Deliverables & Interpretation
Transition-Based Time-Course Experimental Design and Stage Gating
Define biological states and transition gates before selecting time points, comparisons, and proteomics readouts.
Stage gating should be based on model-relevant phenotype, morphology, validated markers, functional readouts, or pilot data rather than on culture day alone. For robust time-course statistics, we recommend ≥3–4 independent biological differentiation batches per time point to separate true developmental kinetics from intra-batch drift.

Lineage-State Characterization
Assess whether multiple lineage-associated proteins and pathway programs distinguish precursor, intermediate, and intended differentiated states.

Maturation Assessment
Evaluate coherent changes in functional protein modules rather than relying on a single canonical marker as evidence of maturation.

Differentiation Trajectory Mapping
Identify stage-associated protein clusters and pathway transitions across early, intermediate, and late differentiation states.

Parallel Lineage Comparison
Differentiate shared differentiation responses from protein programs that are specific to one lineage derived from a common precursor.

Perturbation Studies
Determine whether a gene edit, treatment, cytokine, media condition, or other intervention alters trajectory timing or state-specific protein programs.

RNA-Protein Integration
Compare matched transcript and protein trajectories to identify concordant programs, delayed protein responses, and post-transcriptional regulation.
Study Architectures for Differentiation, Lineage, and Maturation Programs
The study architecture determines which biological inferences can be supported. We help define comparisons that are consistent with the model, available material, and research objective before data acquisition begins.
Defined-State Comparison
Precursor vs. Intended State
Appropriate when the central question is whether a differentiated population has acquired a distinct protein program.
Transition-Focused Time Course
Early to Mature Stages
Appropriate for characterizing ordered molecular changes during induction, commitment, and maturation.
Parallel Lineage Study
Common Precursor, Distinct Fates
Appropriate for identifying shared and lineage-selective protein programs.
Perturbation During Differentiation
Condition-by-Stage Design
Appropriate for testing whether an intervention modifies transition timing or maturation-associated pathways.
Clone or Donor Comparison
Biological Variability Assessment
Appropriate when donor, clone, or production-batch effects must be separated from differentiation biology.
Discovery-to-Verification Design
Broad Profiling to Marker Panel
Appropriate when discovery results will inform a focused research panel for later comparisons.
Differentiation Lineage and Marker-Panel Context
Marker panels should be interpreted in the context of the specific differentiation protocol, sample type, and analytical scope. The examples below are research-oriented reference points rather than universal acceptance criteria; protein-level evidence is stronger when multiple markers and functional modules are evaluated together.
| Differentiation Model | Illustrative Stage Context | Illustrative Protein Markers and Programs |
|---|---|---|
| iPSC to neural lineage | Pluripotent state, neural progenitor, neuronal or glial maturation | POU5F1/OCT4 and NANOG for pluripotency; SOX1 and PAX6 for neural progenitor context; TUBB3, MAP2, and SYN1 for neuronal differentiation and synaptic maturation context. |
| iPSC to hepatocyte-like cells | Definitive endoderm, hepatoblast-like stage, hepatocyte-like maturation | SOX17 and FOXA2 for definitive endoderm context; AFP for hepatoblast-associated context; ALB and cytochrome P450 family proteins for hepatocyte-like maturation context. |
| Stem-cell to cardiomyocyte | Cardiac specification and contractile maturation | NKX2-5 for cardiac specification context; TNNT2 and MYH6/MYH7 for contractile-protein remodeling and cardiomyocyte maturation context. |
| Myeloid or macrophage differentiation | Myeloid commitment and macrophage-like maturation | SPI1/PU.1, CSF1R, LST1, and CD68 can be assessed with broader innate-immune, lysosomal, and phagocytic protein programs. |
High-Throughput DIA and 4D-DIA Quantitative Proteomics for Differentiation Cohorts
Selecting the optimal mass spectrometry workflow depends on sample complexity, stage cohort size, and whether regulatory signaling or targeted verification is required:

DIA Quantitative Proteomics
Standard DIA quantitative proteomics provides comprehensive, single-shot protein-abundance profiling across continuous differentiation stages, time points, or perturbation conditions with minimal missing data.

4D-DIA Quantitative Proteomics
For complex or low-input differentiation cohorts, our 4D-DIA quantitative proteomics service incorporates trapped ion mobility spectrometry (TIMS) to enhance peak capacity, resolve isomeric peptides, and increase quantitative data completeness.

Phosphoproteomics
Our phosphoproteomics service provides a dedicated signaling layer to capture early receptor activation, kinase-substrate cascades, and phosphorylation rewiring that precede total protein abundance shifts.

Targeted Proteomics
Following discovery profiling, targeted PRM proteomics enables high-throughput, absolute or multiplexed verification of predefined lineage markers across extensive differentiation batches.
Longitudinal Batch-Effect Mitigation and Exogenous Background Control
In longitudinal differentiation studies, biological stage can be unintentionally confounded with culture date, preparation batch, or acquisition order. We recommend recording and, where feasible, balancing donor or clone, passage, plating density, media lot, confluence, viability, harvest method, sample-preparation batch, and instrument run order across the planned states and conditions.
| Potential Background Source | Planning and Data-Review Consideration |
|---|---|
| Culture and analytical batch | Use independent differentiations where feasible, retain batch metadata, and avoid processing all early-stage samples separately from all late-stage samples. |
| Feeder cells | For mixed-species feeder systems such as mouse embryonic fibroblast (MEF) support cultures, record feeder use and species. Species-specific peptide evidence can be reviewed during database-search and downstream interpretation where the project design requires it. |
| Coating matrices | Matrigel, Geltrex, laminin, vitronectin, and related extracellular-matrix reagents can contribute exogenous proteins. Where compatible with the protocol, thoroughly wash harvested cells with cold phosphate-buffered saline and document the matrix used. |
| Media supplements | Record serum, albumin, B27, cytokines, and other protein-containing supplements so potential carryover can be considered during sample preparation and data review. |
Temporal Trajectory and Cluster Analytics for Differentiation Time Courses
Pairwise comparisons remain useful for defined state contrasts, but they do not by themselves describe the temporal structure of a differentiation series. When the number and spacing of time points support it, we can organize quantitative protein matrices into dynamic modules and evaluate how protein programs change across the trajectory.
| Analysis Approach | Appropriate Use in Differentiation Proteomics |
|---|---|
| Temporal clustering | Fuzzy c-means (Mfuzz) or related soft-clustering approaches can group proteins into early-transient, sustained-increase, late-increase, or stage-repressed modules when the time-course design provides sufficient resolution. |
| Change-point or transition analysis | Can prioritize intervals at which coordinated protein modules change, subject to replicate structure, sampling density, and data quality. |
| RNA-protein concordance analysis | With matched transcriptomic data, correlation and discordance analysis can distinguish concordant programs from protein changes that lag, diverge from, or are not explained by RNA abundance. |
| Pseudotime integration | Pseudotime and branching analysis are principally appropriate for single-cell or matched multi-omics datasets. They can be integrated when those data and a scientifically appropriate design are available; they are not assumed as a default bulk-proteomics output. |
Integrated Project Workflow for Differentiation Proteomics
Our workflow integrates experimental design and analytical planning so that the final quantitative dataset can be interpreted against the differentiation states and comparisons defined at project initiation.
Define the cell model, intended lineage or mature state, transition points, biological replicate structure, and planned comparisons.
Review sample metadata and prepare protein extracts using a workflow selected for the sample type and project scope.
Acquire data using a quantitative proteomics approach appropriate for the study design and required molecular layer.
Generate quantitative protein and peptide tables and review identification, sample-level behavior, and technical variation.
Perform state, stage, or condition comparisons and evaluate time-associated protein patterns when supported by the design.
Organize results around lineage markers, functional modules, pathway enrichment, and the prespecified biological question.
Information That Helps Us Scope Your Differentiation Study
- Transition-aware time-point planning for model-relevant differentiation stages
- Independent cultures and batch-aware metadata for biological interpretation
- Quantitative proteomics options selected for broad discovery or focused follow-up
- Data packages organized around defined lineage, maturation, and perturbation questions
Sample Submission Requirements for Differentiation Cell Pellets and Low-Input Samples
Cell yield can be limiting at early differentiation stages, in embryoid bodies, in small organoids, and after flow sorting of rare progenitor populations. The recommendations below provide a practical starting point for project planning. Final acceptance and low-input workflow selection are confirmed through feasibility review because cell type, lysis chemistry, sample complexity, and the desired analysis layer affect the usable protein yield.
| Submitted Material | Recommended Starting Point | Collection and Handling Considerations |
|---|---|---|
| Standard differentiation cell pellet | Typically ≥ 1–5 × 10⁶ cells (10–20 μg total protein equivalent) | Harvest the intended state using a consistent procedure, wash with cold phosphate-buffered saline (PBS) 3× to remove media proteins, snap-freeze the pellet in liquid N2, and avoid repeated freeze-thaw cycles. |
| Low-input or sorted cell population | 5 × 10⁴ – 1 × 10⁵ cells (500 ng – 2 μg total protein for 4D-DIA) | Provide expected cell number, collection buffer, sorting method, and storage condition. Low-input workflows utilize microscale S-Trap or SP3 processing. |
| Protein lysate | ≥ 10–20 μg total protein (≥ 1–2 μg for microscale DIA) | Provide buffer composition and avoid final submissions with high detergent, high salt, or other MS-incompatible components where possible. |
| Matrix- or feeder-exposed cultures | Document the matrix, feeder, and media supplements used | Record Matrigel, Geltrex, laminin, vitronectin, feeder-cell species, serum, albumin, B27, cytokines, and wash history to support background review. |
For all differentiation samples, provide the starting cell type, induction protocol, intended lineage or mature state, proposed stages, biological replicate structure, donor or clone information, known markers, planned perturbations, and the decision the study is intended to support.
Data Quality, Deliverables, and Biological Interpretation
Quantitative data, quality documentation, and stage-resolved interpretation for differentiation research
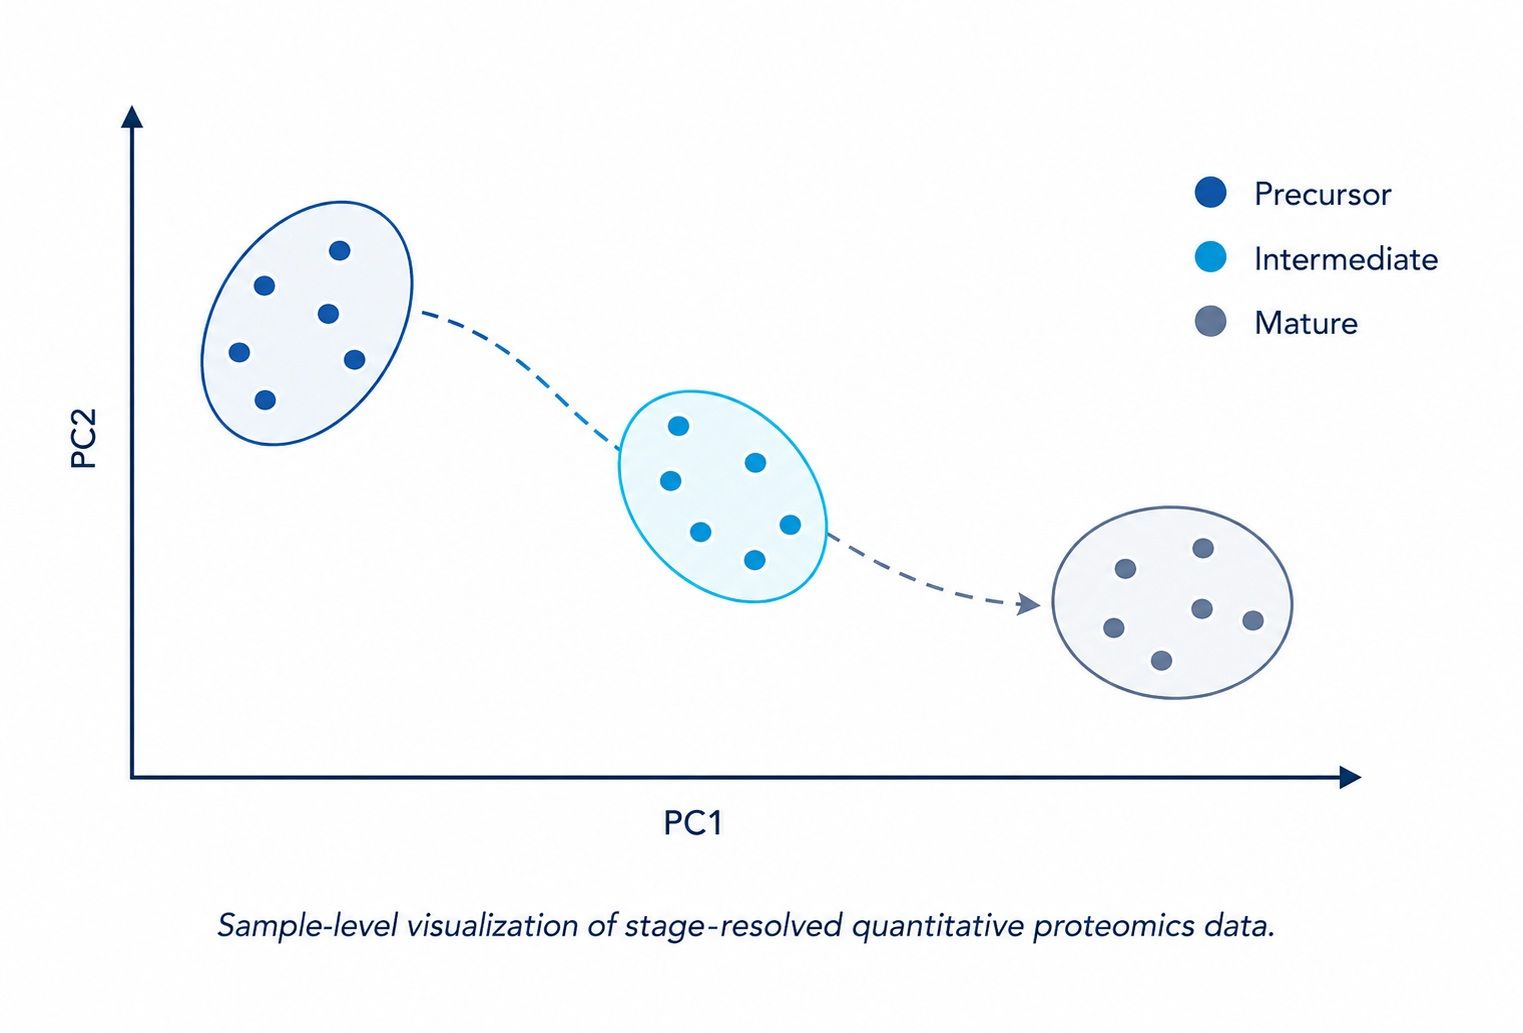
Sample-level visualization can assess whether quantitative profiles organize in relation to the prespecified cell states, biological replicates, and potential outliers.
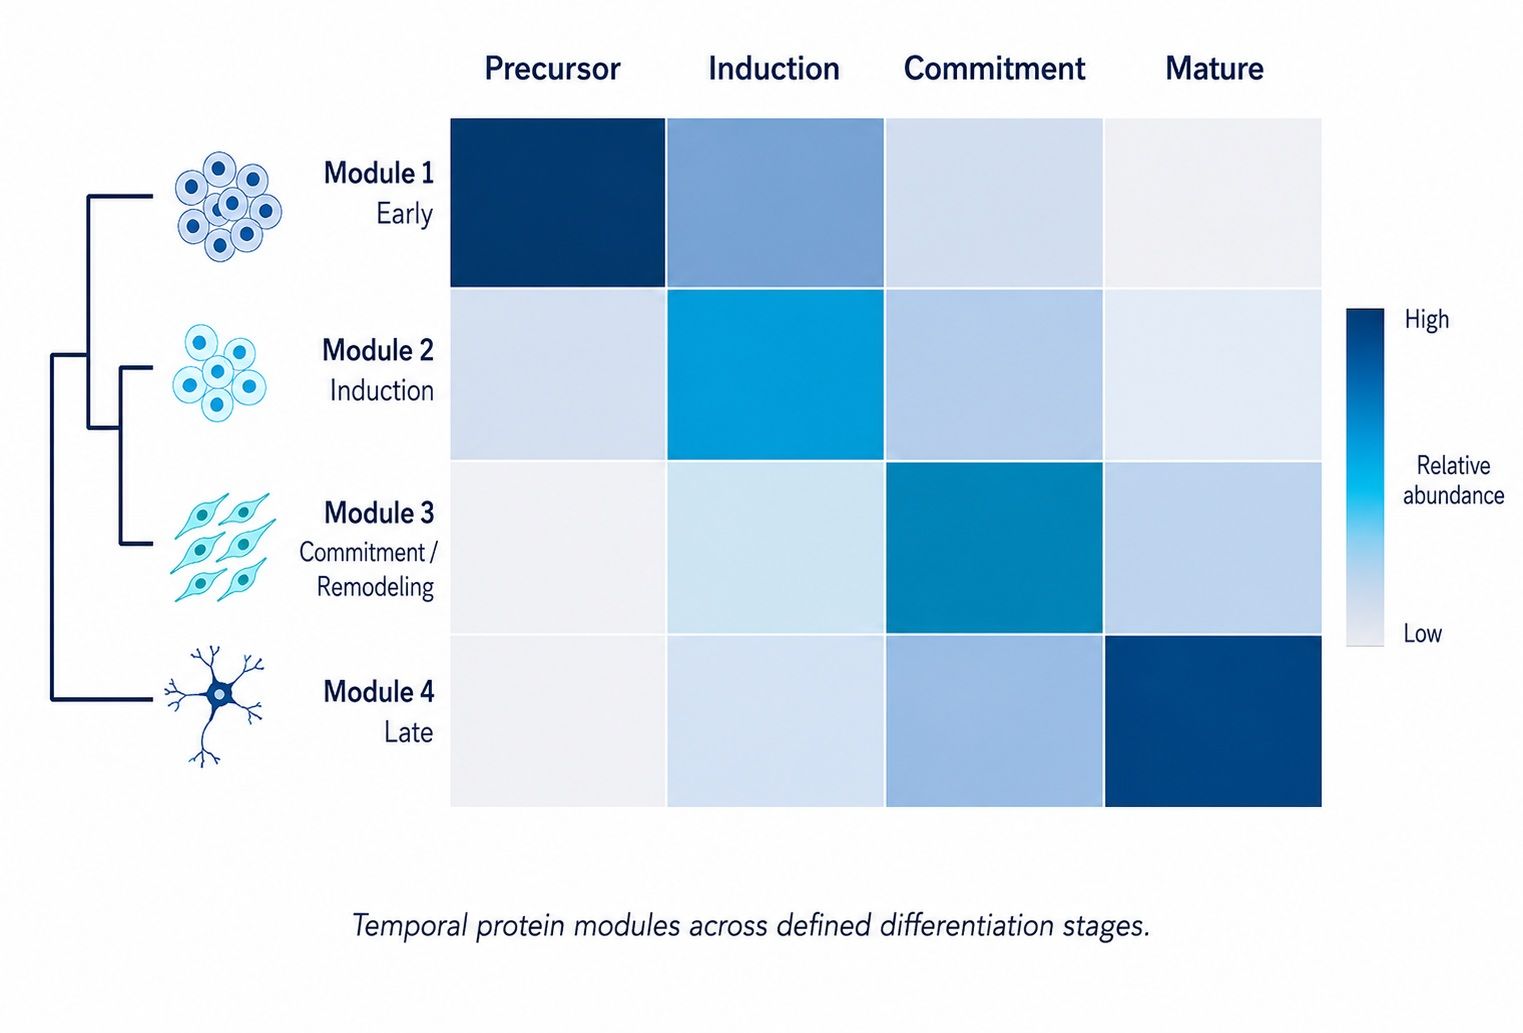
Temporal clustering and heatmaps can identify protein modules associated with induction, commitment, intermediate remodeling, or maturation.
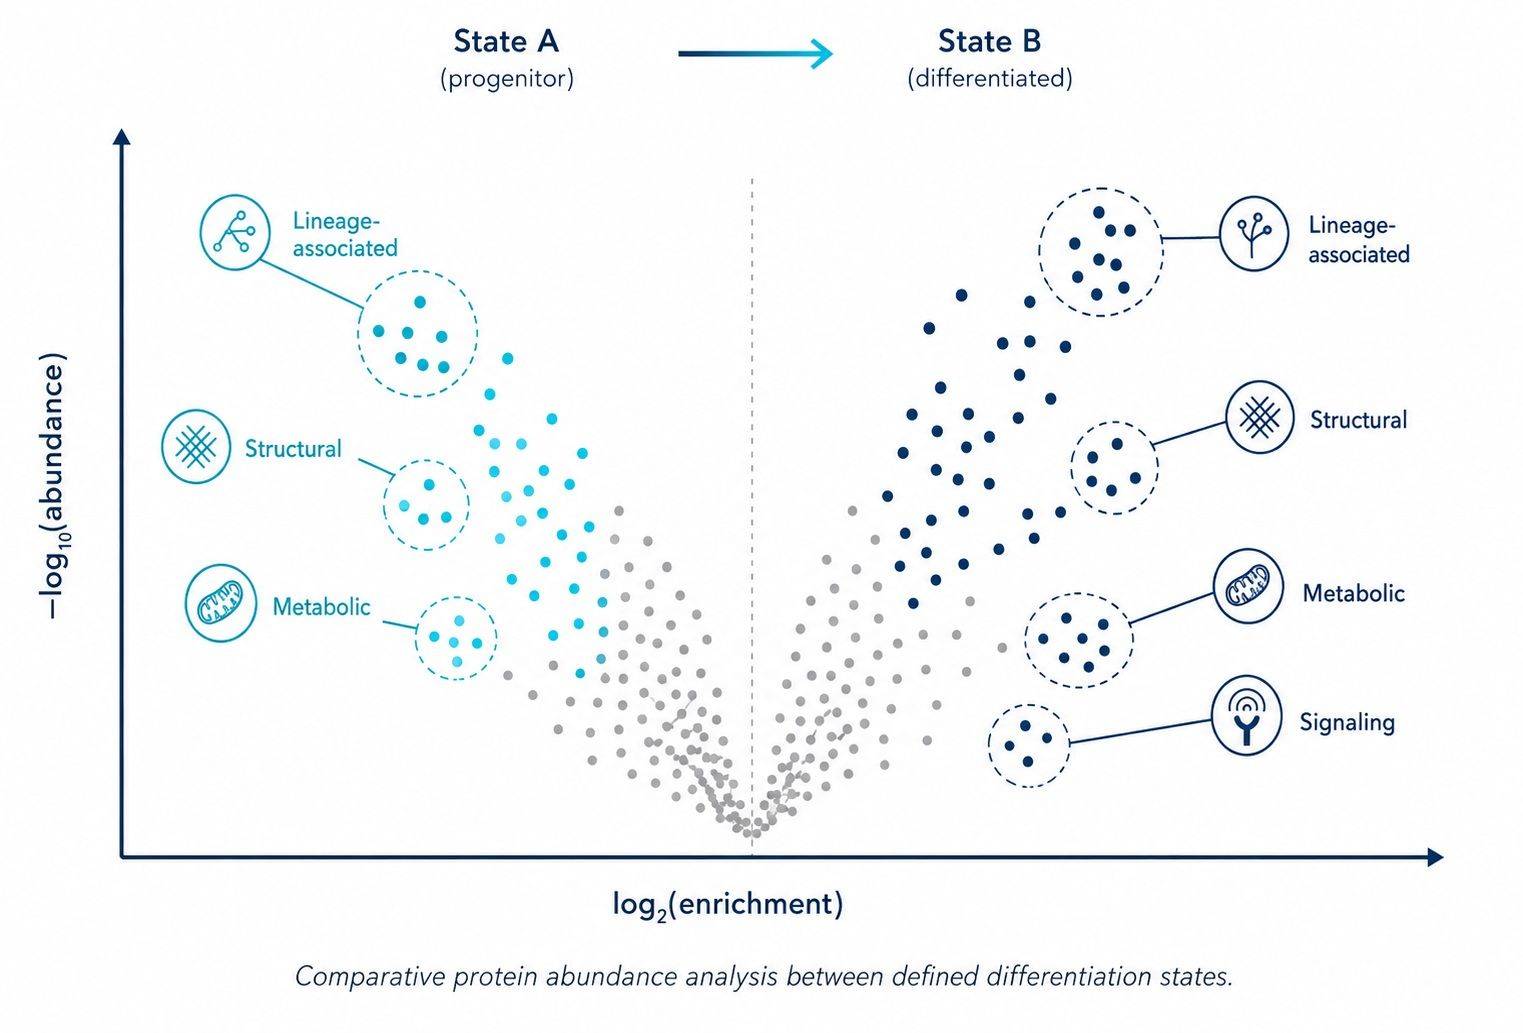
Predefined state and condition comparisons can prioritize proteins for lineage, maturation, or perturbation-focused interpretation.
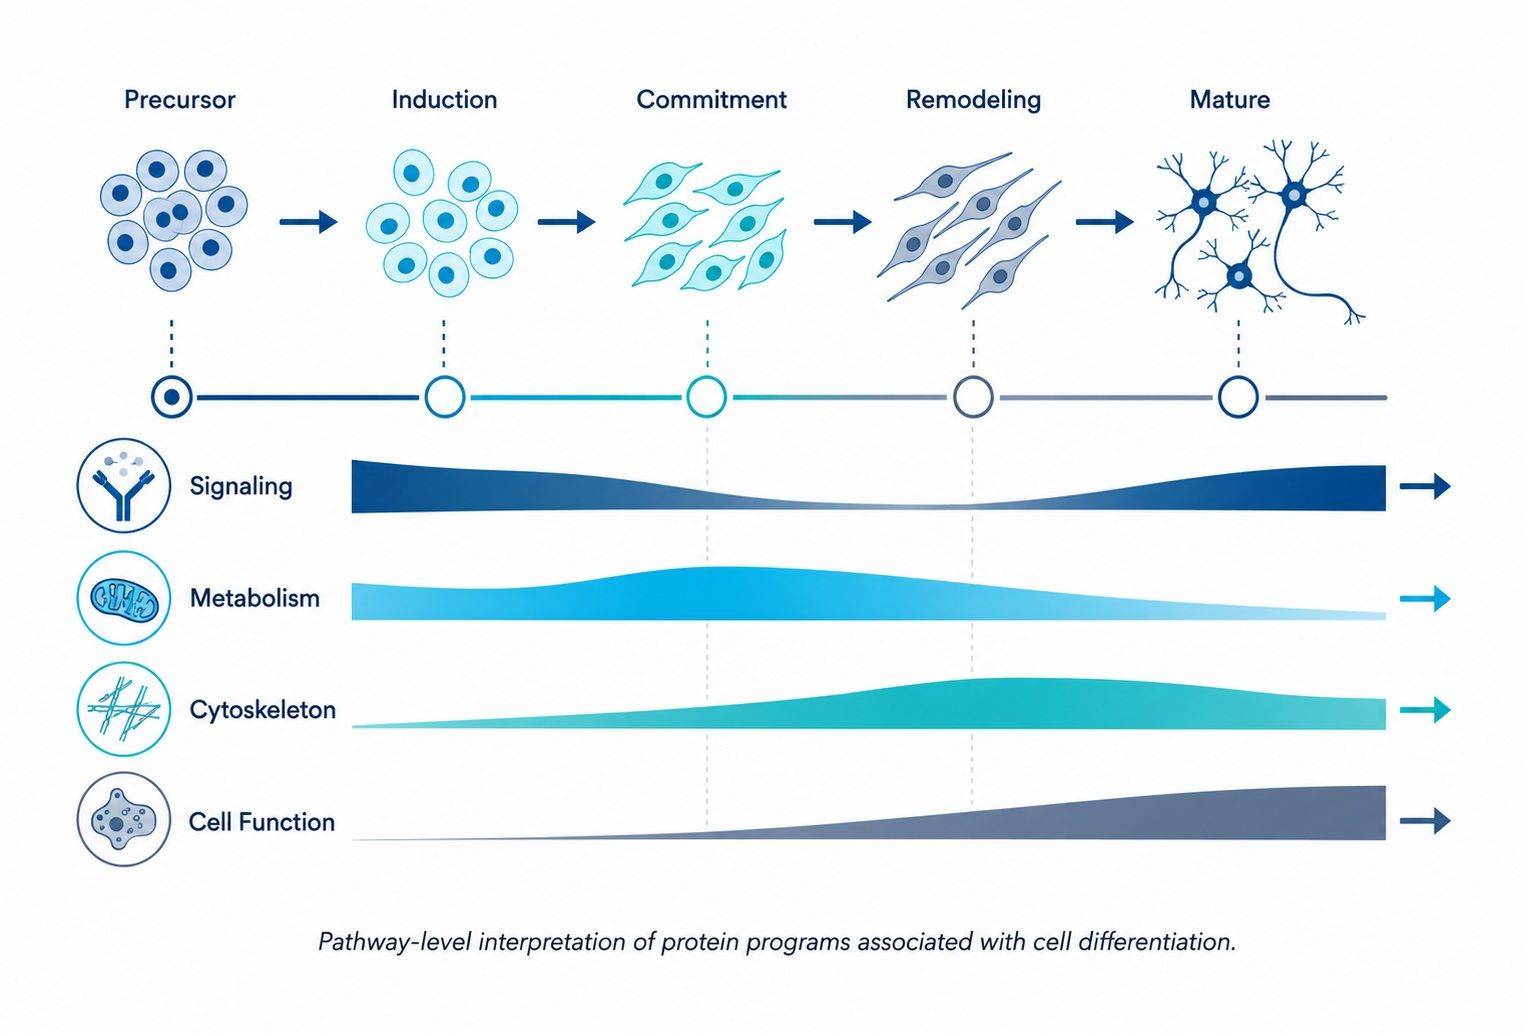
Functional enrichment and pathway views provide context for protein programs associated with the selected differentiation transitions.
Quantitative Data Tables
- Protein- and peptide-level quantitative matrices with sample and batch metadata.
Quality Assessment Summary
- Sample-level review and documented assessment of quantitative data behavior.
Comparative Analysis
- State, stage, lineage, or condition contrasts specified during project planning.
Trajectory and Cluster Views
- Trend-oriented views for proteins that change across defined differentiation stages.

Biological Interpretation
- Functional analysis and reporting organized around the study's lineage, maturation, or mechanism question.
- Our proteomics bioinformatics analysis service can support a defined analysis scope.
Selected Method References
- Hurrell T, Segeritz CP, Vallier L, Lilley KS, and Cromarty AD. A proteomic time course through the differentiation of human induced pluripotent stem cells into hepatocyte-like cells. Scientific Reports. 2019. DOI: 10.1038/s41598-019-39400-1.
- Budnik B, Straubhaar J, Neveu J, and Shvartsman D. In-depth analysis of proteomic and genomic fluctuations during the time course of human embryonic stem cells directed differentiation into beta cells. Proteomics. 2022. DOI: 10.1002/pmic.202100265.
- Quantitative Proteomics for the Development and Manufacturing of Human-Induced Pluripotent Stem Cell-Derived Neural Stem Cells Using Data-Independent Acquisition Mass Spectrometry. International Journal of Molecular Sciences. 2023. PMID: 37097202.
- Schoor C, Brocke-Ahmadinejad N, Gieselmann V, and Winter D. Investigation of Oligodendrocyte Precursor Cell Differentiation by Quantitative Proteomics. Proteomics. 2019. DOI: 10.1002/pmic.201900057.