
What Is Macrophage Polarization Proteomics?
Macrophage polarization proteomics is the mass spectrometry-based identification and quantification of protein abundance, post-translational modifications (PTMs), metabolic enzymes, and secretomes across uncommitted (M0), classically activated (M1), alternatively activated (M2), and disease-associated macrophage states.
Macrophage activation represents a dynamic, multidimensional continuum governed by integrated transcriptional programs, metabolic rewiring, and post-transcriptional regulation. While transcriptomics identifies gene expression potential, quantitative proteomics delivers the definitive functional readout—revealing actual cell-surface receptor density, active metabolic enzyme complexes (e.g., ACOD1/IRG1 itaconate synthesis, ARG1 vs. iNOS balance), cytoskeletal remodeling, and secreted effector molecules.
Unlike discovery proteomics on static cell lines, macrophage studies require specialized pre-analytical quenching and cohort-matched normalization to resolve acute phosphorylation kinetics from sustained phenotypic remodeling.
Content Guide
- Biological Rationale
- Common Challenges
- Service Advantages
- Tailored Solutions
- Polarization Marker Context
- Workflow
- Platform Decision Guide
- Sample Requirements
- Deliverables
The Limitations of Conventional Assays vs Direct Proteomics
Conventional flow cytometry and targeted antibody assays measure only 3–5 predefined surface markers (e.g., CD80, CD86, CD206), assuming a rigid binary M1/M2 switch. However, actual macrophage activation involves simultaneous remodeling of metabolic enzymes, intracellular kinase networks, transcriptional cofactors, and secreted cytokines. Furthermore, mRNA-to-protein discordance in activated macrophages is substantial due to translational stalling and rapid post-transcriptional degradation.
Direct LC-MS/MS proteomics eliminates single-marker bias by quantifying thousands of proteins simultaneously—providing an unbiased, multi-parametric molecular signature across cell models, activation kinetics, and therapeutic interventions.
When to Use Macrophage Polarization Proteomics
- You are developing TAM-targeting therapeutics and need to verify whether your drug candidate (small molecule, STING agonist, antibody) induces authentic M2-to-M1 phenotypic repolarization across the entire proteome.
- You are investigating inflammatory signaling kinetics and need to capture acute phosphorylation cascades (TLR4/MyD88, NF-κB, MAPK, JAK-STAT1/6 at 15–120 min) alongside sustained phenotypic remodeling (at 24–48 h).
- You are profiling macrophage secretomes and need unbiased quantification of cytokines, chemokines, and matrix metalloproteinases (MMPs) without bovine serum albumin (BSA) interference.
- You are performing CRISPR gene perturbations in macrophages and must establish downstream proteome compensation and pathway rewiring beyond simple target confirmation.
- You are working with precious primary human MDMs or sorted TAMs and require high-depth, low-input quantification (from as few as 50,000 cells) with paired donor batch control.
Challenges in Macrophage Proteomics & How We Address Them
Overcoming donor variance, secretome background, stress-induced activation, and dynamic range constraints.

High Donor-to-Donor Biological Variance
Primary human MDMs display wide baseline heterogeneity across donors. We implement paired donor block designs and linear mixed-effects modeling to isolate true treatment-induced shifts from donor background variation.

Secretome Serum Albumin & Supplement Masking
FBS supplements overwhelm mass spectrometry dynamic range. We utilize serum-free conditioning pulses (12–24 h) coupled with 3 kDa ultrafiltration cleanup to achieve deep secretome coverage without serum protein masking.

Harvesting-Induced Kinase Activation Artifacts
Mechanical scraping or prolonged trypsinization triggers stress-activated protein kinase (p38 MAPK, JNK) phosphorylation. Our protocol employs rapid ice-cold PBS washing (≤15 s) and direct on-plate lysis to halt signaling instantly.

Kinetic Disconnect: Phosphorylation vs Abundance
Key inflammatory cascades undergo phosphorylation within 15–120 minutes, while total protein abundance shifts require 12–48 hours. We deploy paired global DIA and 4D-phosphoproteomics to capture both regulatory layers.

Cross-Species Polarization Marker Divergence
Murine markers (Arg1, iNOS, Ym1) differ fundamentally from human MDMs (CD206, CD163, ALOX15). Untargeted LC-MS/MS quantifies entire proteomes simultaneously, bypassing single-marker species discrepancies.

Hydrophobic Surface Receptor Recovery
Macrophage membrane markers and immune checkpoints (CD80/CD86, CD206, SIRPα, PD-L1) require high-efficiency SDS/S-Trap assisted extraction with probe sonication to achieve complete solubilization without precipitation.
Macrophage Polarization Proteomics Service Advantages

Comprehensive Proteome Depth
6,500–8,500+ Proteins / Run
Deep single-shot DIA profiling captures low-abundance transcription factors, cytokines, and membrane receptors without chemical labeling bias.

Dynamic Phosphoproteomics
15,000–25,000+ Phosphosites
Microscale Ti-IMAC/Fe-NTA enrichment captures acute kinase activation cascades and substrate phosphorylation networks.

Dual Fraction Profiling
Intracellular & Secretome
Simultaneous analysis of cellular metabolic/signaling enzymes and extracellular cytokine/chemokine/microvesicle secretomes.

Sample Efficiency
As Low As 5×10⁴ Cells
High-sensitivity 4D-DIA (dia-PASeF) enables robust quantification from precious FACS-sorted TAMs and limited biopsy specimens.

Paired Donor Normalization
Donor-Matched Precision
Linear mixed-effects modeling eliminates primary human donor baseline variance, isolating true polarization and drug treatment effects.

Multi-Model Compatibility
Human · Mouse · Cell Lines
Validated SOPs across human MDMs, mouse BMDMs, THP-1, RAW 264.7, and primary ex vivo isolated tumor-infiltrating macrophages.
Macrophage Polarization Proteomics Tailored to Your Needs
Choose from discovery DIA, 4D-phosphoproteomics, secretome, or targeted validation modules.

Discovery DIA / 4D-DIA Proteomics
- Global, label-free profiling capturing >6,500–8,500+ protein groups across M0, M1, M2, and TAM activation states.
- High quantitative completeness (<5% missing values) with TIMS-enabled ion mobility separation.

4D Phosphoproteomics & Kinase Kinetics
- Enrichment for acute signaling cascades (TLR4/MyD88, NF-κB, p38 MAPK, JAK-STAT1/6).
- Site-level localization, motif analysis, and Kinase-Substrate Enrichment Analysis (KSEA).

Macrophage Secretome & Cytokine Profiling
- Serum-free conditioned media analysis quantifying secreted cytokines, chemokines, and MMPs.
- Addresses paracrine signaling and microenvironmental effector output.

Targeted PRM/MRM Validation Panels
- High-selectivity multiplexed verification of curated macrophage marker panels (20–60 targets).
- Absolute or relative quantification across large-scale compound screening cohorts.
Polarization States, Activation Stimuli, and Marker-Panel Context
Match your model system and experimental question with the appropriate molecular readout.
| Polarization State | Induction Stimuli | Representative Proteomic & Metabolic Signatures |
|---|---|---|
| M0 (Uncommitted / Homeostatic) | M-CSF (CSF-1) differentiation or low-dose PMA rest | CD14, CD68, CSF1R, baseline actin remodeling, balanced mitochondrial oxidative phosphorylation. |
| M1 (Classically Activated) | LPS (10–100 ng/mL) + IFN-γ (20 ng/mL) | CD80, CD86, CD64, STAT1, IRF5, CXCL9, CXCL10; high glycolysis (GLUT1, HK2, LDHA); itaconate shunt (ACOD1/IRG1) and succinate accumulation driving HIF-1α stabilization. |
| M2a (Alternative / Wound Healing) | IL-4 (20 ng/mL) / IL-13 (20 ng/mL) | CD206 (MRC1), CD163, TGM2, STAT6, ALOX15 (human), ARG1 (mouse); high fatty acid beta-oxidation (CPT1A) and oxidative phosphorylation (OXPHOS Complex I–V). |
| M2b (Regulatory / Immune Complex) | Immune complexes + TLR agonists / IL-1β | IL-10, CCL1, CD86, LIGHT (TNFSF14), sphingosine kinase-1; immunomodulatory cytokine balance. |
| M2c (Deactivated / Efferocytic) | IL-10 (10–20 ng/mL), TGF-β, Glucocorticoids | CD163, MerTK, TGF-β1, GAS6, high scavenger receptor expression; apoptotic cell clearance and anti-inflammatory resolution. |
| M2d / TAM-like (Tumor-Associated) | Tumor conditioned media, PGE2, Adenosine, Hypoxia | VEGF, MMP9, ARG1, CD206, PD-L1 (CD274), SIRPα; high lactate-driven histone lactylation and extracellular matrix remodeling enzymes. |
Step-by-Step Macrophage Polarization Proteomics Workflow
At Creative Proteomics, our macrophage polarization proteomics workflow is optimized for reproducibility, depth, and biological relevance at every stage.
Define macrophage model (human MDMs, THP-1, BMDM, TAMs), activation stimuli, paired donor blocking structure, and required analytical layers.
Perform rapid cold PBS washing (≤15 s), direct on-plate SDS/S-Trap lysis, phosphatase preservation, and serum-free secretome clarification.
Robotic S-Trap or magnetic SP3 processing with trypsin/Lys-C digestion, peptide quantification, and spike-in iRT process controls.
Single-shot DIA or 4D-DIA (dia-PASeF on timsTOF Pro 2) or high-field Orbitrap instruments with interleaved pooled QC injections.
Evaluation of peptide digest efficiency, pooled QC quantitative CV (<15%), retention-time stability, and donor-paired mixed-effects modeling.
Differential protein expression (limma FDR ≤ 0.05), M1/M2 polarization trajectory scoring, metabolic pathway GSEA, KSEA kinase networks, and PRM shortlists.
- Phenotype-resolved design: resolve continuous activation spectra without single-marker bias
- Paired-donor consistency: eliminate inter-individual primary cell variation with mixed-effects models
- Microscale capability: robust 4D-DIA profiling from as few as 50,000 sorted TAMs
- Dual-layer readouts: paired 4D-phosphoproteomics and secretome cytokine dynamics
Macrophage Proteomics Analytical Platform Decision Guide
Match your macrophage sample type, cohort scale, and biological question with the optimal acquisition strategy and mass spectrometry platform.
| Study Objective & Scenario | Recommended Strategy | Primary MS Platform | Technical Rationale & Deliverables |
|---|---|---|---|
| Global Phenotype & Metabolic Profiling (Standard Pellets / Cell Lines / MDMs) |
Discovery DIA Quantitative Proteomics | Orbitrap Astral / Exploris 480 / timsTOF Pro 2 | Single-shot depth (>6,500–8,500+ proteins), CV < 15%, deep coverage of metabolic enzymes and surface receptors across multi-condition cohorts. |
| Microscale & Precious Sorted Subsets (FACS-Sorted TAMs / Biopsies) |
High-Sensitivity 4D-DIA (dia-PASeF) | timsTOF Pro 2 / timsTOF Ultra | TIMS ion mobility maximizes ion utilization and peak capacity, enabling deep quantification from as few as 5×10⁴ to 2×10⁵ cells (500 ng – 2 μg protein). |
| Acute Activation & Signaling Kinetics (15–120 min Time-Course Series) |
4D Phosphoproteomics (Ti-IMAC / Fe-NTA Enrichment) |
timsTOF Pro 2 (TIMS-DIA) / Orbitrap Exploris 480 | Resolves isomeric phosphopeptides, localizes regulatory phosphosites (>15,000–25,000+ sites), and drives KSEA master kinase activity inference. |
| Paracrine Effector & Secretome Dynamics (Conditioned Media Supernatants) |
Serum-Free Secretome DIA Profiling | Orbitrap Exploris 480 / timsTOF Pro 2 | High dynamic range resolves low-abundance secreted cytokines, chemokines, and MMPs following serum-free pulse conditioning and 3 kDa cleanup. |
| Targeted Biomarker & Compound Screening (Large Cohorts / Multi-Batch Studies) |
Targeted PRM / 4D-PRM Panels | Orbitrap PRM / Triple Quadrupole (TSQ Altis / QTRAP 6500+) | Absolute or high-precision relative quantification of curated 20–60 macrophage marker panels with high throughput and zero missing values across cohorts. |
Sample Requirements and Submission Guidelines

Cold-chain protocol: Wash monolayers with ice-cold PBS (≤15 s), snap-freeze cell pellets in liquid N₂, and ship on dry ice (-80°C).
Phosphoproteomics: Lyse immediately in buffer containing protease and phosphatase inhibitors (PhosSTOP, sodium orthovanadate).
| Sample Category | Recommended Input | Storage & Handling |
|---|---|---|
| Standard Macrophage Pellets | 1–5 × 10⁶ cells (20–50 μg protein) | Wash 2× with cold PBS; snap-freeze pellet; ship on dry ice (-80°C) |
| Microscale / Sorted TAMs (FACS) | 1–5 × 10⁵ cells (1–5 μg protein) | Sort into low-binding tubes with lysis buffer; snap-freeze; ship on dry ice |
| Macrophage Phosphoproteomics | 5–10 × 10⁶ cells (100–200 μg protein) | Lyse with PhosSTOP & 1 mM orthovanadate; flash-freeze; ship on dry ice |
| Conditioned Media (Secretome) | 2–5 mL conditioned medium | Serum-free conditioning (12–24 h); clarify at 2,000 × g; ship on dry ice |
| Pre-Extracted Lysates | 20–50 μL at 1–2 mg/mL | SDS/RapiGest buffer; BCA quantified; ship on dry ice |
Not sure about sample requirements?
Contact us — our scientific team will evaluate your sample type and design the optimal preparation strategy.
What You'll Receive from Our Macrophage Proteomics Service
Quantitative data, quality documentation, and publication-ready biological insights
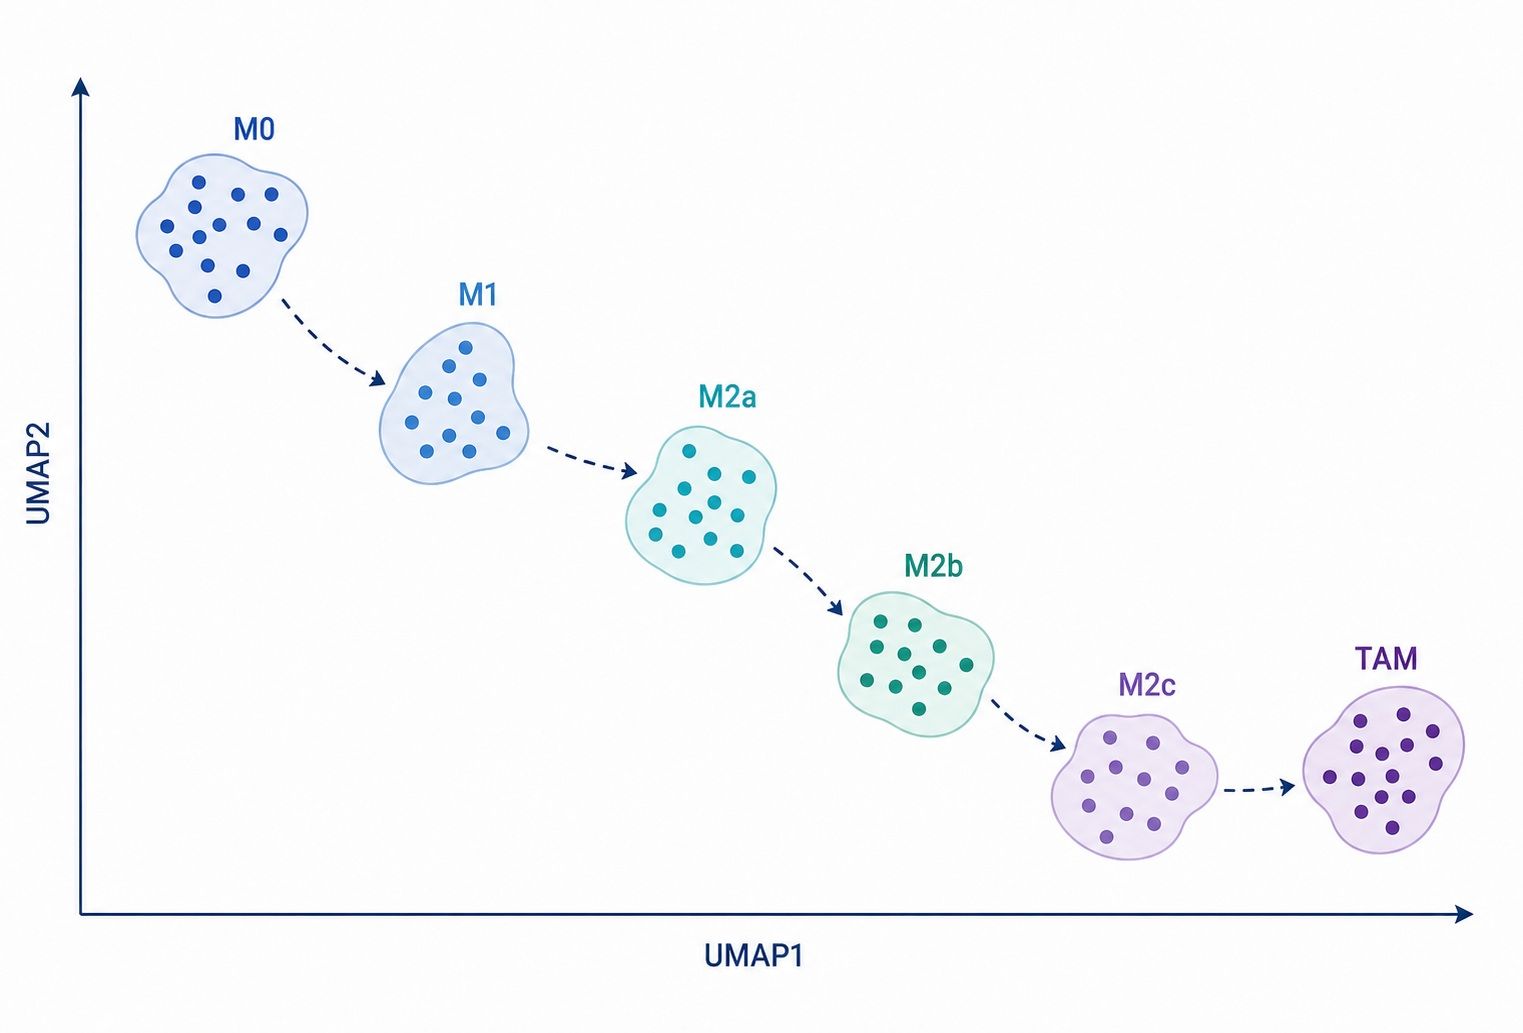
Sample-level PCA/UMAP assesses whether quantitative profiles organize according to M0, M1, M2, or TAM activation states.
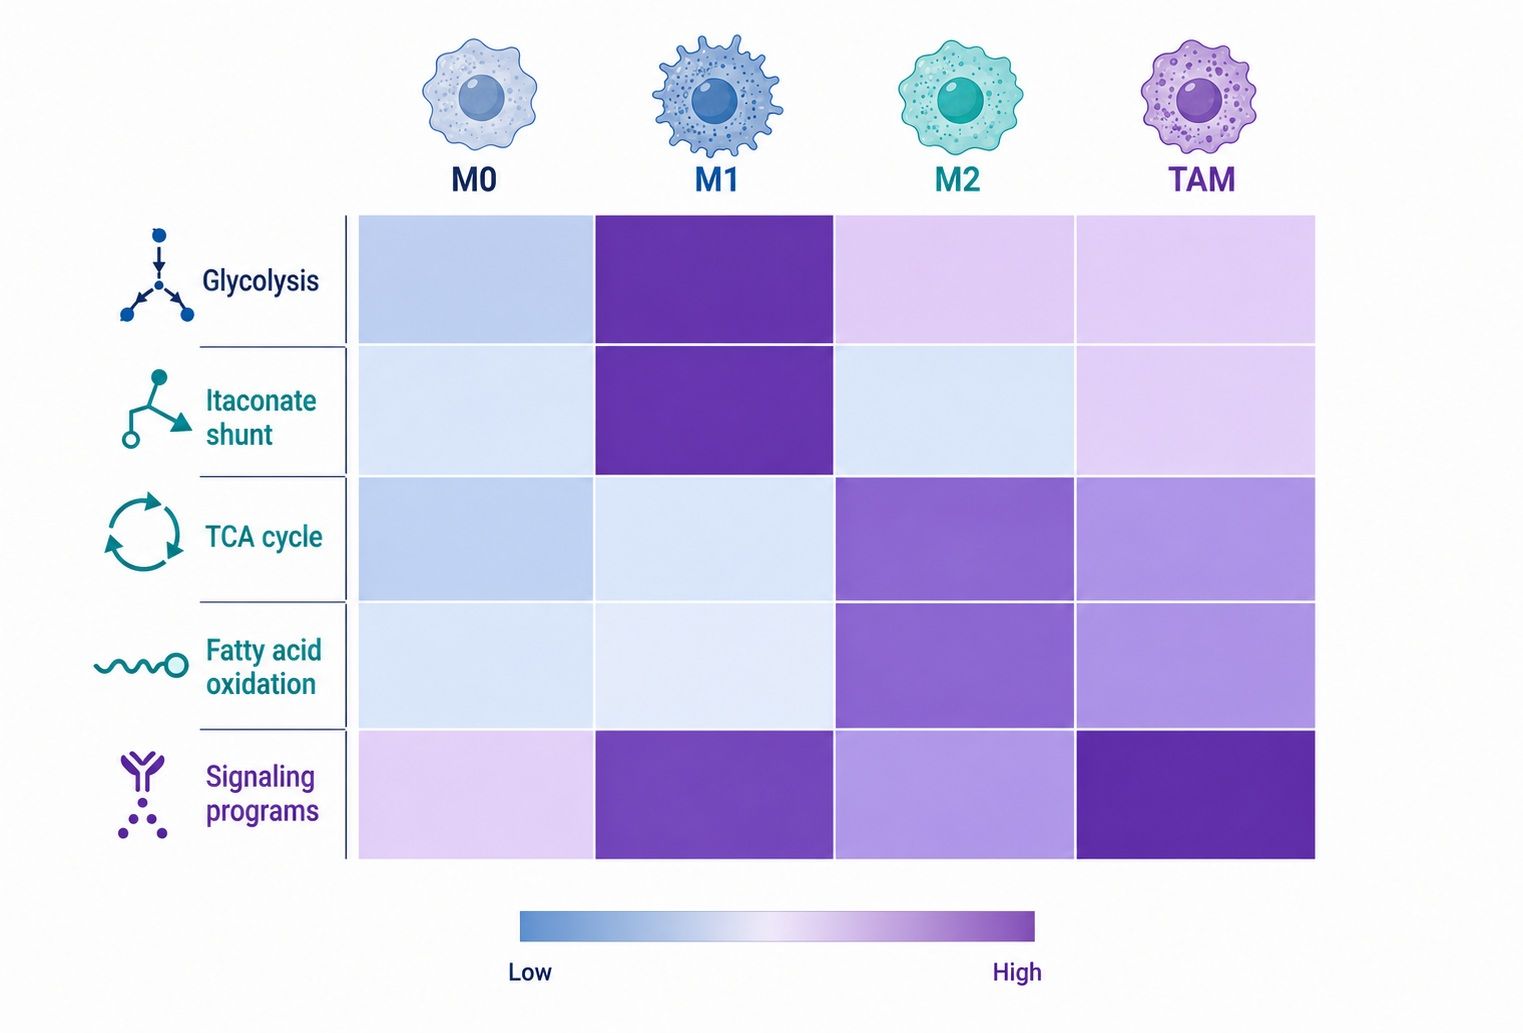
Hierarchical clustering identifies metabolic enzyme modules (itaconate shunt, FAO, OXPHOS) and surface receptor dynamics.
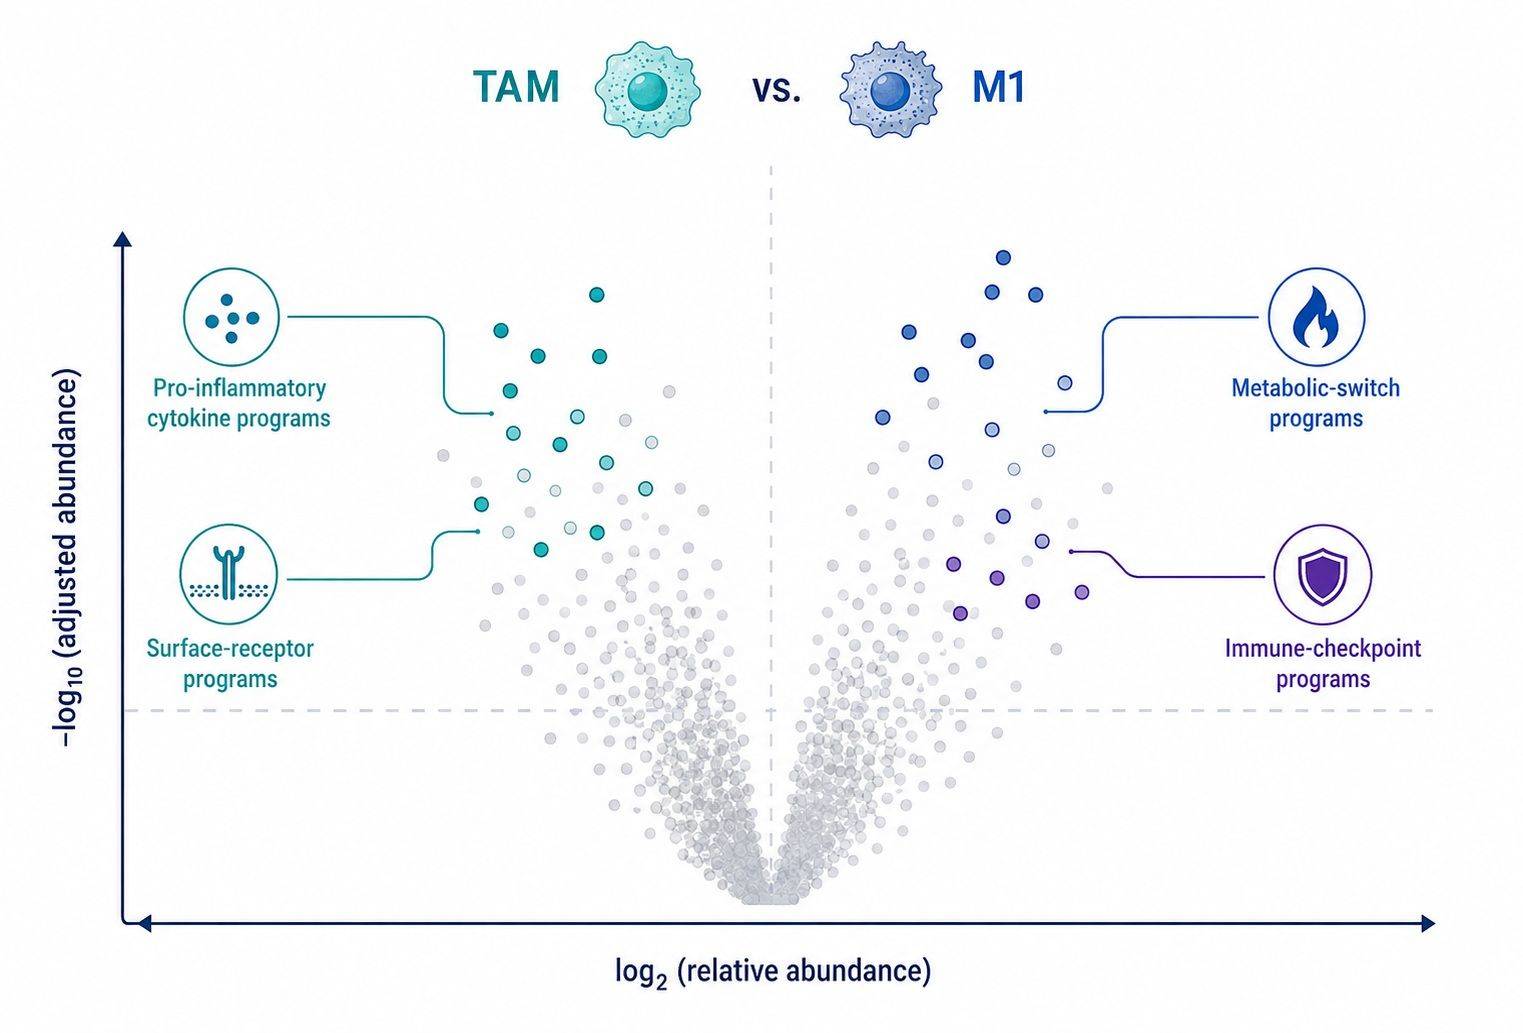
Pairwise contrasts (M1 vs. M0, M2 vs. M0, TAM vs. M1) prioritize significant effector cytokines, checkpoints, and metabolic enzymes.
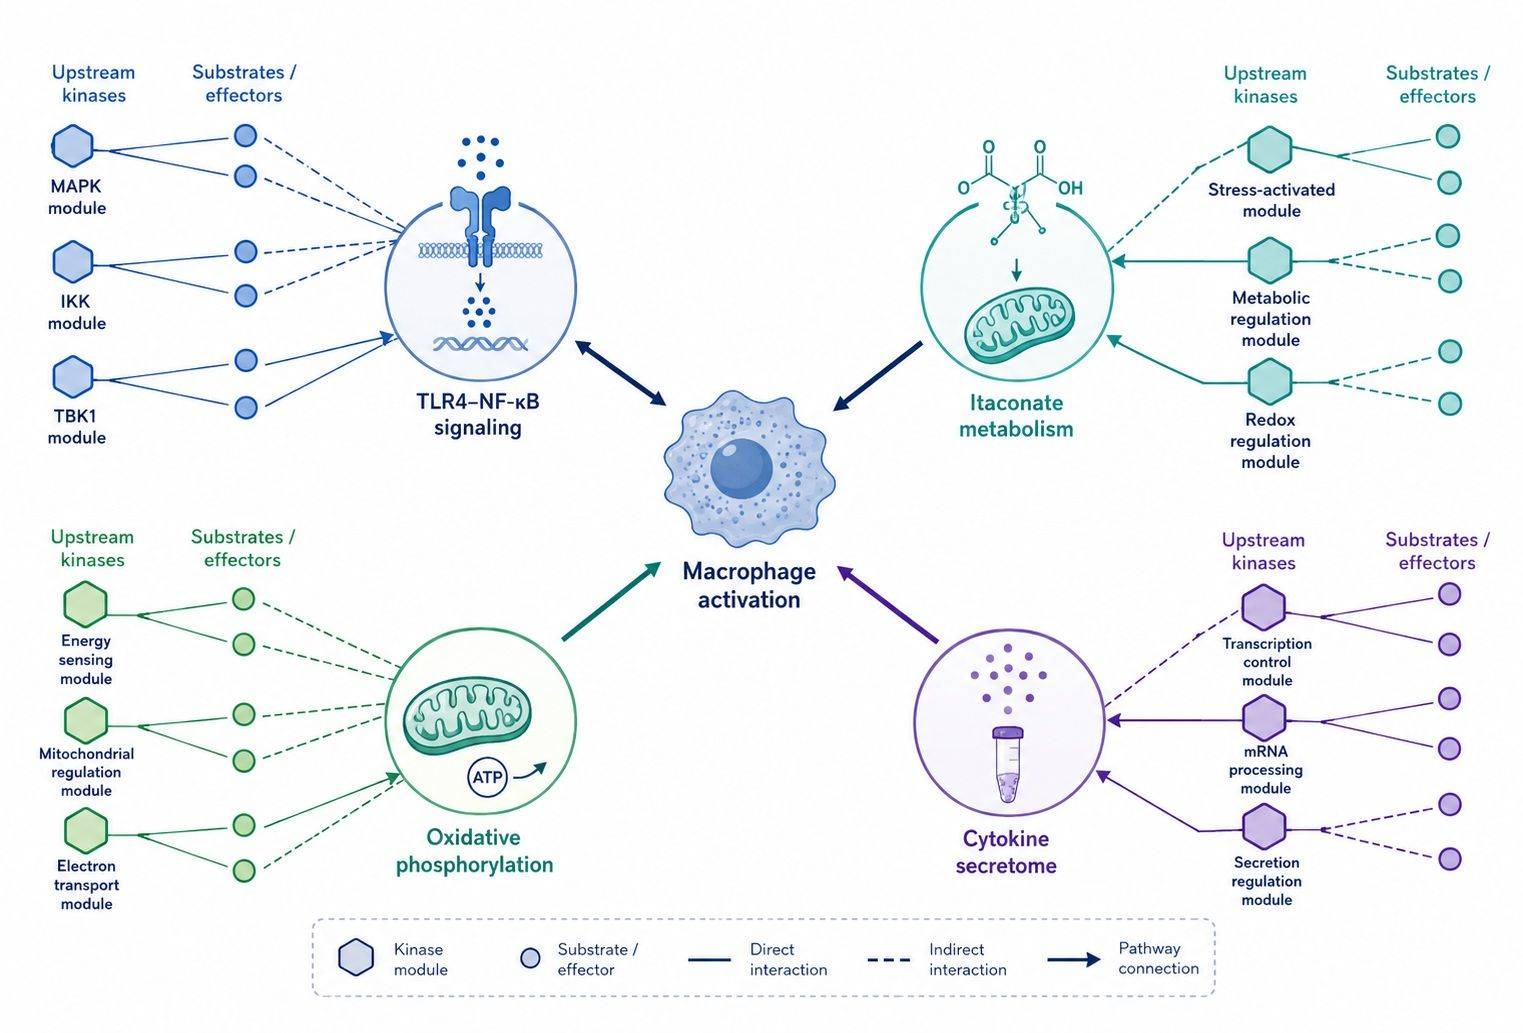
GSEA pathway enrichment and KSEA kinase networks provide deep mechanistic context for signaling cascades and metabolic shifts.

Quantitative Data Tables
- Normalized protein-, peptide-, and phosphosite-level intensity matrices with complete experimental and donor metadata.

Quality Assessment Summary
- Sample-level review, digestion completeness metrics, pooled QC CV distributions, and donor variance decomposition.

Comparative & Trajectory Analysis
- Pairwise statistical contrasts, Benjamini-Hochberg FDR correction, and M1 vs. M2 polarization trajectory scorecards.

Pathway & Kinase Networks
- Gene Ontology (GO), KEGG, and Reactome GSEA enrichment, plus KSEA kinase-substrate network mapping.

Bioinformatics & Reporting
- Comprehensive final project report with publication-ready figures and prioritized targeted PRM validation candidate shortlists.