
Why Transcriptomics Fails in Low-Oxygen Biology
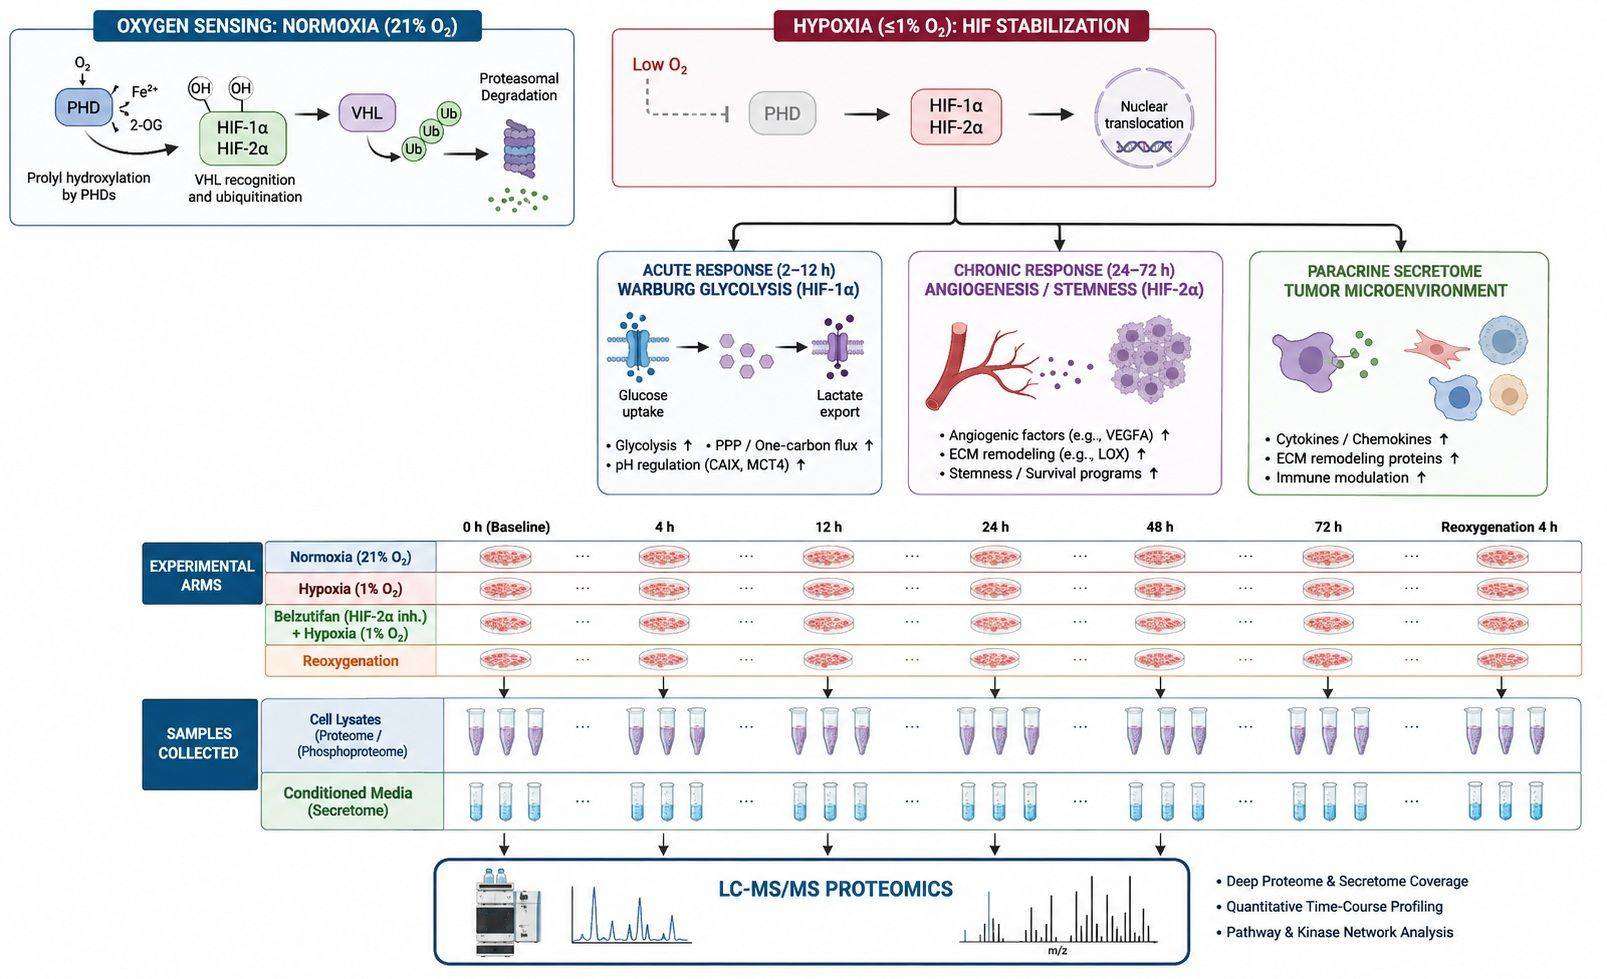
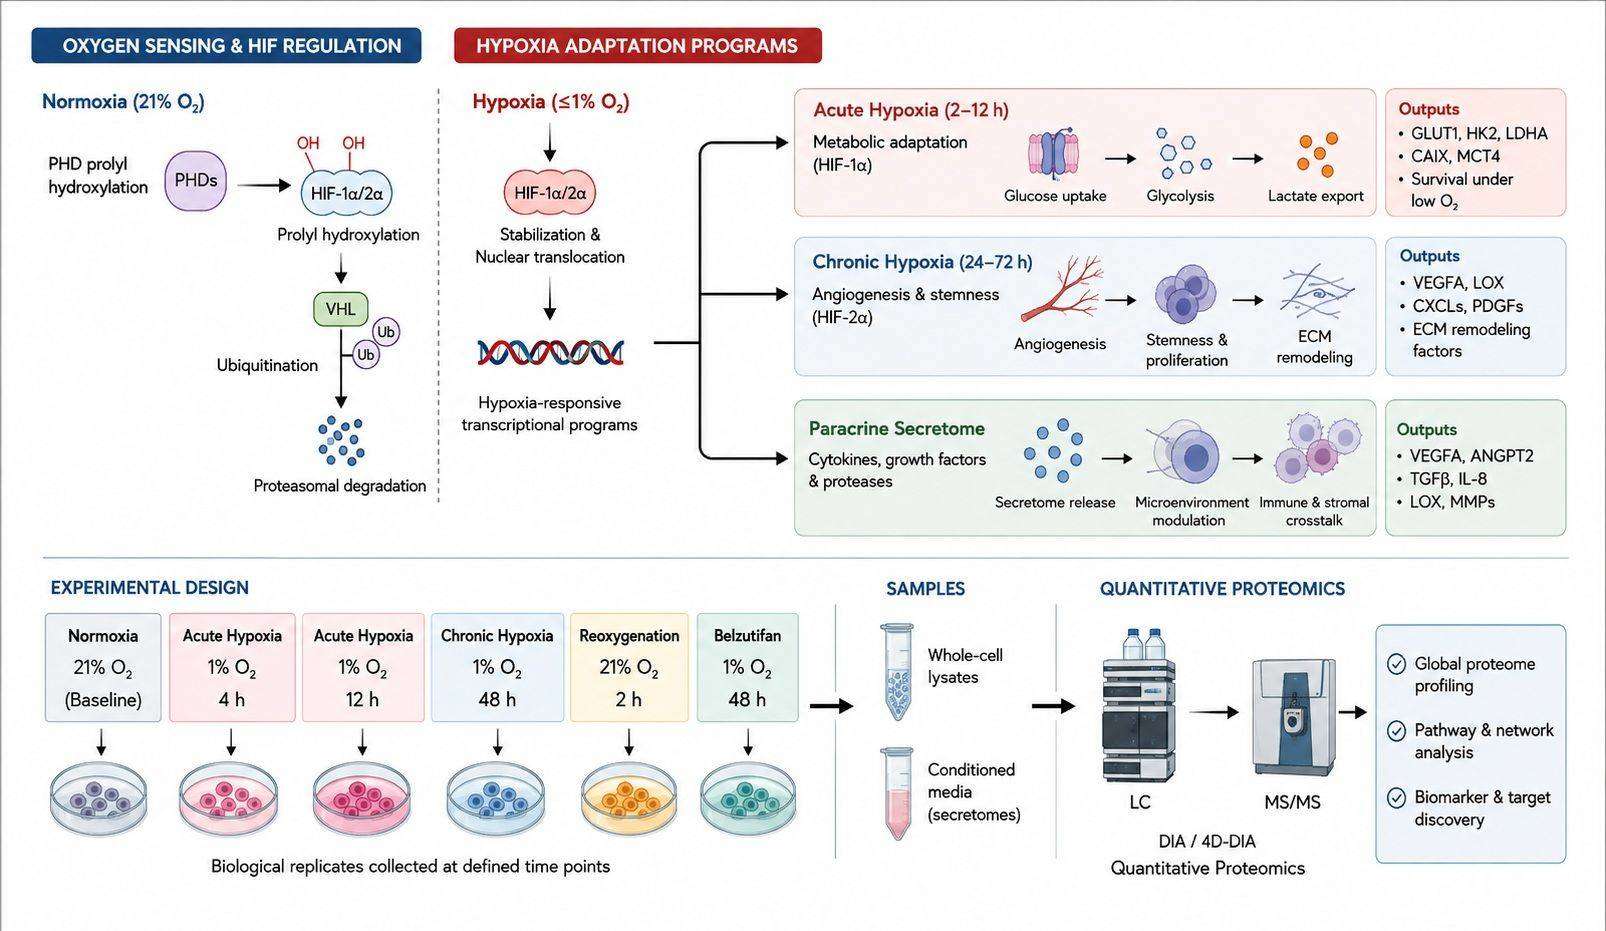
Under physiological normoxia (~21% in vitro, 3–7% in vivo physioxia), prolyl hydroxylases (PHD1–3) continuously hydroxylate HIF-1α and HIF-2α, marking them for rapid ubiquitination by the pVHL E3 ligase complex and proteasomal degradation within minutes. When oxygen tension drops below 1% O2, PHD activity ceases, allowing HIF-α subunits to stabilize, dimerize with HIF-1β (ARNT), and drive transcription.
However, hypoxia simultaneously triggers the integrated stress response—inducing PERK-mediated eIF2α phosphorylation and 4E-BP1/mTORC1 suppression—which shuts down global cap-dependent translation by 70–80%. Consequently, hundreds of transcribed hypoxia-induced mRNAs remain untranslated or sequestered in stress granules, while critical hypoxia effectors (e.g., VEGFA, GLUT1) are translated via cap-independent IRES or uORF mechanisms. mRNA transcript abundance is therefore fundamentally uncoupled from functional protein output during hypoxia.
Quantitative LC-MS/MS proteomics directly quantifies actual steady-state protein levels, active metabolic enzyme complexes, post-translational modifications, and secretomes, providing the ground-truth evidence required for rigorous hypoxia research.
Content Guide
- Physical vs. Chemical Hypoxia
- HIF-1α to HIF-2α Handover
- Research Scenarios & Designs
- Anti-Reoxygenation SOP
- Analytical & MS Strategies
- Sample Requirements
- Deliverables & Data Outputs
Methodological Integrity: Physical O2 Control vs. Chemical Mimetics
Many published hypoxia studies rely on chemical mimetics (CoCl2, DMOG, DFO, Roxadustat) because they are convenient. However, chemical stabilizers inhibit PHDs by competing with 2-oxoglutarate (2-OG) or displacing catalytic Fe2+. This non-specifically inhibits dozens of other 2-OG-dependent dioxygenases—including JmjC-domain histone lysine demethylases (KDMs) and TET DNA methylases—introducing sweeping epigenetic artifacts that do not occur in physiological hypoxia.
| Experimental Modality | Mechanism of HIF Stabilization | Analytical Off-Target Risks | Best Used For |
|---|---|---|---|
| Physical Hypoxia Chamber (0.1%–1.0% O2 Controlled) |
Direct oxygen substrate deprivation of PHD1–3 and FIH-1 enzymes. | None; reflects authentic physiological and pathological hypoxia. | Gold-standard mechanistic studies, in vivo translation, and drug response profiling. |
| CoCl2 (Cobalt Chloride) (100–300 μM) |
Displaces active-site Fe2+ and generates reactive oxygen species. | Broad heavy metal toxicity, non-specific lipid oxidation, and KDM inhibition. | High-throughput in vitro pre-screening before physical validation. |
| DMOG / Roxadustat (2-OG Competitors) |
Competitive inhibition of 2-oxoglutarate binding pocket in PHDs. | Broadly inhibits KDMs (KDM2–6) and TET1–3, altering global histone methylation. | Targeted prolyl hydroxylase inhibitor evaluation and erythropoiesis research. |
| DFO (Deferoxamine) (Iron Chelator, 100 μM) |
Depletes intracellular labile Fe2+ required for PHD cofactor function. | Severe iron depletion, mitochondrial complex disruption, and cell cycle arrest. | Dissecting iron-dependent regulatory nodes versus oxygen-dependent pathways. |
The HIF-1α to HIF-2α Temporal Handover and Metabolic Rewiring
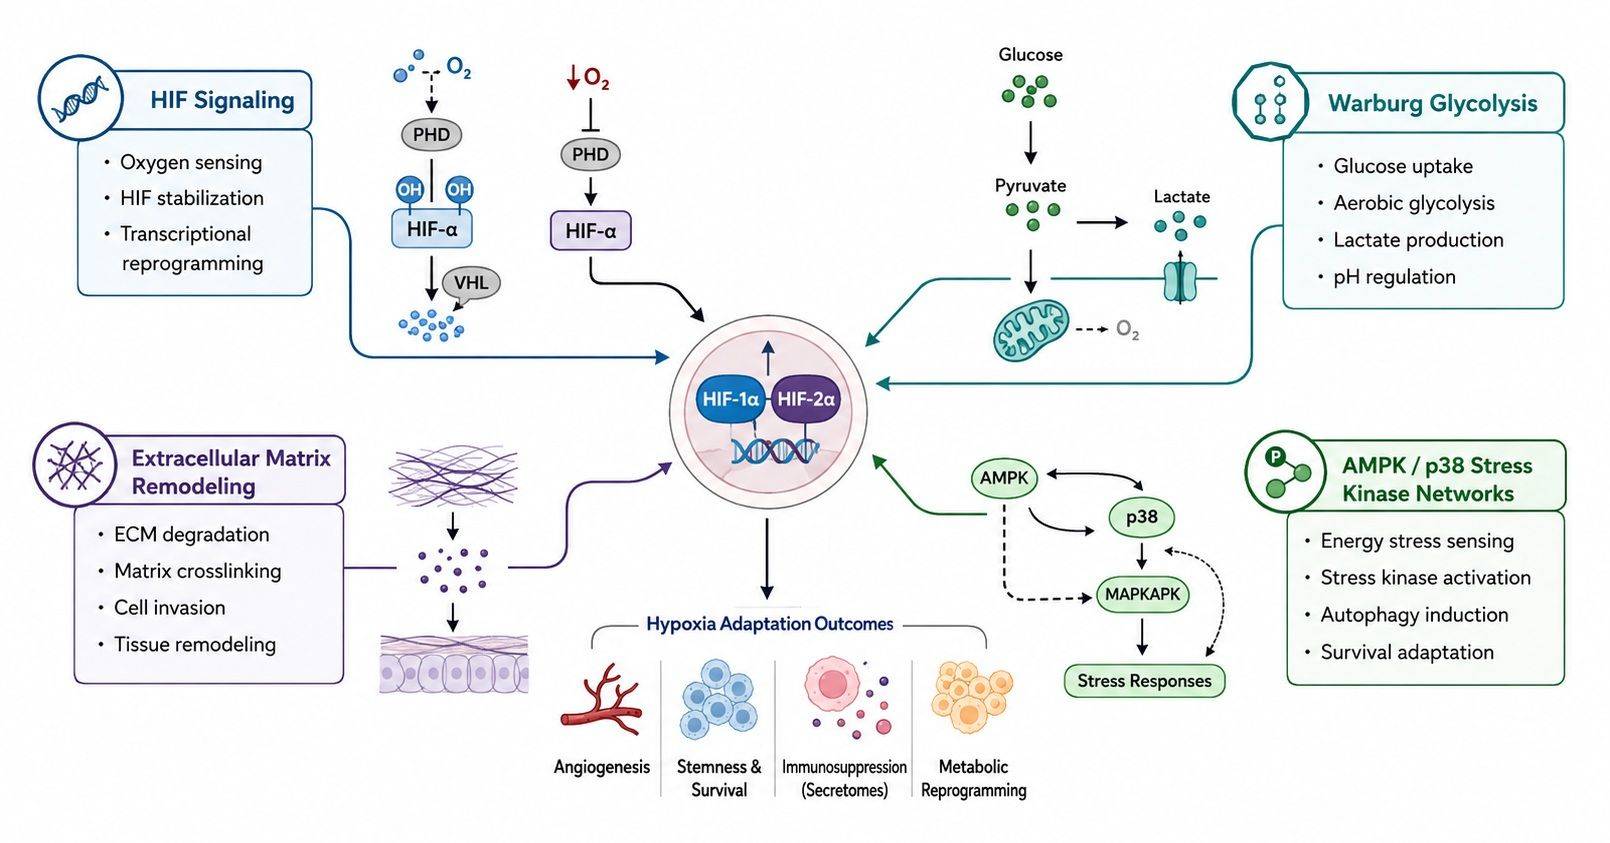
Cellular adaptation to hypoxia is not a static state, but a coordinated four-phase temporal program. Our time-course proteomics platform maps each phase with dedicated quantitative readouts:

Phase 1: Acute Oxygen Sensing (0.5–2 h)
Immediate PHD/FIH inhibition and kinase cascades. Upregulation of AMPK phosphorylation, PDK1-mediated inactivation of pyruvate dehydrogenase (PDH), and stress kinase signaling (PERK, p38 MAPK).

Phase 2: HIF-1α Glycolytic Switch (2–12 h)
HIF-1α peaks to drive the Warburg switch: GLUT1 (SLC2A1), HK2, PFKFB3, ALDOA, PGK1, ENO1, PKM2, LDHA, and extracellular acidification via CAIX, CAXII, and MCT4 (SLC16A3).

Phase 3: HIF-2α Chronic Adaptation (24–72 h)
HIF-2α (EPAS1) accumulates to drive sustained angiogenesis (VEGFA, ANGPTL4), erythropoietin (EPO), lipid droplet storage (PLIN2), cancer stemness (OCT4, SOX2, CXCR4), and ECM remodeling (LOX/LOXL2).

Phase 4: Reoxygenation Resolution (0.5–24 h)
Upon reoxygenation, rapid pVHL-dependent degradation of HIF-α subunits occurs alongside an oxidative burst, permitting quantification of reperfusion recovery and inflammatory infiltration.
Hypoxia Research Scenarios and Experimental Designs
| Research Scenario | Core Biological Question | Recommended Study Design & Readout |
|---|---|---|
| ccRCC & VHL Loss-of-Function | Evaluate constitutive HIF-2α oncogenic signaling and benchmark allosteric HIF-2α inhibitors (e.g., Belzutifan / MK-6482). | Factorial design: VHL-WT vs. VHL-KO ± Belzutifan dose-response; global DIA proteomics for target validation. |
| Tumor Core vs. Rim Gradients | Profile spatial metabolic adaptation and therapy resistance between necrotic hypoxic cores and vascularized tumor rims. | Laser-capture microdissected (LCM) tissue sections; high-sensitivity 4D-DIA (dia-PASeF) from 5×10⁴ cells. |
| Ischemia-Reperfusion (I/R) Models | Dissect acute ischemic protective adaptations from destructive oxidative reperfusion injury in stroke, myocardial infarction, or AKI. | Multi-arm time-course: Sham vs. Ischemia (Acute) vs. Reperfusion (0.5, 6, 24 h); paired phosphoproteomics + global DIA. |
| Hypoxic Secretome & Pre-Metastatic Niche | Identify paracrine angiogenic factors (VEGFA, ANGPTL4) and matrix cross-linkers (LOX, LOXL2, MMP2/9) priming metastatic niches. | Dual-layer profiling: whole-cell lysate + 12–24 h serum-free conditioned media secretome (3 kDa ultrafiltration). |
| HIF Degrader / PROTAC Discovery | Measure targeted degradation kinetics of HIF-1α or HIF-2α versus off-target proteome perturbations across time-courses. | Concentration- and time-dependent DIA profiling to determine DC50, Dmax, and proteome-wide selectivity. |
Pre-Analytical Anti-Reoxygenation & Quenching SOP
Because room-air oxygen rapidly reactivates prolyl hydroxylases (HIF-α t1/2 < 5 min), standard benchtop harvesting leads to severe artifactual HIF degradation. Creative Proteomics enforces strict anti-reoxygenation protocols:
- Rapid Cold Quenching (≤15 s): Monolayers are removed from the hypoxia chamber directly onto ice, culture media aspirated immediately, and cells washed with ice-cold PBS within 15 seconds to halt enzymatic activity.
- Direct On-Plate Denaturing Lysis: Cells are lysed directly on culture dishes using 5% SDS extraction buffer supplemented with protease, phosphatase (PhosSTOP, sodium orthovanadate), and deubiquitinase inhibitors to lock HIF-α in its native stabilized state.
- Hypoxia Workstation Glove-Box Option: For ultra-sensitive PTM and interactome studies, sample scraping, washing, and lysis can be performed entirely within an enclosed hypoxia glove-box workstation at matched O2 tension.
- Serum-Free Secretome Pulse: For secretome analysis, cells are conditioned in defined serum-free medium for 12–24 h prior to harvest, clarified at 2,000 × g, and concentrated via 3 kDa ultrafiltration to eliminate bovine serum albumin (BSA) interference.
Analytical & Mass Spectrometry Platform Selection Guide
Match your hypoxia sample type, cohort scale, and biological question with the optimal acquisition strategy and mass spectrometry platform.
| Study Objective & Scenario | Recommended Strategy | Primary MS Platform | Technical Rationale & Deliverables |
|---|---|---|---|
| Global Hypoxic Adaptation & Glycolysis (In Vitro Cancer Models / 2D & 3D Cultures) |
Discovery DIA Quantitative Proteomics | Orbitrap Astral / Exploris 480 / timsTOF Pro 2 | Single-shot depth (>6,500–8,500+ proteins), CV < 15%, deep coverage of Warburg glycolytic enzymes, CAIX, and lipid droplet factors. |
| Microscale & Spatially Resolved Samples (Microdissected Tumor Cores / Needle Biopsies) |
High-Sensitivity 4D-DIA (dia-PASeF) | timsTOF Pro 2 / timsTOF Ultra | TIMS ion mobility maximizes ion utilization and peak capacity, enabling deep quantification from as few as 5×10⁴ to 2×10⁵ cells (500 ng – 2 μg protein). |
| Acute Stress Kinase & Signaling Kinetics (0.5–6 h Time-Course / Reoxygenation) |
4D Phosphoproteomics (Ti-IMAC / Fe-NTA Enrichment) |
timsTOF Pro 2 (TIMS-DIA) / Orbitrap Exploris 480 | Resolves isomeric phosphopeptides, localizes regulatory phosphosites (>15,000–25,000+ sites), and drives KSEA stress kinase activity inference (AMPK/PERK/MAPK). |
| Paracrine Angiogenesis & ECM Remodeling (Serum-Free Conditioned Media Supernatants) |
Hypoxic Secretome DIA Profiling | Orbitrap Exploris 480 / timsTOF Pro 2 | High dynamic range resolves low-abundance secreted angiogenic factors (VEGFA, ANGPTL4), LOX/LOXL2, and MMPs following 3 kDa ultrafiltration cleanup. |
| HIF Inhibitor & Target Validation Panels (Belzutifan / PROTACs / Screening Cohorts) |
Targeted PRM / 4D-PRM Panels | Orbitrap PRM / Triple Quadrupole (TSQ Altis / QTRAP 6500+) | Absolute or high-precision relative quantification of curated 20–60 hypoxia marker panels with high throughput and zero missing values across cohorts. |
Sample Submission Requirements
| Sample Category | Recommended Input | Minimum Feasibility | Harvesting & Shipping Guidelines |
|---|---|---|---|
| Standard Cell Pellets (Global DIA) | 1–5 × 10⁶ cells (20–50 μg protein) |
2 × 10⁵ cells (≥2 μg protein) |
Wash 2× with ice-cold PBS (≤15 s); aspirate completely; flash-freeze pellet in liquid N2. Ship on dry ice (-80°C). |
| Fresh-Frozen Tissues (Tumor / I/R) | 20–50 mg wet weight | 5 mg wet weight | Dissect rapidly (≤30 s post-euthanasia); snap-freeze immediately in liquid N2. Ship on dry ice (-80°C). |
| Microscale / Sorted Cells (FACS / LCM) | 1–5 × 10⁵ sorted cells (1–5 μg protein) |
5 × 10⁴ cells (~500 ng protein) |
Sort directly into low-binding tubes with lysis buffer or flash-freeze dry pellet in liquid N2. Ship on dry ice. |
| Hypoxia Phosphoproteomics | 5–10 × 10⁶ cells (100–200 μg protein) |
50 μg total protein | Immediate on-plate lysis in buffer with PhosSTOP & 1 mM sodium orthovanadate; flash-freeze. Ship on dry ice. |
| Conditioned Media (Secretome) | 2–5 mL conditioned medium per replicate | 1 mL medium | Serum-free conditioning (12–24 h); clarify at 2,000 × g (10 min); flash-freeze supernatant in cryovials. Ship on dry ice. |
| Pre-Extracted Lysates | 20–50 μL at 1–2 mg/mL | 5 μg total protein | SDS/RapiGest buffer; BCA quantified; document lysis buffer composition. Ship on dry ice. |
Deliverables and Decision-Ready Outputs
Quantitative data tables, quality documentation, and biological interpretation
Sample-level PCA/UMAP assesses whether quantitative profiles organize according to normoxic, acute hypoxic, and chronic hypoxic states.
Hierarchical clustering identifies coordinated enzyme modules across glycolysis, pH regulation, lipid droplets, and angiogenesis.
Pairwise contrasts (Hypoxia vs. Normoxia, Hypoxia ± Belzutifan) prioritize significant hypoxia biomarkers and therapeutic targets.
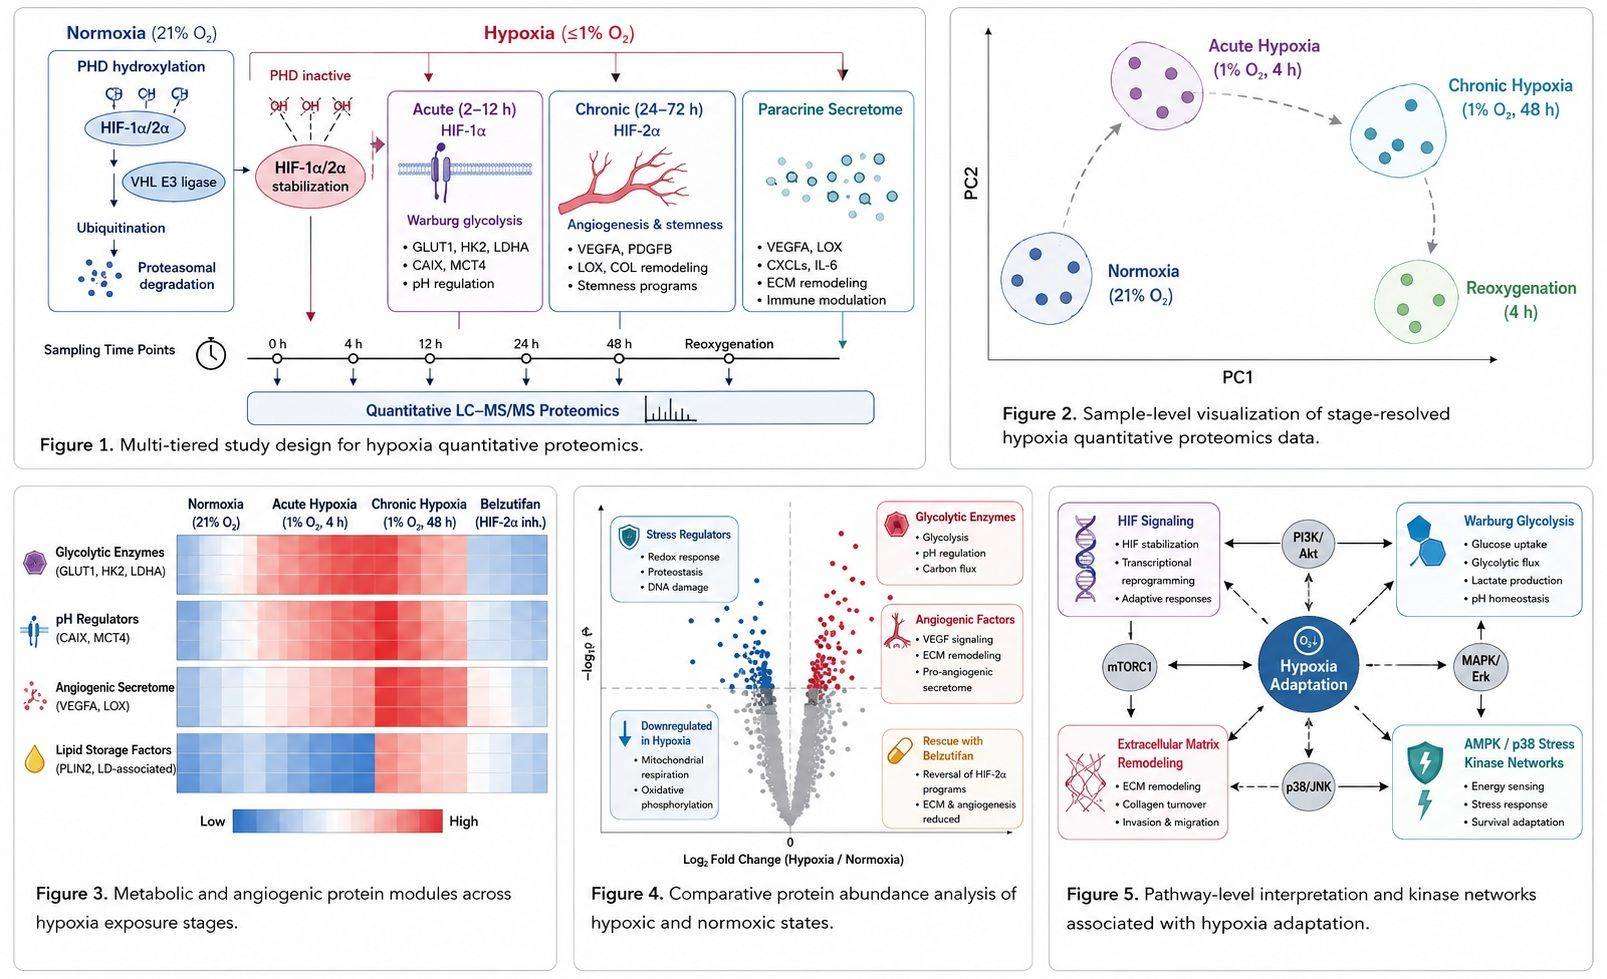
GSEA pathway enrichment and KSEA kinase networks provide deep mechanistic context for HIF signaling cascades and metabolic shifts.

Quantitative Data Tables
- Normalized protein-, peptide-, and phosphosite-level intensity matrices with complete experimental annotations.

Quality Assessment Summary
- Sample-level review, digestion completeness metrics, pooled QC CV distributions, and batch reproducibility reports.

Comparative & Temporal Analysis
- Pairwise statistical contrasts, Benjamini-Hochberg FDR correction, and HIF-1α vs. HIF-2α temporal trajectory scorecards.

Pathway & Kinase Networks
- Gene Ontology (GO), KEGG, and Reactome GSEA enrichment, plus KSEA stress kinase-substrate network mapping.

Bioinformatics & Reporting
- Comprehensive final project report with publication-ready figures and prioritized targeted PRM validation candidate shortlists.