
What Is Cellular Senescence and SASP Proteomics?
Definition & Core Capability: Cellular senescence and SASP proteomics is the high-resolution mass spectrometry-based identification and quantification of intracellular senescence effectors (such as p16INK4a, p21CIP1, Lamin B1 degradation, and anti-apoptotic BCL-2 proteins) and the comprehensive profiling of extracellular secreted bio-active molecules (SASP cytokines, chemokines, matrix metalloproteinases, shedding receptors, and extracellular vesicles). It bridges the gap between static cell-cycle arrest markers and dynamic, non-cell-autonomous paracrine tissue remodeling.
While senescent cells undergo permanent cell-cycle arrest via p53/p21CIP1 (CDKN1A) and p16INK4a (CDKN2A) tumor suppressor pathways, they remain metabolically hyperactive. Driven by persistent DNA damage response (DDR) signaling, cytoplasmic chromatin fragments (CCFs), and cGAS-STING/NF-κB activation, senescent cells secrete a complex, pro-inflammatory secretome termed the Senescence-Associated Secretory Phenotype (SASP).
Traditional assays—such as SA-β-gal staining or 20-plex Luminex/MSD bead arrays—capture only a narrow, pre-selected subset of inflammatory cytokines (e.g., IL-6, IL-8). However, unbiased proteomics studies (including the landmark SASP Atlas) prove that the genuine SASP comprises hundreds of distinct proteins that shift dynamically based on cell type, tissue microenvironment, and the initiating senescence stimulus. High-resolution DIA quantitative proteomics is the only unbiased methodology capable of simultaneously resolving intracellular senescence state markers and secretome flux rates.
Content Guide
- SASP Multi-Layer Modules
- Senescence Triggers & Models
- Senolytic vs Senomorphic MoA
- Serum-Free Conditioning SOP
- Step-by-Step Workflow
- Platform Decision Guide
- Sample Submission Guidelines
- Deliverables & Data Outputs
The Multi-Layer Architecture of the Senescent Cell Proteome
Our dual-layer proteomics approach captures both the intracellular arrest machinery and the multi-component extracellular secretome:

1. Intracellular Senescence Effectors
Direct quantification of cell-cycle arrest regulators (p16INK4a, p21CIP1), loss of nuclear lamina integrity (Lamin B1 / LMNB1 degradation), nuclear-to-cytoplasmic HMGB1 translocation, metabolic rewiring (GLS1 glutaminase), and pro-survival anti-apoptotic proteins (BCL-2, BCL-xL, BCL-W, MCL-1).

2. Soluble SASP Cytokines & Chemokines
Broad profiling of pro-inflammatory paracrine factors: IL-6, CXCL8 (IL-8), CCL2 (MCP-1), CXCL1, CXCL2, IL-1α (membrane-bound master regulator), and macrophage migration inhibitory factor (MIF) driving secondary bystander senescence and chronic tissue inflammation.

3. Matrix Metalloproteinases & ECM Regulators
Quantitative assessment of extracellular matrix remodeling enzymes (MMP1, MMP3, MMP9, MMP10, MMP12), collagen prolyl hydroxylases (P4HA1/2), and tissue inhibitors (TIMP1, TIMP2) promoting tissue fibrosis and pre-metastatic niche priming.

4. Growth Factors, Regulators & Shed Receptors
Comprehensive coverage of insulin-like growth factor binding proteins (IGFBP2, IGFBP3, IGFBP4, IGFBP7), growth differentiation factor 15 (GDF15), TGF-β1, shed receptor ectodomains (sTNF-R1/2, sIL-6R, sICAM-1, sEGFR), and extracellular vesicle (EV-SASP) tetraspanins (CD63, CD81).
Senescence Triggers, Biological Models, and Molecular Signatures
SASP expression profiles differ fundamentally across distinct senescence induction modalities:
| Induction Trigger | Representative Model Systems | Core Signaling Pathway | Characteristic SASP & Proteomic Profile |
|---|---|---|---|
| Replicative Senescence (RS) | Primary human fibroblasts (WI-38, IMR-90), endothelial cells, MSCs (extended passage). | Telomere attrition, chronic DNA damage response (ATM/ATR → p53 → p21). | Lamin B1 loss, nuclear HMGB1 depletion, robust canonical SASP (IL-6, CXCL8, MMP1, IGFBP3/7). |
| Oncogene-Induced Senescence (OIS) | Primary cells expressing HRASG12V, BRAFV600E, or PTEN loss. | Replication fork collapse, hyperactive MAPK signaling, p16INK4a/RB tumor suppressor axis. | Hyper-inflammatory SASP: high CXCL1, CCL2, IL-1α, and elevated extracellular matrix proteases. |
| Therapy-Induced Senescence (TIS) | Cancer cell lines & stromal fibroblasts treated with Doxorubicin, Cisplatin, or Palbociclib. | CDK4/6 inhibition or double-strand DNA breaks, NF-κB and cGAS-STING activation. | High dependence on BCL-2/BCL-xL survival pathways, marked MMP3/9 secretion, elevated GDF15. |
| Mitochondrial Dysfunction (MiDAS) | Mitochondrial DNA depletion (rho-0), complex I/III inhibition, or POLG mutations. | AMPK activation, decreased NAD+/NADH ratio, p53 activation without IL-1α arm. | Distinct non-inflammatory SASP: elevated IL-10, IL-27, and TNF-α, with low IL-6 and IL-1α. |
| Paracrine / Bystander Senescence | Naïve cells cultured in senescent conditioned media or transwell co-cultures. | SASP receptor binding (IL-6R, CXCR2, TNFR) driving secondary ROS and DDR. | Secondary induction of p21, amplification of paracrine secretome, and loss of proliferative markers. |
Senotherapeutic Drug Profiling: Senolytics vs. Senomorphics
Our platform quantitatively dissects the mechanism of action, potency, and selectivity of therapeutic candidates targeting senescence:
| Senotherapy Class | Representative Compounds | Primary Mechanism of Action | Proteomic Evaluation Readout |
|---|---|---|---|
| Senolytics (Selective Elimination) |
Navitoclax (ABT-263), ABT-737, Dasatinib + Quercetin (D+Q), Fisetin, UBX0101, CB-839 (GLS1i) | Inhibition of senescent cell anti-apoptotic pathways (SCAPs; BCL-2/BCL-xL/BCL-W), triggering selective apoptosis in senescent cells. | Selective reduction in senescent cell proteome biomass, induction of cleaved caspases, and global shutdown of secretome output. |
| Senomorphics (SASP Suppression) |
Rapamycin (mTORi), Metformin, Ruxolitinib (JAKi), BIRB 796 (p38 MAPKi), QNZ (NF-κBi) | Inhibition of transcription factors (NF-κB, C/EBPβ) and translational pathways driving SASP production without killing senescent cells. | Selective downregulation of secreted cytokines, chemokines, and MMPs in conditioned media while maintaining cell viability. |
| Senoisolation & Tissue Profiling | Immuno-isolated or FACS-sorted senescent subsets from in vivo animal models (p16-reporter, C12FDG) | Evaluation of senolytic efficacy in complex, heterogeneous aging and fibrotic tissues. | Microscale 4D-DIA (dia-PASeF) quantifying proteome shifts from as few as 5×10⁴ sorted senescent cells from in vivo cohorts. |
Pre-Analytical Protocol: Serum-Free Conditioning & Biomass Normalization
Bovine serum albumin (BSA) in standard culture media (~30–50 mg/mL) is 1,000× more abundant than endogenous secreted SASP factors (~10–100 μg/mL), completely suppressing mass spectrometry ionization. Furthermore, senescent cells exhibit significant cellular hypertrophy (2–4× larger protein biomass per cell). Creative Proteomics enforces a standardized secretome collection and mathematical normalization workflow:

- Triple PBS Washing: Senescent monolayers and control cells are washed 3× with warm PBS to eliminate residual bovine serum proteins.
- Defined Serum-Free Pulse (12–24 h): Cells are incubated in defined serum-free, phenol-red-free basal media for 12–24 hours (rigorously validated to maintain >95% cell viability without starvation stress).
- Two-Step Centrifugation Clarification: Media is centrifuged at 300 × g (5 min) to remove floating cells, followed by 2,000 × g (10 min) to clear apoptotic debris.
- 3 kDa Ultrafiltration & Normalization: Supernatants are concentrated using 3 kDa MWCO ultrafiltration filters. Total protein is BCA-quantified and normalized to both viable cell counts (secretome output per 106 cells) and intracellular protein biomass to eliminate hypertrophy bias.
- Optional EV-SASP Fractionation: Differential ultracentrifugation (100,000 × g) or size-exclusion chromatography (SEC) separates soluble SASP proteins from exosomal / extracellular vesicle cargo (CD63, CD81).
Step-by-Step Cellular Senescence & SASP Proteomics Workflow
At Creative Proteomics, our senescence proteomics workflow ensures reproducible recovery, deep secretome coverage, and biological relevance at every phase.
Define senescence triggers (RS, OIS, TIS, MiDAS), baseline proliferative controls, and senotherapeutic treatment arms (Senolytics vs. Senomorphics).
Execute 3× warm PBS washing and 12–24 h serum-free pulse. Harvest matched cell lysates and conditioned media supernatants in parallel.
Supernatants are concentrated via 3 kDa MWCO ultrafiltration. Automated S-Trap / SP3 processing delivers trypsin/Lys-C enzymatic digestion.
Single-shot DIA or 4D-DIA (dia-PASeF on timsTOF Pro 2) and Orbitrap Astral platforms with interleaved pooled QC injections.
Secretome protein intensities are normalized against viable cell counts or lysate protein biomass. Statistical contrasts apply limma FDR ≤ 0.05.
Bioinformatic mapping against the reference SASP Atlas, GSEA pathway enrichment, KSEA kinase activity networks, and PRM validation shortlists.
- Albumin-free secretome workflow: strict 12–24 h conditioning eliminates BSA mass spec interference
- Dual intracellular + secretome profiling: track cell-cycle arrest (LMNB1, p16/p21) alongside paracrine SASP flux
- Cell hypertrophy correction: dual normalization by cell count and total biomass prevents quantification bias
- Senotherapy mechanism deconvolution: clear differentiation of senolytics (clearance) vs. senomorphics (SASP blockade)
- Direct SASP Atlas benchmarking: match experimental profiles against curated human aging biomarker databases
Cellular Senescence & SASP Proteomics Analytical Platform Decision Guide
Match your senescence model, sample type, and biological question with the optimal acquisition strategy and mass spectrometry platform.
| Study Objective & Scenario | Recommended Strategy | Primary MS Platform | Technical Rationale & Deliverables |
|---|---|---|---|
| Unbiased SASP Secretome Discovery (Conditioned Media / Fibroblasts / TIS Models) |
Discovery DIA Secretome Proteomics | Orbitrap Astral / Exploris 480 / timsTOF Pro 2 | Single-shot depth (>1,500–2,500+ secreted proteins), CV < 15%, deep coverage of low-abundance cytokines, MMPs, IGFBPs, and shed receptors. |
| Dual Intracellular Biomass & Secretome Coupling (Matched Cell Pellets + Conditioned Media) |
Paired Whole-Cell & Secretome DIA Profiling | Orbitrap Exploris 480 / timsTOF Pro 2 | Simultaneous quantification of >6,500+ intracellular proteins (LMNB1, p16/p21, BCL-2) and secretome output, correlating cellular state with paracrine flux. |
| Senolytic Clearance & Apoptotic Kinetics (Drug Screening / Navitoclax, D+Q Dose-Response) |
High-Throughput 4D-DIA Proteomics | timsTOF Pro 2 (dia-PASeF) | Rapid short-gradient runs with high quantitative precision evaluating dose-dependent senescent cell depletion and SCAP pathway targeting. |
| Senescence Stress Kinase Activation (p38 MAPK, NF-κB, cGAS-STING, DDR Kinetics) |
4D Phosphoproteomics (Ti-IMAC / Fe-NTA Enrichment) |
timsTOF Pro 2 (TIMS-DIA) / Orbitrap Exploris 480 | Captures >15,000–25,000+ phosphosites; Kinase-Substrate Enrichment Analysis (KSEA) maps upstream kinase networks regulating SASP transcription. |
| Targeted SASP Biomarker Validation Panels (Clinical Cohorts / Preclinical Plasma Testing) |
Targeted PRM / 4D-PRM Panels | Orbitrap PRM / Triple Quadrupole (TSQ Altis / QTRAP 6500+) | Absolute or relative quantification of curated 30–60 SASP biomarker panels across longitudinal drug treatment cohorts with zero missing values. |
Sample Submission Guidelines
| Sample Category | Recommended Input | Minimum Feasibility | Harvesting & Shipping Guidelines |
|---|---|---|---|
| Conditioned Media (SASP Secretome) | 2–5 mL conditioned medium per replicate | 1 mL medium | Serum-free pulse (12–24 h); clarify at 2,000 × g (10 min); flash-freeze supernatant in cryovials. Ship on dry ice (-80°C). |
| Matched Senescent Cell Pellets | 1–5 × 10⁶ cells (20–50 μg protein) |
2 × 10⁵ cells (≥2 μg protein) |
Wash 2× with cold PBS; aspirate completely; flash-freeze dry pellet in liquid N2. Ship on dry ice. |
| Senescent Tissues / In Vivo Biopsies | 20–50 mg wet weight | 5 mg wet weight | Dissect rapidly; snap-freeze immediately in liquid N2; avoid repeated freeze-thaw cycles. Ship on dry ice. |
| Extracellular Vesicles (EV-SASP) | 10–20 mL conditioned medium or isolated EV pellet | 5 mL medium | Condition in EV-depleted or serum-free medium; clarify; ship on dry ice. |
| Senescence Phosphoproteomics | 5–10 × 10⁶ cells (100–200 μg protein) |
50 μg total protein | Lyse in buffer with PhosSTOP and 1 mM sodium orthovanadate; flash-freeze. Ship on dry ice. |
Deliverables and Decision-Ready Outputs
Quantitative secretome matrices, SASP Atlas benchmarking, and pathway scorecards
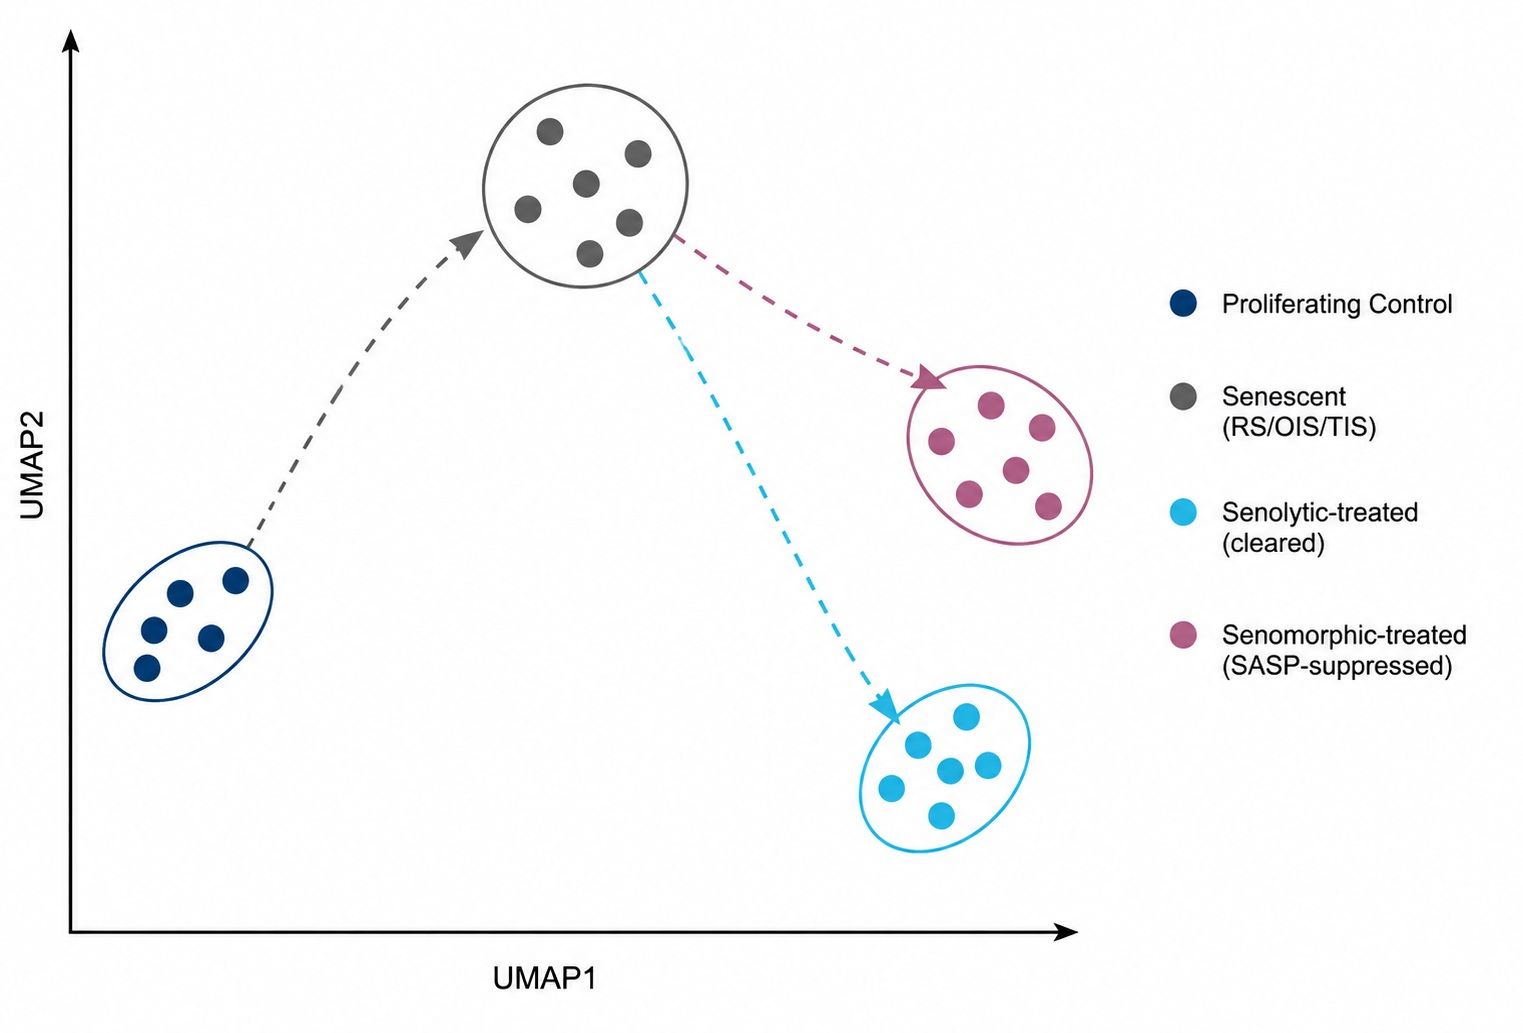
Sample-level PCA/UMAP evaluates global clustering across control, senescent, and senolytic/senomorphic treated cohorts.
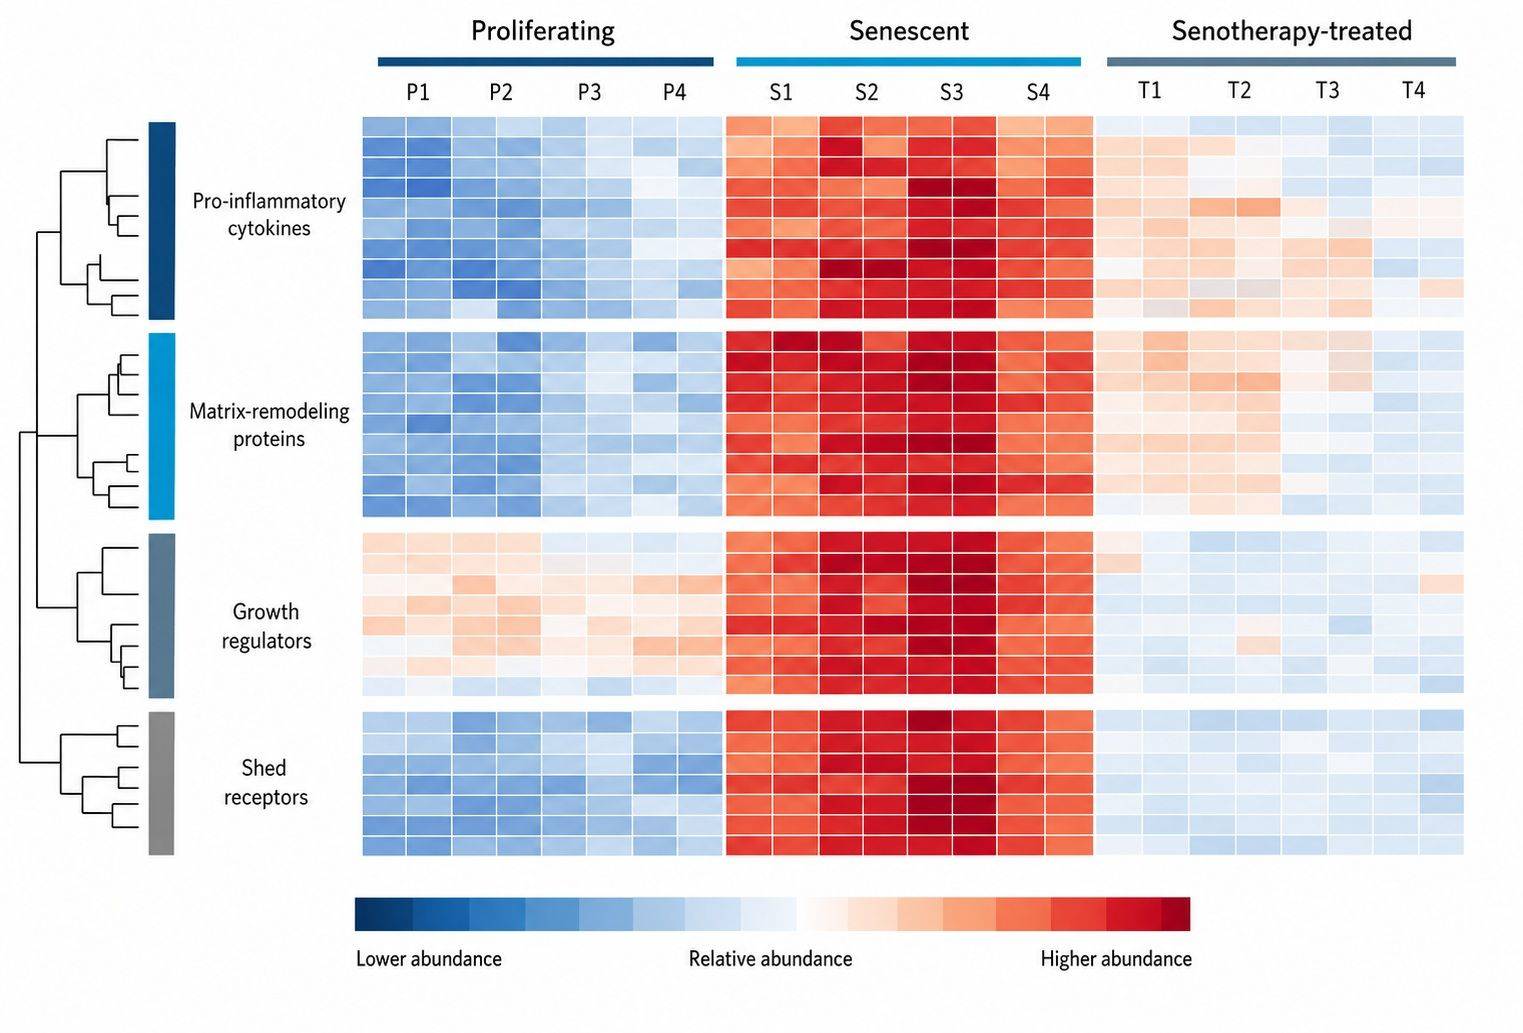
Hierarchical clustering resolves distinct SASP modules (inflammatory cytokines, MMPs, IGFBPs) across induction models.
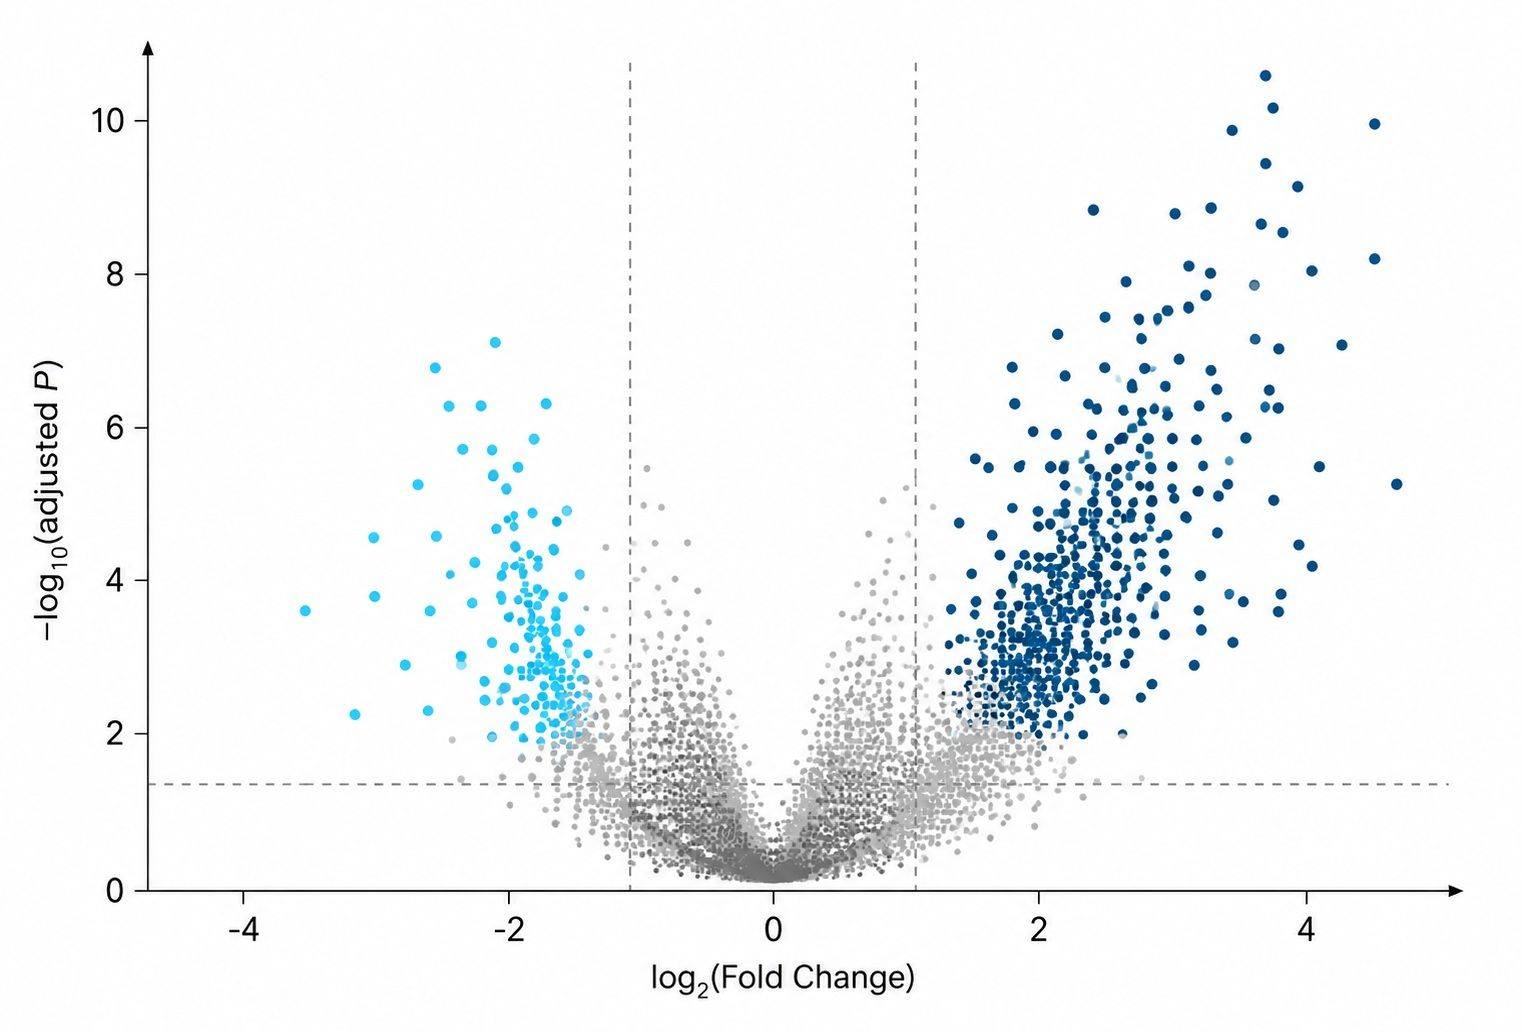
Differential volcano plots prioritize statistically significant SASP factors, shed receptors, and anti-apoptotic proteins.
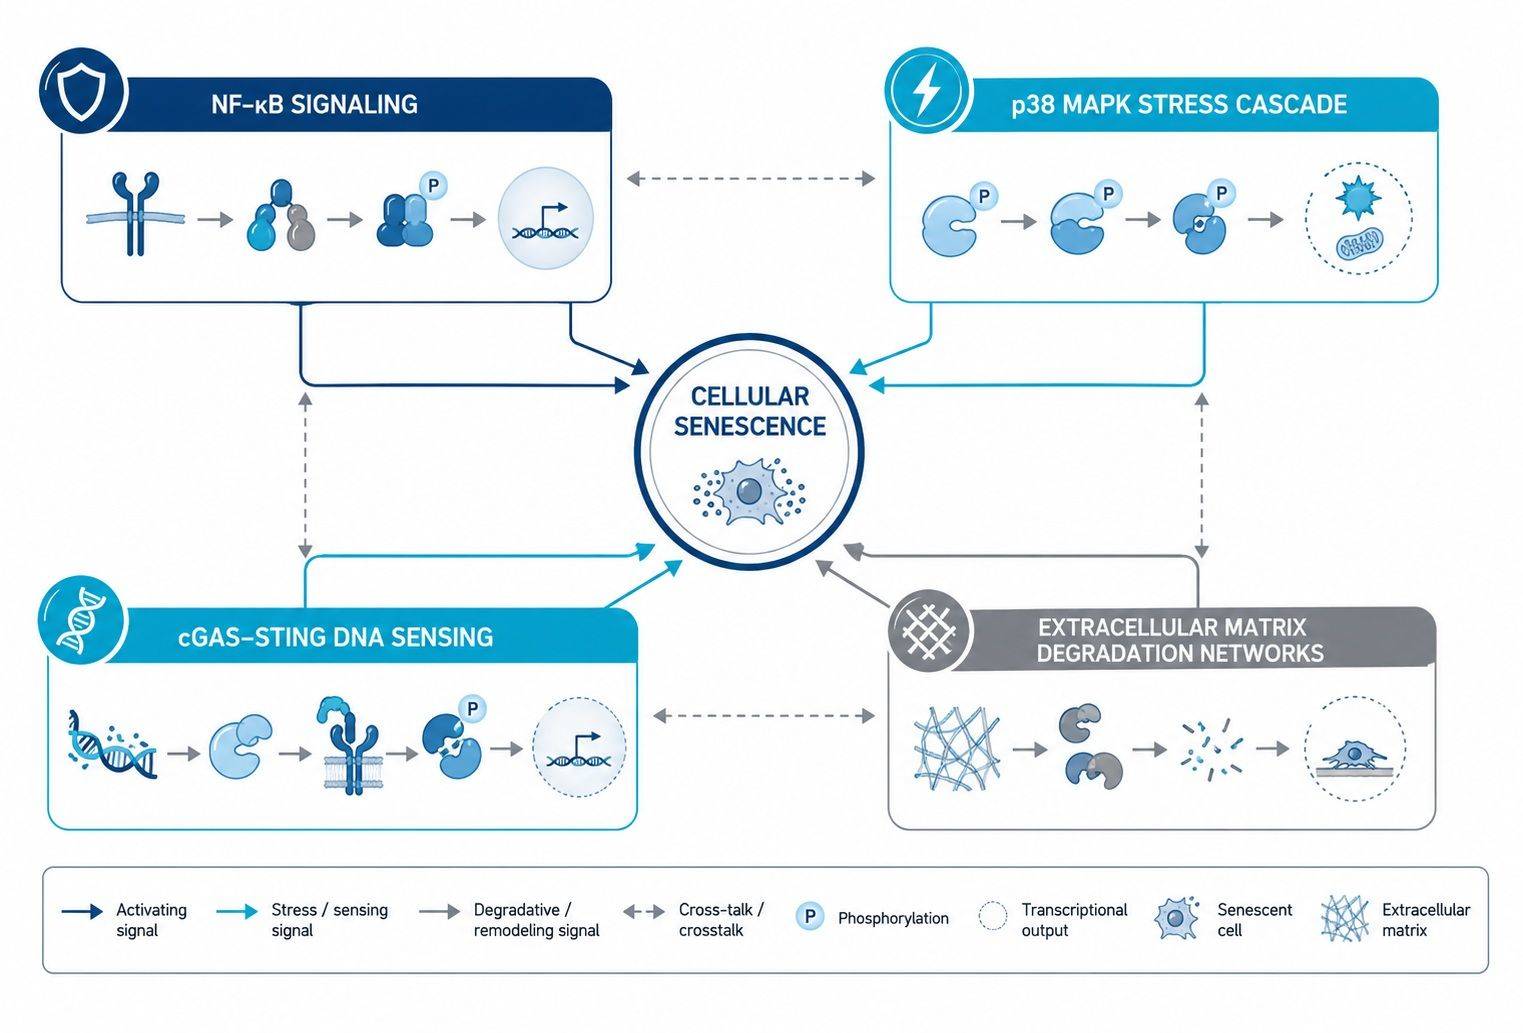
GSEA pathway enrichment and KSEA kinase networks map upstream drivers (NF-κB, p38 MAPK, cGAS-STING) controlling SASP flux.

Normalized SASP & Lysate Data
- Protein- and peptide-level normalized intensity matrices for both intracellular lysates and conditioned media secretomes.

Quality Assessment Summary
- Sample-level QC, cell viability validation, digestion metrics, pooled QC CV distributions, and reproducibility reports.

SASP Atlas Benchmarking
- Direct mapping of identified secretome factors against the reference SASP Atlas database for inducer-specific matching.

Pathway & Kinase Networks
- GSEA functional pathway enrichment, KSEA kinase activity networks, and senolytic clearance scorecards.

Comprehensive Final Report
- Publication-ready figures, auditable methods documentation, and candidate shortlists for targeted PRM validation.