
Single-Cell Proteomics QC: Plate Design, Leakage, Batch Effects, and Software Choice
Mass spectrometry-based single-cell proteomics (scMS) has transitioned from an exploratory academic proof-of-concept into a transformative engine for dissecting cellular heterogeneity, tumor microenvironment plasticity, and therapy-resistant cellular subpopulations. High-sensitivity instruments—such as the Orbitrap Astral and timsTOF Ultra2—now routinely identify between 1,500 and 5,000 distinct protein groups from a single mammalian cell containing merely 150 to 300 picograms of total protein.
However, the physics and chemistry of the ultra-low input regime introduce acute analytical vulnerabilities that do not exist in conventional bulk proteomic workflows. When processing sub-nanogram protein amounts in nanoliter to microliter droplets, standard assumptions regarding sample recovery, enzymatic kinetics, and bioinformatic false discovery control completely break down. A single stray aerosol droplet, a microscopic calibration drift in an acoustic dispensing nozzle, or an aggressive match-between-runs (MBR) bioinformatic parameter can introduce extensive technical artifacts that masquerade as novel biological sub-clusters.
Building a defensible single-cell proteomic study requires a multi-layered quality control blueprint that systematically interrogates every phase of the analytical pipeline: physical microplate dispensing, liquid handling containment, chromatographic stability, mass spectrometric ionization health, algorithmic peak deconvolution, and post-acquisition batch harmonization.
Core Decision Takeaway for Single-Cell Proteomics: In sub-nanogram proteomics, absence of evidence is not evidence of biological absence. Technical dropout, droplet evaporation, and sheath leakage can simulate cellular sub-states. Implementing a four-tier quality control funnel—spanning physical containment, multi-tier microplate blanks, entrapment library false discovery gating, and hierarchical batch correction—is mandatory to produce publication-grade single-cell datasets.
Physical Failure Modes in Ultra-Low Input Sample Preparation
Operating at the physical boundary of mass spectrometry requires strict control over mechanical, chemical, and fluidic variables. In bulk proteomics (10–100 μg), loss of a few nanograms of protein to tube walls or minor pipetting imprecision is undetectable. In single-cell proteomics (0.2 ng), those same losses represent the entire biological sample.
Droplet evaporation, surface adsorption, and microplate edge effects
When working with 384-well microplates, high-density chips, or nanowell arrays (such as cellenONE or nanoPOTS platforms), sample preparation typically occurs in nanoliter to low-microliter volumes (e.g., 200–500 nL lysis and digestion droplets). Under ambient laboratory conditions (20–25°C, 30–50% relative humidity), an open 500 nL droplet undergoes complete evaporation in less than 3 minutes:
- Evaporation-Induced Salt and Detergent Spikes: As water evaporates, the local concentration of lysis reagents (e.g., DDM, DDM-analogues, or organic solvents) and salts increases dramatically, inhibiting trypsin activity and precipitating extracted proteins.
- Perimeter Edge Effects: The outer perimeter wells (Rows A and P, Columns 1 and 24 of a 384-well plate) experience significantly higher convective airflow and vapor-pressure deficits than interior wells. Unless plates are sealed with specialized non-permeable vapor-barrier films and incubated in dedicated high-humidity chambers (>85% relative humidity), outer wells suffer from severe volume shrinkage, resulting in lower digestion efficiency and higher missing value rates.
- Non-Specific Wall Adsorption: Bare polystyrene or untreated glass surfaces exhibit high non-specific protein binding capacities (approximately 100–300 ng/cm2). A standard 384-well microplate well can adsorb several hundred single-cell equivalents onto its walls. Consequently, all single-cell preparation vessels must utilize certified ultra-low retention polymers (e.g., fluoropolymer-coated or specialized low-binding polypropylene) and incorporate trace non-ionic, mass-spectrometry-compatible surfactants to passivate active surface sites.
Cell sorting imprecision, cell leakage, and empty-well contamination
Single cells are isolated into reaction vessels via fluorescence-activated cell sorting (FACS) or automated acoustic liquid dispensing (e.g., cellenONE, CelliGO). Each isolation modality introduces specific physical failure modes:
- Acoustic and Piezoelectric Misalignment: Piezoelectric dispensing nozzles can experience droplet satellite formation, nozzle clogging, or optical misclassification. A satellite droplet containing cell-free buffer can trigger a false positive dispensing event, leaving the target well devoid of a cell.
- Doublets and Debris Misclassification: Improper forward scatter (FSC) and side scatter (SSC) gating in FACS or poor optical thresholding in automated cell sorters can deposit cell doublets, triplets, or cellular fragments into a single well. This introduces artificial hyper-abundant outliers in downstream data matrices.
- Cell Leakage During Harvest: When cells are subjected to extensive enzymatic trypsinization, mechanical scraping, or high-shear hydrodynamic pressure during sorting, fragile cell membranes rupture prior to deposition. The resulting cell suspension becomes contaminated with free cytosolic proteins. If this "cell soup" is sorted into microplates, negative control wells and single-cell wells alike become coated with extracellular ambient proteome, obscuring true single-cell differences.
Enzyme-to-substrate stoichiometry and nanoscale digestion kinetics
In bulk proteomics, enzymatic digestion is performed at fixed enzyme-to-protein ratios (typically 1:20 to 1:50 wt/wt). In a single cell containing 200 pg of protein, maintaining a 1:50 ratio would require dispensing 4 picograms of trypsin per well:
- Protease Autolysis and Incomplete Proteolysis: At picogram concentrations, trypsin molecules are diluted far below their kinetic Michaelis-Menten threshold (Km). Reaction rates drop precipitously, leading to extensive missed cleavages. Conversely, overcompensating by adding standard nanogram quantities of trypsin (e.g., 1–5 ng/well) shifts the enzyme-to-substrate ratio to 5:1 or 25:1, causing trypsin autolysis peptides to dominate the mass spectra, suppressing native peptide ionization.
- Ultra-Pure and Chemically Modified Enzymes: Single-cell digestion protocols require hyper-pure, methylated, or engineered mass-spectrometry-grade proteases with minimized autolytic propensities, formulated with optimized organic co-solvents (e.g., 20–30% acetonitrile or trifluoroethanol) to enhance substrate unfolding while preserving enzyme catalytic activity in nanoliter droplets.
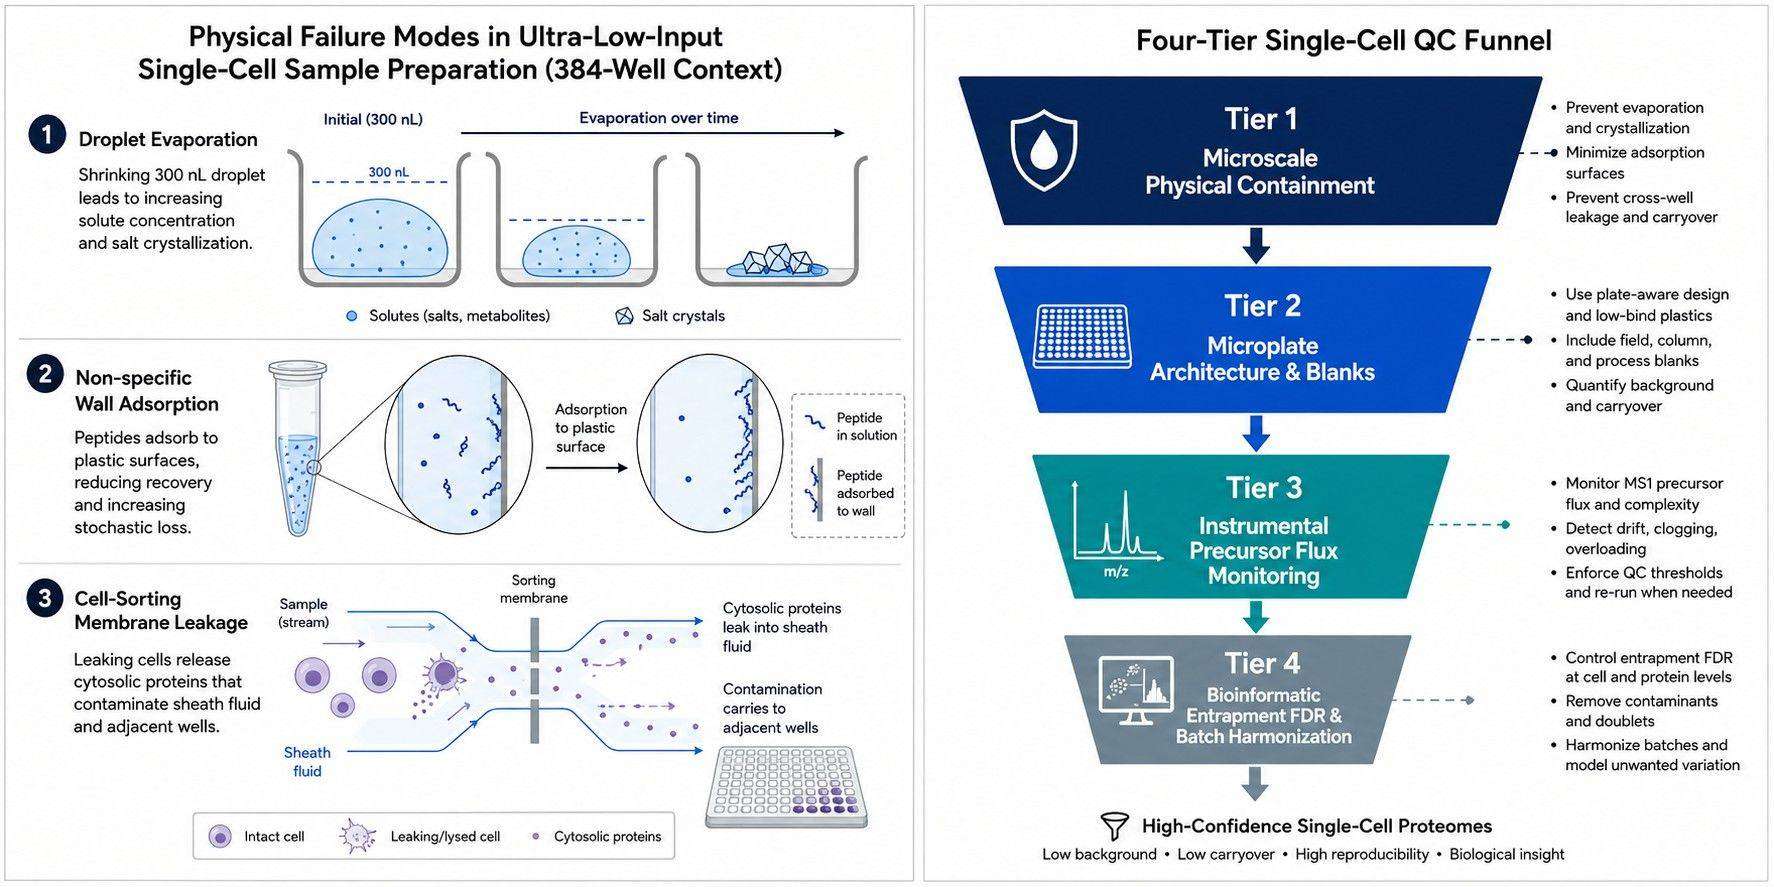 Figure 1. Physical failure modes in single-cell sample preparation and the four-tier quality control funnel.
Plate Layout Architecture and Mandatory Control Regimens
To distinguish technical artifacts from true cellular heterogeneity, microplate layouts must be engineered with the same rigor as clinical diagnostic arrays. Placing all experimental cells in the center and controls on the edges—or placing all Condition A cells on Plate 1 and Condition B cells on Plate 2—guarantees that batch and position effects will permanently confound the biological conclusions.
Checkerboard vs randomized column-row plate geometries
Spatial microplate artifacts follow distinct physical patterns, including temperature gradients during incubation, humidity loss across edges, and systematic syringe-pump wash variations across autosampler coordinates:
- Block Randomization: Rather than filling a plate sequentially by biological condition, wells must be assigned using block randomization or Latin-square spatial layouts. In a study comparing wild-type vs drug-treated cells, both conditions must be evenly distributed across inner and outer rows and interleaved across odd and even columns.
- Edge Well Exclusion / Buffer Moats: The outermost perimeter of 384-well plates (all 76 wells of Rows A, P and Columns 1, 24) should ideally be filled with sterile water or 0.1% formic acid to serve as a sacrificial sacrificial evaporation buffer moat. This isolates interior analytical wells from ambient humidity gradients.
Negative blank controls and multi-tier dilution anchors
Every 384-well single-cell plate must contain a prespecified control architecture spanning at least 10–15% of the total available wells:
- Sorting Negatives (Process Blanks): Wells that receive all lysis buffers, reduction/alkylation reagents, and digestion enzymes, and undergo identical incubation and extraction, but receive zero cell deposition. These wells define the background noise floor, measuring reagent impurities, sheath fluid contamination, and protease autolysis peaks.
- Conditioned Sheath Supernatant Blanks: Wells deposited with 0.22 μm filtered cell-suspension supernatant taken immediately after cell harvesting. This critical control quantifies the exact concentration of ambient extracellular protein present in the sorting fluid, ensuring that proteins identified in single-cell wells reflect intracellular contents rather than media carryover.
- Multi-Cell Reference Ladders (10-Cell and 50-Cell Tiers): Including wells deposited with exact counts of 10 and 50 cells provides a direct empirical calibration of linear dynamic range and digestion efficiency across the microplate.
- Centralized 200 pg Standard Anchors: Injections of 200 pg of a bulk, quality-controlled standard cell digest (e.g., HeLa or K562) placed at regular intervals across the acquisition queue. As demonstrated in the 2026 HUPO Single Cell Initiative benchmark, these standardized anchors isolate instrument-level drift from cell-to-cell biological variance.
Carrier channel optimization in isobaric multiplexing
In multiplexed single-cell workflows (such as SCoPE2 or plexDIA) utilizing tandem mass tags (TMT/TMTpro) or non-isobaric mass tags, a carrier proteome is added to provide sufficient precursor ion signal to trigger MS/MS sequencing and improve chromatographic peak tracking:
- The Carrier Proteome Dilemma: While adding a 200–500 cell carrier channel increases peptide identification counts, excessive carrier mass introduces severe analytical failure modes. High carrier ion flux triggers automatic gain control (AGC) saturation in Orbitrap instruments or space-charge accumulation in ion traps, starving the single-cell channels of analytical ion capacity.
- Quantitative Ion Coalescence and Distortion: When the carrier-to-single-cell ratio exceeds 50:1 to 100:1, single-cell reporter ions or precursor peaks suffer from severe ratio compression and baseline distortion. Current best practices dictate carrier channel sizes of no more than 20 to 50 cell equivalents, or shifting entirely toward label-free single-cell acquisition on high-speed instruments like the timsTOF Ultra2 or Orbitrap Astral. Teams seeking commercial single-cell solutions can evaluate single cell proteomics platforms designed to minimize carrier-induced suppression.
| Control Element | Well Composition / Specification | Targeted QC Failure Mode | Quantitative Acceptance Threshold |
|---|---|---|---|
| Sorting Negative (Blank) | Sorting buffer + digestion enzymes without cell deposition | Ambient contamination, sorting sheath aerosol, protease autolysis background | Total peptide signal <3% of single-cell median; <50 non-keratin protein groups at 1% FDR |
| Conditioned Sheath Blank | Aspiration of cell suspension supernatant post-centrifugation (0.22 μm filtered) | Pre-sorting cell lysis, membrane leakage, soluble extracellular proteome carryover | Cytosolic marker intensity (GAPDH, ACTB) indistinguishable from sheath blank baseline |
| Centralized 200 pg Anchor | 200 pg pre-digested standardized standard digest (e.g., HeLa / K562) | LC-MS instrument drift, column clogging, electrospray ionization degradation | Precursor-level CV <25% across plate; retention time deviation <0.3 min; >1,800 protein groups |
| Multi-Cell Reference Tier | 10-cell and 50-cell pooled wells processed in parallel on the same plate | Linear dynamic range verification, cell lysis efficiency, sample loss during transfer | Linear regression R2 > 0.95 across 1-, 10-, and 50-cell protein abundance tiers |
| Cross-Plate Bridge Pool | Aliquoted master digest of representative study cells injected every 24 runs | Inter-plate batch effects, mass accuracy drift, chromatographic stationary phase aging | Pearson correlation r > 0.92 between bridge injections across multi-plate studies |
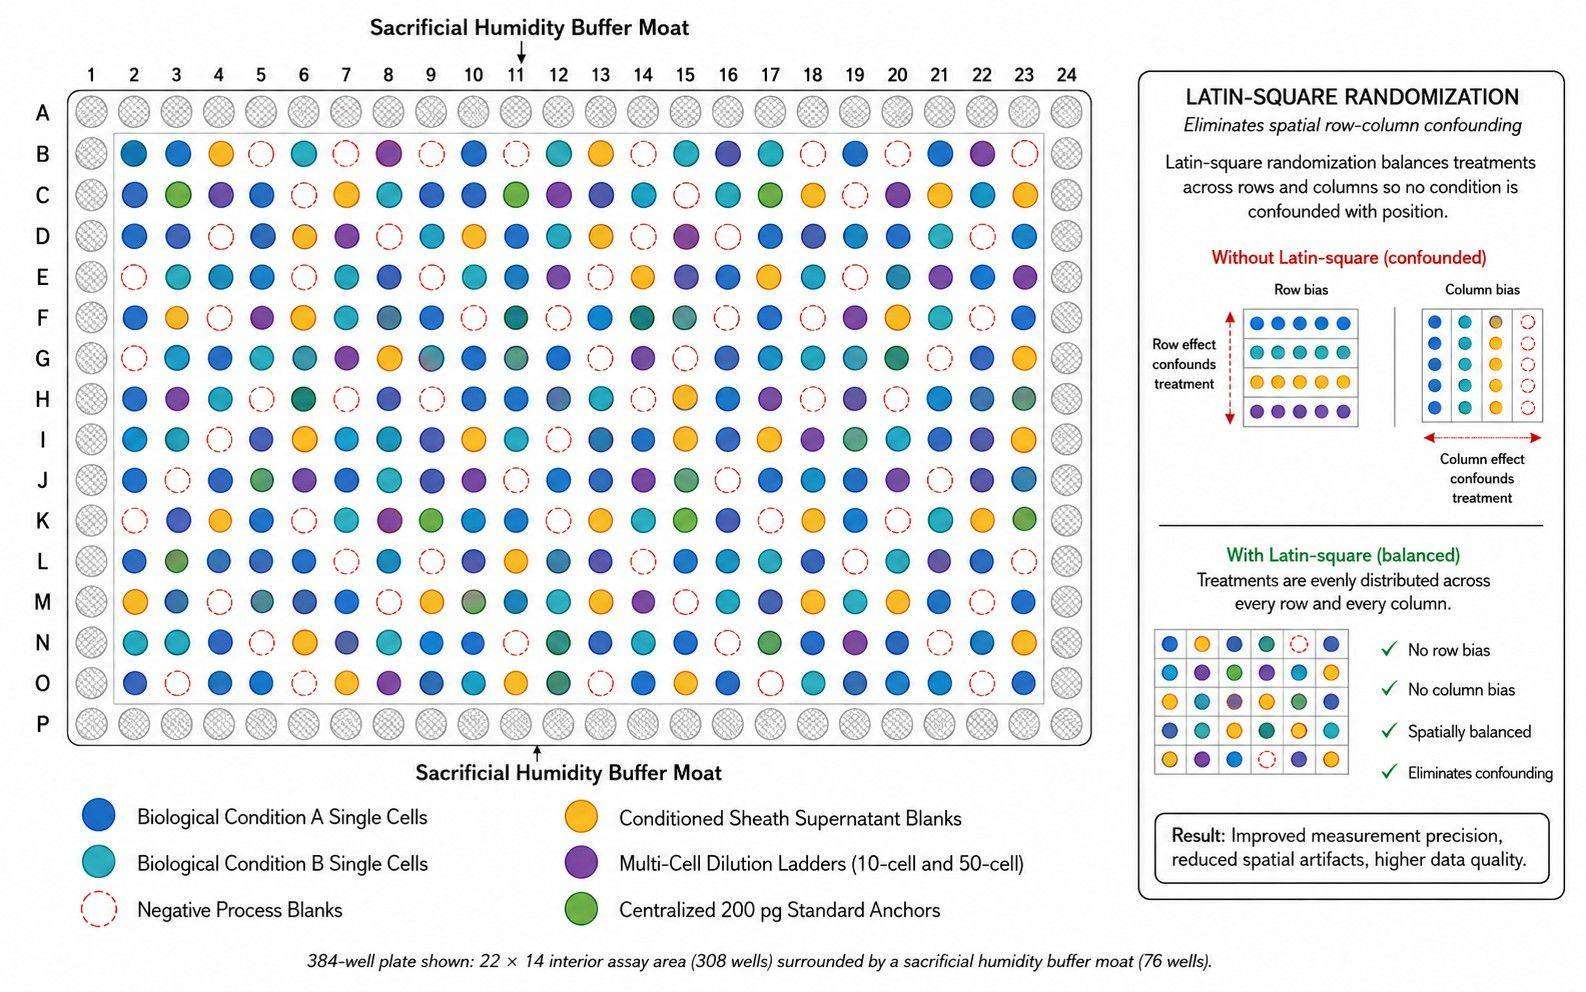 Figure 2. 384-well microplate layout architecture with edge moats, randomized biological cohorts, and interleaved multi-tier QC wells.
Instrumental Monitoring and Low-Input LC-MS/MS Health Indicators
Standard bulk proteomics quality metrics (e.g., base-peak chromatogram intensity, 1 μg HeLa identification count) cannot diagnose instrument readiness for sub-nanogram samples. A mass spectrometer that performs adequately on bulk samples can fail completely on single cells due to subtle electrospray instability or minor vacuum contamination.
Ultra-low flow chromatography: retention time stability and emitter fouling
Single-cell proteomics relies on ultra-narrow bore capillary columns (50–75 μm inner diameter) operated at true nanoflow rates (100 to 250 nL/min) to maximize electrospray ionization efficiency:
- Low Thermal Mass Sensitivity: At 100 nL/min, minor fluctuations in ambient room temperature (±1.5°C) cause significant changes in mobile phase viscosity, resulting in retention time shifts of 0.5 to 1.5 minutes. In DIA workflows relying on narrow spectral extraction windows, this drift leads to peak truncation and missing values.
- Emitter Tip Degradation and Corona Discharge: Sub-nanogram samples generate minute ion currents. Slight salt buildup or microscopic fiber deposition at the nanospray emitter tip induces intermittent corona discharge or micro-spraying. While high-concentration samples can mask micro-spray instabilities, single-cell ion signals disappear into baseline chemical noise. Continuous monitoring of electrospray current stability (±0.05 μA tolerance) is mandatory.
Precursor ion flux thresholds and ion trap fill time diagnostics
In both Orbitrap and time-of-flight architectures, monitoring raw spectral diagnostics across the chromatographic run provides immediate visibility into analytical health:
- Maximum Injection Time (IT) Saturation: In Orbitrap-based single-cell acquisitions (e.g., Orbitrap Astral or Exploris 480), the instrument operates with high maximum injection times (e.g., 50–150 ms) to accumulate sufficient ions from scarce precursors. If single-cell runs continuously hit the maximum injection time ceiling without reaching the target AGC value, ion transmission has degraded (e.g., due to quadrupole contamination or dirty ion transfer tubes), necessitating front-end cleaning.
- Total Ion Current (TIC) Trajectory: Longitudinal monitoring of TIC areas across 200 pg standard anchor runs must show less than 15% deviation across a 100-run queue. A steady downward slope in TIC indicates analytical column fouling or stationary phase degradation. Advanced platforms utilizing 4D proteomics services monitor ion mobility peak profiles to ensure stable ion optics transmission throughout multi-day queues.
Benchmarking platform performance: Orbitrap Astral vs timsTOF Ultra2
The recent multi-laboratory benchmark published by the HUPO Single Cell Initiative established clear performance baselines across leading high-sensitivity platforms:
- Orbitrap Astral: Delivers extraordinary sequencing speed and depth, identifying >3,500–5,000 protein groups per single mammalian cell in short 30- to 60-minute gradients. Median precursor-level coefficients of variation (CVs) for single cells range between 38% and 55% under centralized preparation.
- timsTOF Ultra2 (dia-PASEF): Combines trapped ion mobility spectrometry (TIMS) with high-speed quadrupole time-of-flight detection. The collisional cross section (CCS) dimension physically separates co-eluting chemical noise from peptide ions, providing remarkable data completeness and robust quantification at low inputs. Programs requiring ion-mobility-assisted separation can implement 4D-DIA quantitative proteomics services to maximize spectral purity.
- Inter-Laboratory Correlation: The HUPO benchmark revealed that quantitative reproducibility across independent laboratories is highest when comparing instruments from the same vendor, whereas cross-platform comparisons exhibit systematic intensity differences that require specialized batch harmonization.
Bioinformatic Deconvolution and Software Selection in scMS
The 2026 HUPO Single Cell Initiative benchmark uncovered a striking finding: the choice of bioinformatic software tool impacts single-cell proteome identification depth and quantitative accuracy more than the instrument hardware itself.
Algorithmic comparison: DIA-NN, Spectronaut, and EncyclopeDIA at single-cell depth
- DIA-NN: Widely adopted for single-cell DIA due to its deep neural-network peak scoring and library-free directDIA capabilities. It demonstrates high sensitivity in extracting weak precursor signals from noise. However, when run with default settings on large single-cell datasets, aggressive signal extraction can inflate false positive identifications unless matching-between-runs (MBR) is strictly gated. Dedicated DIA data analysis workflows optimize machine learning boundaries specifically for sparse matrices.
- Spectronaut: Employs non-linear iRT alignment and rigorous machine-learning scoring (Pulsar). Its SN-MBR algorithm incorporates strict Q-value gating, preventing low-confidence feature transfer across sparse matrices. Spectronaut maintains exceptional quantitative accuracy and conservative false discovery control across large clinical cohorts.
- EncyclopeDIA: Relies on retention-time-indexed chromatogram library searching. When paired with high-quality gas-phase-fractionated (GPF) reference libraries generated from low-input material, EncyclopeDIA shows remarkable resistance to chimeric spectral interference, making it highly effective for specialized tissue types.
The Match-Between-Runs (MBR) false discovery trap
In bulk proteomics, MBR transfers peptide identifications from a run where the peptide was confidently sequenced to another run where only the precursor MS1/MS2 feature was observed. In single-cell proteomics, where data matrices suffer from 30% to 60% baseline sparsity, unconstrained MBR represents a primary source of data contamination:
- False Transfer into Baseline Noise: Because chemical noise peaks in the ultra-low input regime frequently align by chance with expected precursor mass and retention time windows, global MBR algorithms can incorrectly match random noise spikes, assigning false positive protein identifications to empty wells or unrelated cell types.
- Entrapment Library Validation: To verify empirical FDR, raw data must be searched against an entrapment database containing target species proteins mixed with non-homologous entrapment species proteins (e.g., human single cells searched against a 1:1 human-Arabidopsis library). Any identification of an Arabidopsis protein in a human single-cell run represents a definitive false positive. Empirical testing demonstrates that unconstrained MBR can drive real single-cell FDR from a nominal 1% to over 8%, invalidating downstream biological clustering.
- Constrained Two-Pass MBR: Best practice dictates restricting MBR to run-level clusters (e.g., matching only within the same biological condition or microplate) and applying strict precursor-level Q-value thresholds (Q ≤ 0.01) across both source and target runs.
Data matrix sparsity and imputation boundaries
Single-cell proteomic matrices naturally contain missing values due to the stochastic nature of sampling low-abundance ions near the limit of detection (LOD). Indiscriminate global imputation (e.g., replacing all missing values with low normal values) creates artificial correlations and flattens biological variance. Imputation should only be applied to non-random missingness (missing due to low abundance) after verifying that random technical missingness (due to spray dropouts or precursor selection stochasticity) has been modeled appropriately.
| Software Platform | Deconvolution Engine | MBR Risk Profile | Entrapment FDR Performance | Recommended Study Context |
|---|---|---|---|---|
| DIA-NN (v1.8.1+) | Neural network deep scoring with empirical spectral library or directDIA | High sensitivity; unconstrained global MBR can propagate false transfers into noise | Well-controlled (reported 1% ≈ empirical 1.4% with two-pass heuristic) | High-throughput discovery cohorts; library-free and project-specific libraries |
| Spectronaut (v18+) | Pulsar search engine with non-linear iRT alignment and SN-MBR algorithm | Conservative feature transfer; strict Q-value gating minimizes cross-well bleed | Strictly conserved (reported 1% ≈ empirical 0.9–1.1% on entrapment species) | Multi-center clinical studies; regulatory single-cell verification panels |
| EncyclopeDIA | Chromatogram library searching with Percolator machine-learning scoring | Requires matrix-matched chromatogram library; low risk of false transfer | Robust FDR estimation; resilient against chimeric spectrum interference | Complex tissues where GPF-DIA libraries can be generated prior to single-cell runs |
| FragPipe-MSFragger | Ultrafast fragment indexing with IonQuant FDR filtering and match-between-runs | Moderate risk; depends heavily on retention time calibration tolerances | Good concordance on timsTOF 4D-data utilizing ion mobility CCS filtering | Dual-species or open-search workflows evaluating unexpected modifications |
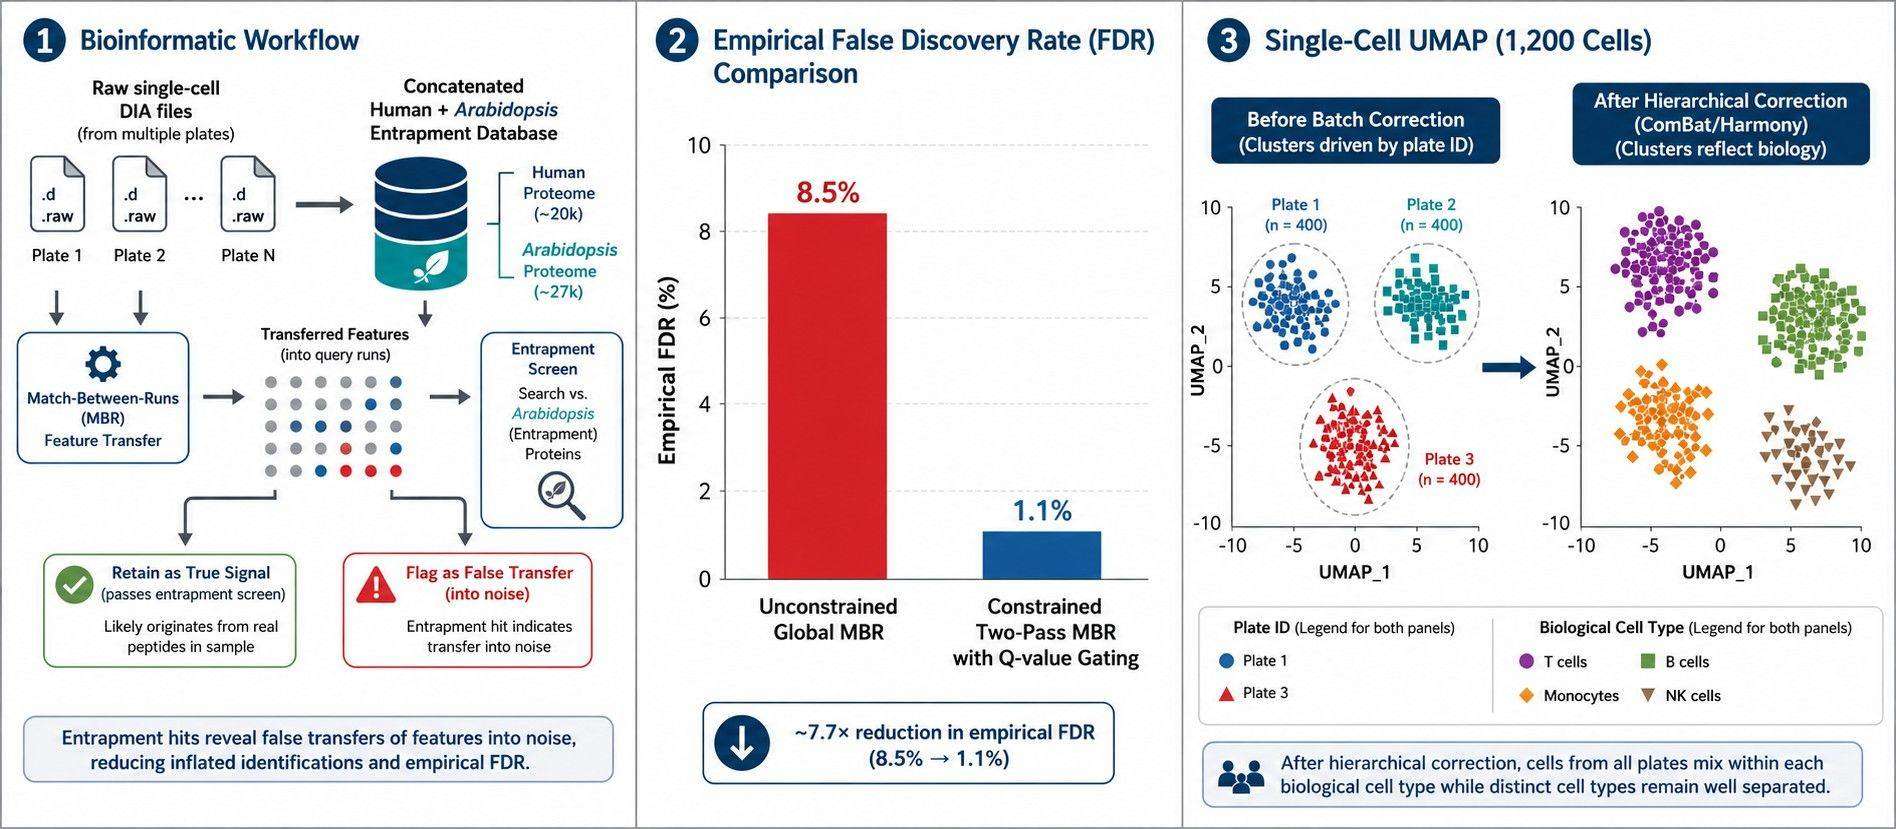 Figure 3. Bioinformatic QC architecture: entrapment database validation, two-pass MBR gating, and hierarchical batch correction.
Batch Effect Correction Strategies Without Biological Flattening
A typical single-cell proteomics campaign interrogating hundreds or thousands of cells requires multiple 384-well microplates acquired over days or weeks. Technical batch variation—stemming from autosampler temperature drifts, column aging, mobile phase changes, and day-to-day instrument tuning—will inevitably separate cells by plate and run order if left uncorrected.
Decoupling technical run variation from genuine single-cell heterogeneity
The central challenge of single-cell batch correction is ensuring that technical batch removal does not inadvertently strip away true biological heterogeneity (e.g., subtle cell-cycle transitions, developmental trajectories, or drug-tolerant persister states):
- Experimental Design as the First Line of Defense: Mathematical batch correction cannot rescue an experiment where all control cells were prepared on Plate 1 and all treated cells on Plate 2. As established in the plate design guidelines, biological groups must be balanced across plates.
- Supervised vs Unsupervised Dimensionality Reduction: Preliminary review of raw single-cell data must evaluate principal component analysis (PCA) and uniform manifold approximation and projection (UMAP) plots colored by technical variables: plate identifier, acquisition order, well row, well column, and total ion intensity. If the top two principal components correlate with plate ID or run sequence rather than biological cell type, batch correction must be applied.
Hierarchical normalization: well-coordinate adjustment before latent factor modeling
Single-cell data should undergo a multi-tiered, sequential normalization protocol:
- Per-Cell Median / Total Signal Normalization: Corrects for differences in cell volume, dispensing droplet size, and electrospray ionization efficiency across individual cells.
- Microplate Spatial Normalization: Fits polynomial surface models across 384-well row and column coordinates to remove perimeter edge drying effects.
- Run-Order Smoothing: Applies non-linear regression (e.g., LOESS) across acquisition time to correct for progressive chromatographic column degradation.
- Cross-Batch Harmonization: Utilizes statistical frameworks developed for high-sparsity single-cell data—such as ComBat, Harmony, or scMerge—benchmarked against the interleaved 200 pg standard anchors.
Benchmarking single-cell correction tools: ComBat, Harmony, and scMerge
- ComBat: Fast and effective for linear batch effects across balanced designs, but assumes normal distributions that can struggle with high missing value rates.
- Harmony: Highly effective in single-cell data spaces; iteratively projects cells into low-dimensional PCA space, clustering cells across batches to maximize diversity while penalizing batch-specific separation.
- scMerge: Leverages stably expressed reference genes (SEGs) identified across single cells to calibrate technical variance, preserving biological trajectories with minimal distortion.
Stepwise Quality Control Acceptance Protocol and Pre-Analytical Checklist
Implementing an industrial-grade single-cell proteomics campaign requires an objective, phase-gated quality control protocol. Individual wells, plates, or run batches that fail defined metrics must be systematically quarantined.
| Inspection Phase | Metric & Diagnostic Method | Acceptance Threshold (PASS) | Corrective Action on Failure (REVISE) |
|---|---|---|---|
| 1. Dispensing / Isolation | CellenONE optical imaging / FACS event recording | Single intact cell per targeted well (>98% purity); droplet volume deviation <5% | Recalibrate acoustic nozzle or fluidic pressure; discard plate if doublets >3% |
| 2. Lysis & Digestion | Volume tracking in humidity chamber; miss-cleavage rate | Zero visible evaporation (<2% weight loss); tryptic miss-cleavage <15% in multi-cell wells | Seal plate with vapor-barrier film; adjust incubator humidity to >85%; verify enzyme batch |
| 3. LC-MS Instrument | 200 pg standard anchor injections every 12–24 runs | Total TIC area within ±15%; RT shift <0.3 min; median precursor CV <25% | Wash or replace analytical column; clean ion transfer tube; recalibrate mass accuracy |
| 4. Background Contamination | Negative blank well protein & peptide counts | Blank total intensity <3% of median single cell; <50 non-contaminant protein IDs | Flag sorting sheath leakage; replace enzyme stocks; exclude contaminated plate batches |
| 5. Informatics / FDR | Entrapment library cross-species match rate | Empirical entrapment FDR ≤1.2% at nominal 1% cut-off; MBR Q-value ≤0.01 | Restrict MBR to intra-plate runs; disable global matching; tighten retention time window |
| 6. Batch Normalization | PCA / UMAP clustering of biological replicates & anchors | Anchor replicates cluster tightly; cell-type separation explains >80% of top PC variance | Apply sequential plate-coordinate and run-order correction using ComBat or scMerge |
Pre-analytical quality checklist
- Sample Viability & Harvesting: Verify cell viability exceeds 90% before sorting; wash cells 3× with ice-cold PBS to eliminate serum proteins; filter single-cell suspensions through 35 μm cell strainers to eliminate aggregates.
- Plate Passivation & Volume Control: Confirm 384-well microplates are certified low-binding polymer; incubate microplates in sealed humidity chambers (>85% RH) during all enzymatic incubation steps.
- Control Architecture Inclusions: Ensure each 384-well plate includes at least 16 negative process blanks, 8 conditioned sheath blanks, 8 multi-cell reference wells (10-cell and 50-cell), and 8 centralized 200 pg anchor wells.
- Instrument Readiness Verification: Confirm mass spectrometer mass accuracy (<2 ppm for Orbitrap, <5 ppm for TOF); verify electrospray stability across a 30-minute blank gradient; ensure nanoflow pump pressure is stable at 100–250 nL/min.
- Bioinformatic Software Parameter Locking: Lock spectral library version; set precursor and protein FDR cutoffs to strict 1%; enable two-pass constrained MBR with run-specific Q-value gating; run entrapment library check to verify empirical FDR.
- Batch Harmonization Strategy: Plan multi-plate acquisition sequences to interleave biological groups; record exact well coordinates, plate IDs, and injection timestamps in project metadata for hierarchical normalization.
NGPro Support for Single-Cell Proteomics Programs
Executing successful single-cell proteomics requires coordinating nanoscale liquid handling, ultra-sensitive mass spectrometry, and advanced single-cell computational pipelines. The NGPro™ platform provides an integrated, end-to-end framework for high-throughput single-cell and ultra-low input projects.
Our technical workflow connects automated nanoliter liquid handling on cellenONE dispensing systems with high-speed, high-sensitivity acquisition on Orbitrap Astral and Bruker timsTOF Ultra2 mass spectrometers. Utilizing 4D-DIA quantitative proteomics services and advanced 4D proteomics services, our analytical platform separates co-eluting chemical noise from peptide precursors in the ion mobility dimension, achieving consistent proteome coverage of 2,000 to >4,000 protein groups per single cell.
For projects transitioning from single-cell biomarker discovery to focused cohort validation, our infrastructure seamlessly bridges broad discovery proteomics with multiplexed targeted proteomics (PRM/MRM) and specialized DIA data analysis. From study design and microplate geometry optimization to entrapment FDR validation and batch effect removal, our team delivers defensible, audit-ready data matrices for translational research.
To discuss single-cell feasibility for your primary cells or clinical biopsies, evaluate microplate dispensing protocols, or plan a pilot single-cell cohort study, contact our technical team to schedule an initial consultation.
Frequently Asked Questions
References
- HUPO Single Cell Initiative. Defining Quality Control Standards for Single-Cell Proteomics by Mass Spectrometry: A Multi-Laboratory Benchmarking Study across Orbitrap Astral and timsTOF Ultra2 Platforms. bioRxiv. 2026;2026.07.13.738155.
- Specht, H. et al. Single-cell proteomic and transcriptomic analysis of macrophage heterogeneity using SCoPE2. Genome Biol. 2021;22(1):50.
- Derks, J. et al. Increasing the throughput of sensitive proteomics by plexDIA. Nat. Biotechnol. 2022;41(1):50–59.
- Brunner, A. D. et al. Ultra-high sensitivity mass spectrometry quantifies single-cell proteome changes upon perturbation. Mol. Syst. Biol. 2022;18(3):e10798.
- Demichev, V. et al. DIA-NN: neural networks and interference correction enable deep high-throughput proteomics. Nat. Methods. 2020;17(1):41–44.
- Schoof, E. M. et al. Quantitative single-cell proteomics as a tool to characterize complex cell systems and cell-fate transitions. Nat. Commun. 2021;12(1):3341.
- Slavov, N. Driving single-cell proteomics forward with quality control standards and open science. Nat. Methods. 2022;19(8):919–920.
 4D Proteomics with Data-Independent Acquisition (DIA)