
Sample Size and Replicate Design for DIA Proteomics Studies
A DIA proteomics study becomes underpowered long before the first sample reaches the mass spectrometer. The failure usually begins when the number of specimens is chosen from convention, when technical injections are counted as independent biological replicates, or when the study is expected to detect small fold changes without an estimate of biological variance. High analytical reproducibility does not compensate for insufficient biological sampling.
The appropriate sample size is determined by the claim the study must support. A controlled perturbation experiment in independently cultured cell populations, a paired pre-treatment/post-treatment clinical study, and a heterogeneous case-control cohort do not share the same experimental unit or variance structure. They should not inherit the same replicate rule.
This article provides a planning framework for relative quantitative DIA studies. It is intended to support budget development, pilot design, randomization, and statistical consultation. The planning ranges shown below are starting scenarios, not guaranteed minimums. Final sample size should be justified using study-specific variance, the smallest effect of interest, the multiplicity of planned tests, and expected sample attrition.
Once analytical quality and coverage are adequate for the primary endpoint, an additional independent biological sample usually contributes more inferential value than a repeated injection of an existing specimen. Deeper measurement remains important when the objective is rare-target detection, PTM-site discovery, library construction, or exhaustive proteome cataloging.
DIA Proteomics Sample Size Guidelines:
- Homogeneous cell-line studies: begin by budgeting 4–6 independently initiated cultures per primary group; effects near 1.5-fold may still require more when variance or multiplicity is high.
- Inbred-animal tissue studies: 6–10 independent animals per primary group is a practical starting range before sex, cage, time point, and phenotype variability are incorporated.
- Exploratory human cohorts: 15–30 or more independent participants per primary group may support initial discovery, but small effects, covariate adjustment, subgroup analysis, and validation require larger cohorts.
- Technical replicates: repeated preparation or LC-MS injection characterizes analytical variability but does not increase statistical N for biological inference.
Biological Replicates vs. Technical Replicates in DIA Proteomics
The experimental unit is the smallest independently assigned or sampled entity about which the biological conclusion will be made. Its definition controls the effective sample size.
For a drug perturbation in a cell line, wells split from the same culture flask are usually subsamples, not independent biological replicates. Independence is better represented by separately initiated cultures, separate passages, or experiments performed on different days, depending on the biological question. In an animal study, multiple tissue pieces from one animal remain measurements from one animal. In a paired clinical study, the patient—not the biopsy section or LC-MS injection—is the experimental unit.
Confusing subsamples with independent replicates produces pseudoreplication. It can make confidence intervals too narrow and differential-abundance results appear more certain than the design supports. Technical replication can estimate preparation or instrument variation, but it does not increase the number of independent biological units.
| Replicate type | What is repeated | Variance component addressed | Contribution to the biological sample size |
|---|---|---|---|
| Independent biological replicate | Independent culture, animal, donor, patient, or biological unit | Biological heterogeneity plus downstream analytical variation | Yes |
| Sample-preparation replicate | Separate extraction or digestion of the same biological material | Preparation reproducibility | No |
| Injection replicate | Repeated LC-MS analysis of the same digest | Chromatographic and instrument repeatability | No |
| Longitudinal measurement | Repeated observation of the same biological unit | Within-subject change and time-dependent variation | Requires a paired or mixed model; measurements are not independent subjects |
The design should record the hierarchy explicitly: subject, specimen, preparation, batch, and injection. This hierarchy should also be retained in the sample manifest supplied for proteomics bioinformatics analysis, because a statistical model cannot reconstruct relationships that were not documented.
Statistical Power in DIA Proteomics: Effect Size, Biological Variance, and FDR
Power is the probability of detecting a true effect under a specified model and decision threshold. In a two-group comparison, the required sample size increases as within-group variance rises and decreases as the effect of interest becomes larger. The relationship is approximately proportional to variance divided by the squared effect size. A project designed to detect a 1.25-fold change therefore requires much more information than one designed around a twofold change, even before multiple-testing adjustment is considered.
DIA proteomics adds three practical complications.
- Variance depends on abundance. Lower-abundance precursors are generally measured with greater relative uncertainty and may be observed less consistently than high-abundance precursors.
- Thousands of hypotheses are tested. Controlling the false discovery rate reduces the effective power available to each protein compared with an isolated single-analyte test.
- Missingness is structured. Missing values can arise from low abundance, matrix interference, sample preparation, chromatography, or data-processing thresholds. Treating every missing value as random can bias both variance and effect estimates.
A recent ground-truth DIA benchmarking preprint showed that power changed substantially with fold change and protein abundance, and that a nominal Benjamini-Hochberg FDR did not always equal the empirical error rate in the workflow studied [1]. The implication for planning is not that one universal correction should replace FDR. It is that the expected effect size, abundance range, missingness, and statistical workflow should be considered together rather than selecting a replicate count in isolation.
Minimum Effect Size for DIA Proteomics Power Analysis
The effect size used for power planning should be the smallest change that would alter the scientific or development decision, not the largest change expected for a favored target. If a pathway-level conclusion requires detecting coordinated 1.3-fold changes, powering the study only for twofold changes is misaligned with the intended interpretation.
For discovery work, it is useful to calculate several scenarios rather than one number:
- a moderate-effect scenario for broadly detectable proteins;
- a smaller-effect scenario for the primary biological pathway;
- a higher-variance scenario for low-abundance or heterogeneous proteins;
- a sample-loss scenario that includes failed extraction, low peptide yield, or exclusion after prespecified QC.
The resulting sensitivity analysis makes the limits visible. It also prevents a single optimistic variance estimate from becoming the basis of the entire project.
Sample Size Planning Across Common DIA Study Designs
The table below is a budgeting aid. It should not be cited as proof that a particular study is powered. The ranges assume independent biological units, a balanced primary comparison, standardized preparation, and one analytical run per sample after method qualification.
| Study context | Biological variability expected | Illustrative starting range per primary group | When the range is unlikely to be sufficient |
|---|---|---|---|
| Independently repeated cell-culture perturbation | Low to moderate if culture conditions are tightly controlled | 4–6 independent cultures | Small effects, multiple cell lines, donor-derived cells, time-course interactions, or unstable treatment response |
| Inbred animal tissue study | Moderate, with additional cage, sex, dissection, and circadian effects possible | 6–10 animals | Both sexes analyzed separately, multiple time points, variable disease penetrance, or small expected effects |
| Primary cells from human donors | Moderate to high | 8–15 donors | Strong donor heterogeneity, medication or demographic confounding, multiple response strata, or unpaired sampling |
| Exploratory clinical tissue or biofluid comparison | High | 15–30 or more participants | Biomarker claims, small effects, multiple covariates, molecular subtyping, survival analysis, or an independent validation requirement |
| Paired pre/post or matched tissue design | Often lower residual variance than an unmatched comparison | Determined from within-pair variance; may require fewer subjects than an unmatched design | Weak within-subject correlation, inconsistent sampling intervals, missing pairs, or treatment-by-time interactions |
Three biological replicates may be adequate to test whether a workflow produces interpretable data or to detect very large, consistent perturbations. It is not a defensible default for a confirmatory, proteome-wide comparison. Likewise, 15–30 clinical samples per group can support an exploratory discovery analysis but should not be presented as sufficient for clinical validation or robust subgroup modeling.
When a project requires large-cohort consistency rather than maximum depth per injection, a standardized DIA quantitative workflow can support single-shot acquisition across many specimens. The cohort design still needs independent biological replication, randomized batches, and a statistical analysis plan that reflects the sampling structure.
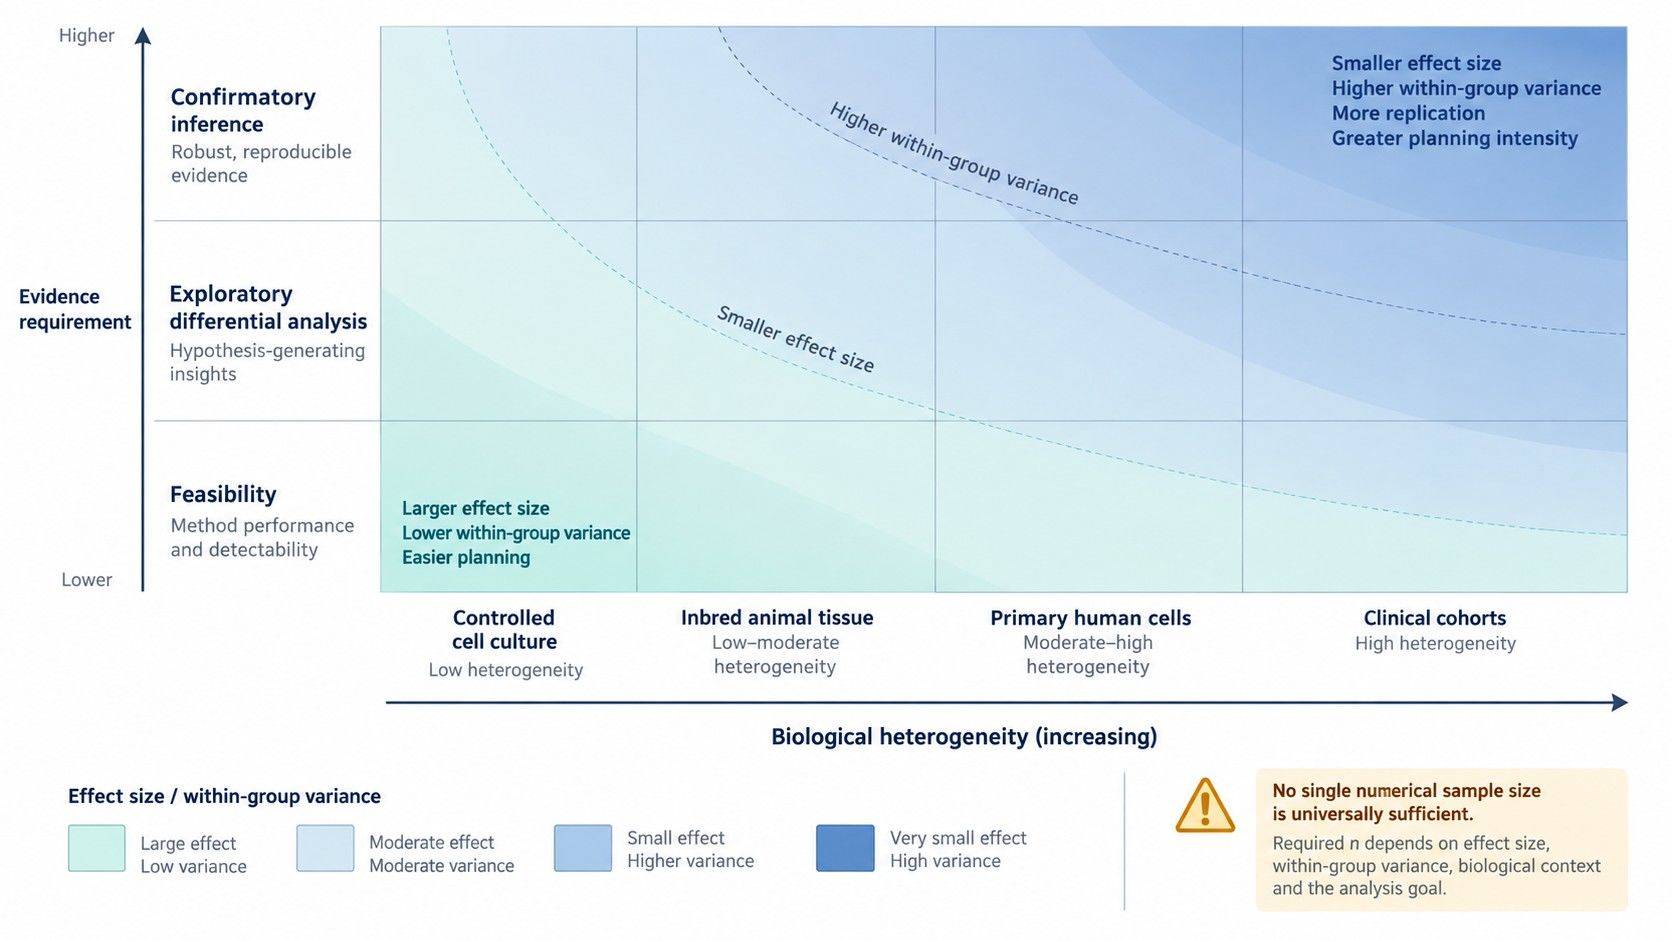 Figure 1. Sample-size planning matrix linking biological heterogeneity, effect size, and the level of inference expected from a DIA proteomics study.
Pilot Studies for Technical Feasibility and Variance Estimation
A pilot should answer whether the planned analytical and statistical design is feasible. It should not be used to promise that the same effect will occur in the full study.
Technical Feasibility Pilot
A small set of representative specimens can reveal whether the proposed extraction, digestion, LC-MS method, and database-search workflow are compatible with the matrix. Useful outputs include peptide yield, identification depth, precursor-level completeness, retention-time stability, pooled-QC behavior, preparation failures, and the distribution of protein-level CVs.
Three to five specimens per condition may be enough to expose gross technical problems, but the resulting biological variance estimate is uncertain—especially in human cohorts. Its role should be described as preliminary. For heterogeneous studies, historical data from a comparable matrix or a larger variance-estimation pilot is preferable.
Variance-Estimation Pilot
The pilot dataset used for power planning should preserve the intended main-study design. Paired studies require paired pilot data; repeated-measures studies require observations across the relevant time structure. Variance estimated from pooled QC injections cannot substitute for between-subject variance.
At minimum, the planning dataset should include:
- the experimental unit and pairing or blocking variables;
- protein or peptide abundance on the analysis scale, usually log2 intensity;
- missingness by sample and abundance range;
- technical and biological variance components where both are available;
- the proposed primary contrast;
- the smallest effect of interest;
- the planned FDR and target power;
- the expected sample-exclusion and attrition rate.
MSstats supports group-comparison, paired, time-course, and other structured designs and can use model-derived variance components to relate fold change, FDR, power, and biological replicate number [2–4]. A common planning target is 80% power (1 − β = 0.80) with FDR controlled at 0.05, but those settings do not determine sample size without an empirical variance estimate and a smallest effect of interest. Under a simplified equal-variance approximation on the log2 scale, detecting a 1.25-fold change instead of a 2.0-fold change can require roughly 9.6 times as many observations because sample size scales approximately with the inverse square of the effect. Actual MSstats estimates may differ because they also reflect protein-specific variance, missingness, model structure, and multiplicity. Because variance estimates from small pilots can be unstable, the output should be presented as a curve or range across plausible variance scenarios—not as a precise guarantee that one integer is correct.
Biological Replicates vs. Proteome Depth Under a Fixed Budget
A common design problem is whether limited instrument time should be spent on more biological samples, longer chromatographic gradients, offline fractionation, or repeated injections. The answer depends on the primary endpoint.
| Primary objective | Default allocation priority | Why | Important exception |
|---|---|---|---|
| Differential protein abundance between groups | Independent biological replicates after minimum analytical performance is met | Reduces uncertainty about population-level effects and improves estimation of biological variance | If the current method fails to measure the pathway or abundance range required for the endpoint |
| Broad proteome catalog from one specimen type | Longer gradients, fractionation, or complementary acquisition | Increases peptide separation and access to lower-abundance proteins | Catalog depth does not create independent evidence for group differences |
| Low-abundance PTM or rare peptide discovery | Enrichment, fractionation, and targeted acquisition may take priority | The analyte may be absent from a standard single-shot measurement | Main-study comparisons still require biological replication after feasibility is established |
| Large clinical cohort | Throughput, stable single-shot DIA or SWATH-MS, pooled QC, and balanced batches | Preserves comparability across many runs and limits calendar-time drift | Selected samples can be profiled more deeply in a nested pilot if the purpose is predefined |
| Candidate verification | Targeted PRM/MRM with independent specimens | Focuses instrument time on a justified peptide panel | Assay development and validation effort must be budgeted separately |
For a differential study, extensive per-sample fractionation multiplies run count and can reduce the number of independent specimens that fit within the same budget. A longer gradient may add identifications, but it should be justified by gains in the proteins or pathways relevant to the primary endpoint. A practical design is often a short method-development phase followed by one qualified acquisition method for the full cohort.
Where ion mobility improves selectivity or low-input performance, 4D-DIA quantitative proteomics may change the depth-throughput frontier. It does not change the statistical distinction between measuring more features in one sample and observing more independent biological units.
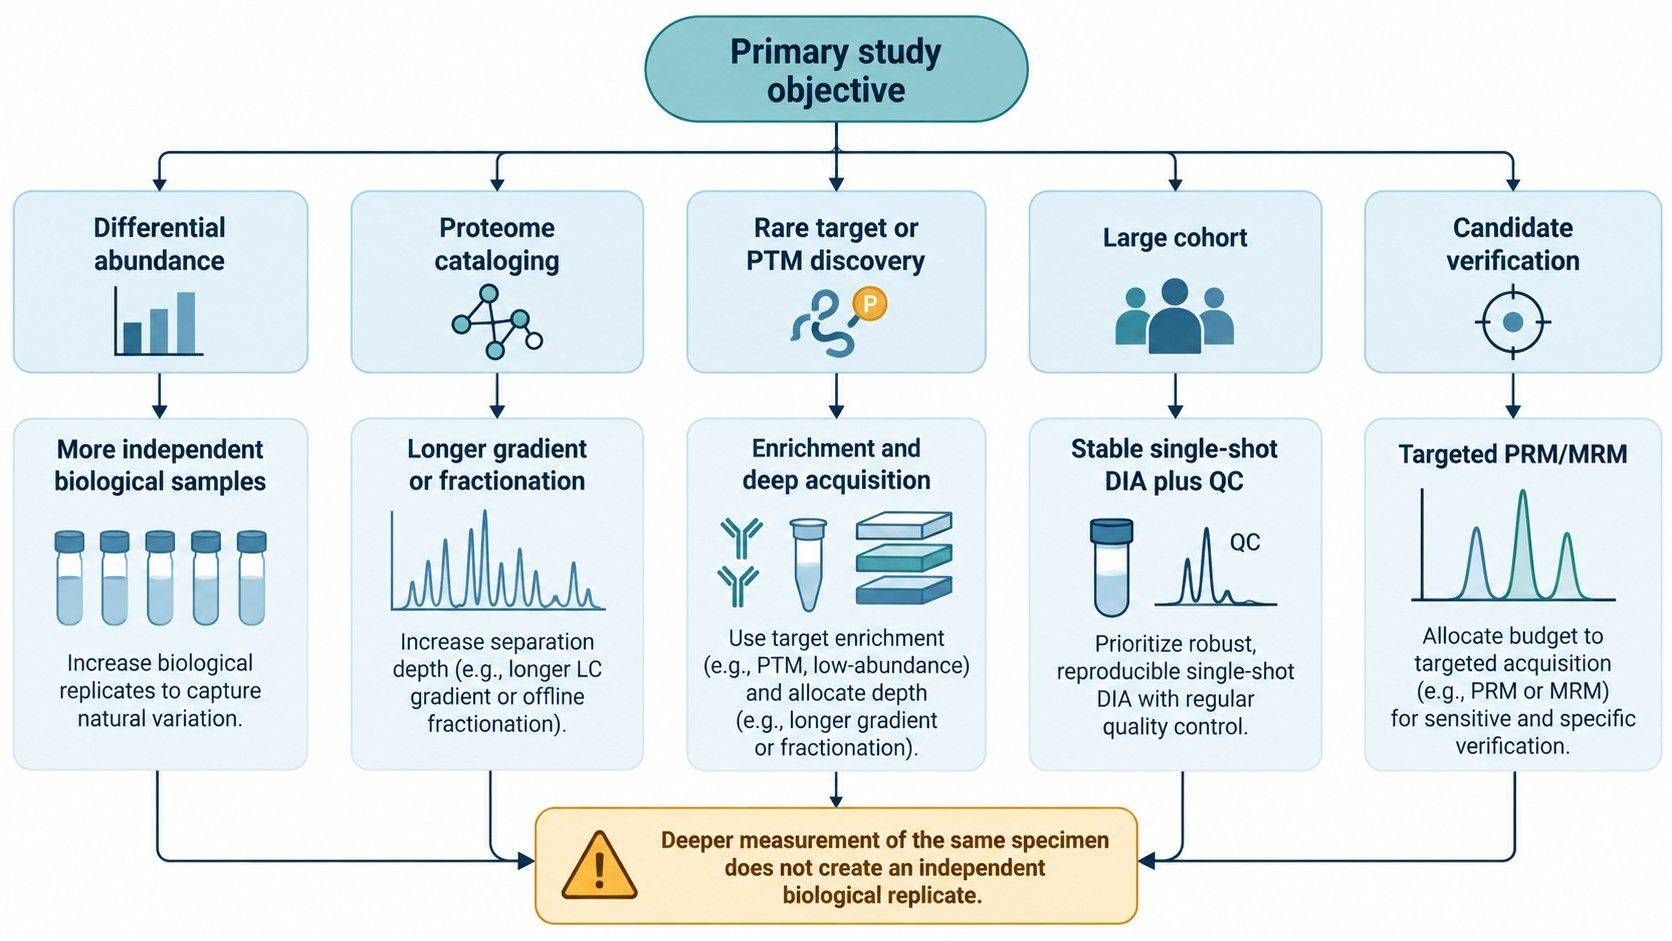 Figure 2. Budget-allocation framework for choosing among biological replication, chromatographic depth, fractionation, and targeted follow-up.
Batch-Effect Control: Randomization, Blocking, and Pooled QC
Adding samples does not repair confounding. If every control is prepared on one day and every treated sample on another, condition and batch cannot be separated statistically. A nominally large study can therefore have an effective sample size close to one batch per condition.
Batch Randomization for DIA Proteomics
Each preparation and LC-MS batch should contain a balanced representation of the primary groups. Randomization should account for variables that can affect abundance profiles, including sex, age, collection center, treatment order, operator, plate, extraction day, and storage duration. For paired specimens, members of a pair should remain close enough in processing and acquisition order to limit differential drift, while the order within each pair can be randomized.
Pooled QC material is useful for tracking preparation and instrument stability but is not a biological replicate. QC injections should be scheduled at defined intervals and evaluated against prespecified trends such as retention-time drift, signal loss, identification rate, or global intensity deviation. Blank injections should be positioned where carryover risk is greatest.
Blocking Factors in Proteomics Study Design
Blocking improves precision when a known source of variation can be represented across conditions. A mouse experiment may block by litter or cage; a multicenter clinical study may block by collection site; a cell study may block by experiment date. The blocking variable must be recorded and incorporated into the model. Blocking cannot rescue a variable that is perfectly aligned with the biological condition.
Statistical Analysis Plan for DIA Proteomics
Before sample preparation begins, the project team should be able to state the following in operational terms:
- What is the experimental unit?
- What is the primary contrast, and which secondary contrasts are exploratory?
- What fold change is small enough to matter biologically?
- Which variance estimate supports the sample-size range?
- How are pairing, repeated measures, covariates, and batches represented?
- What constitutes an analytical failure or sample exclusion?
- How will missing values be characterized and handled?
- Which multiplicity procedure and FDR threshold will be used?
- Is the project designed for discovery, verification, or both?
These choices should be frozen before inspecting group labels in the final dataset. If the study includes an unbiased discovery stage followed by a short candidate list, reserve independent specimens for confirmation. Reusing the discovery cohort for both selection and performance estimation produces optimistic evidence.
A broad discovery question can be addressed through discovery proteomics, whereas a prespecified panel may warrant targeted measurement. The analytical route should follow the claim: discovery estimates which proteins may differ; targeted assays test whether selected peptide signals can be measured with the required specificity and precision in the intended matrix.
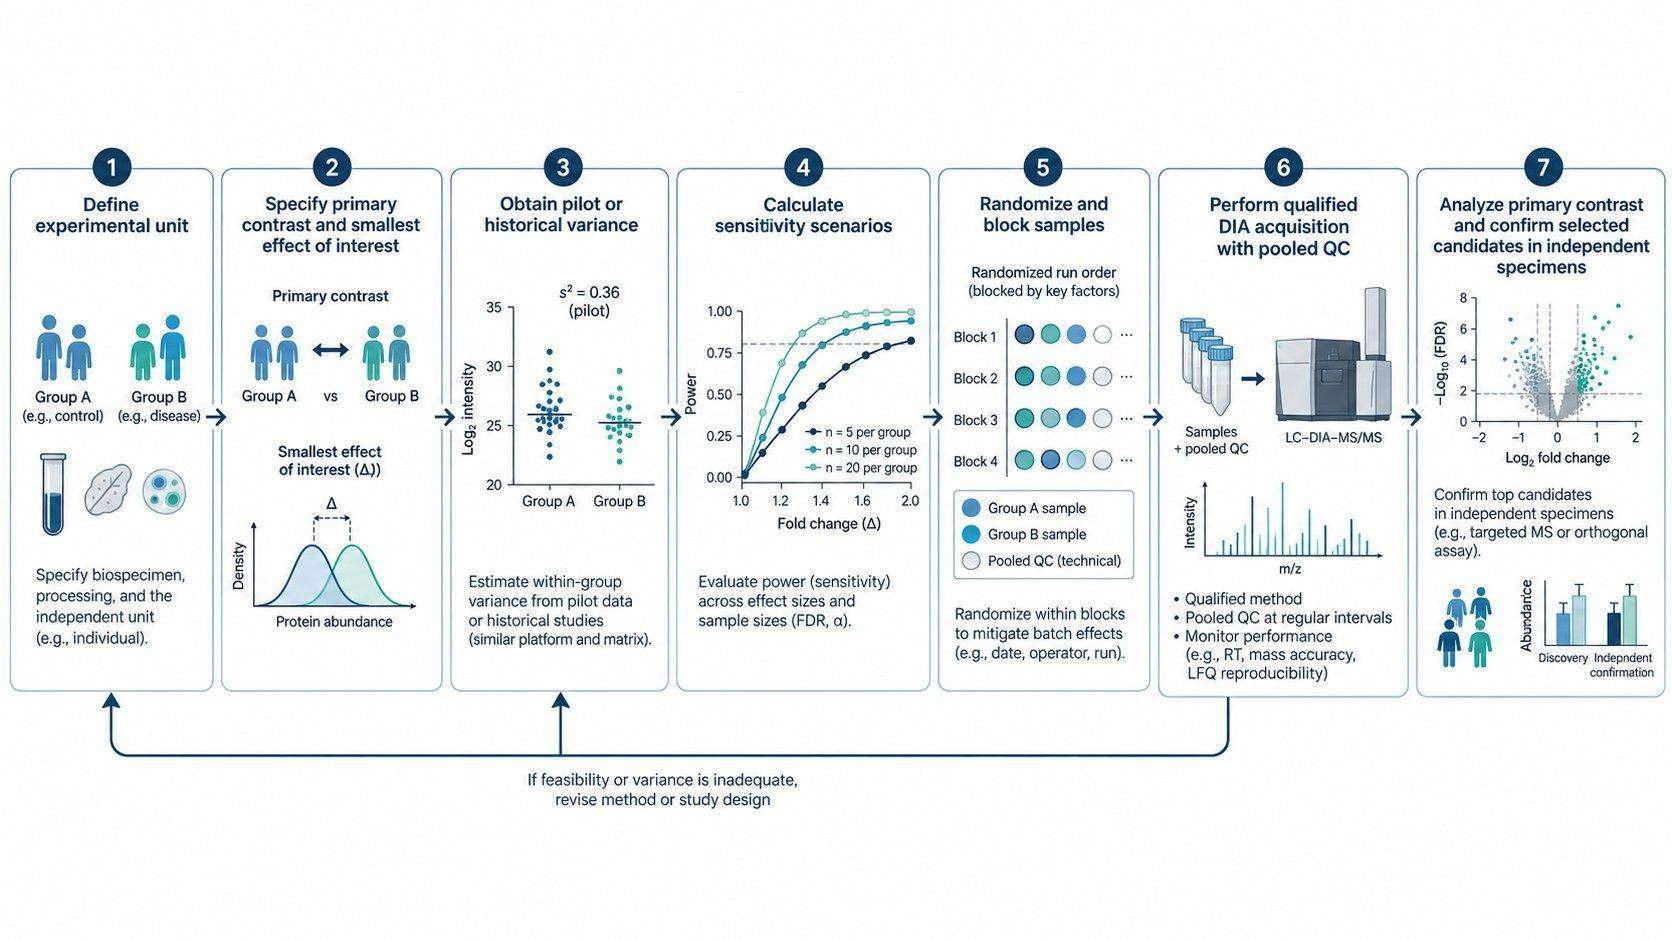 Figure 3. Study-design sequence from experimental-unit definition and pilot variance through randomization, DIA acquisition, and independent confirmation.
DIA Proteomics Study Design Checklist
A complete design package does not need to be lengthy, but it must connect the biological question to acquisition and analysis decisions that can be audited. Before samples enter preparation, the following elements should be fixed or assigned a controlled revision process:
- the independent experimental unit, recruitment or culture structure, and expected attrition;
- the primary contrast, smallest biologically relevant effect, target power, and multiplicity strategy;
- the empirical source of variance and the sensitivity range used when that estimate is uncertain;
- the allocation of samples across preparation plates and LC-MS batches, including pooled QC and blank placement;
- exclusion criteria, missing-value diagnostics, normalization and model structure, and the role of any independent confirmation cohort.
The final sample-size justification should be written as a conditional design statement rather than a universal replicate rule. It should show how the required number of independent units changes when variance, effect size, FDR, power, or attrition assumptions change. This makes the design reviewable before acquisition and prevents post hoc analytical choices from substituting for adequate biological replication.
For studies that need a coordinated feasibility pilot, batch plan, and cohort-scale acquisition strategy, a DIA quantitative proteomics service consultation can translate the variance scenarios and biological endpoints into an executable sample manifest and QC plan.
References:
- Yarbro JM, Huang Y, Pagala V, et al. Ground Truth-Based Evaluation of False Discovery Rate and Statistical Power in DIA Proteomics. bioRxiv. 2026. Preprint. DOI: 10.64898/2026.05.29.728747.
- Oberg AL, Vitek O. Statistical Design of Quantitative Mass Spectrometry-Based Proteomic Experiments. Journal of Proteome Research. 2009;8(5):2144–2156. DOI: 10.1021/pr8010099.
- Choi M, Chang CY, Clough T, et al. MSstats: an R package for statistical analysis of quantitative mass spectrometry-based proteomic experiments. Bioinformatics. 2014;30(17):2524–2526. DOI: 10.1093/bioinformatics/btu305.
- Kohler D, Staniak M, Tsai TH, et al. MSstats Version 4.0: Statistical Analyses of Quantitative Mass Spectrometry-Based Proteomic Experiments with Chromatography-Based Quantification at Scale. Journal of Proteome Research. 2023;22(5):1466–1482. DOI: 10.1021/acs.jproteome.2c00834.
- Wagner MR, Kleiner M. How thoughtful experimental design can empower biologists in the omics era. Nature Communications. 2025;16:7263. DOI: 10.1038/s41467-025-62616-x.
 4D Proteomics with Data-Independent Acquisition (DIA)