
Pulse SILAC for Degrader Studies: Distinguishing Protein Degradation from Resynthesis
In targeted protein degradation (TPD) programs utilizing proteolysis targeting chimeras (PROTACs), molecular glues, and lysosome-targeting chimeras (LYTACs), drug discovery teams routinely evaluate compound potency by measuring net target depletion via western blotting, capillary electrophoresis, or steady-state quantitative mass spectrometry. However, net steady-state abundance represents a composite equilibrium between two opposing metabolic velocities: the rate of target clearance (kdeg) and the rate of newly synthesized protein translation (ksyn).
A conventional endpoint measurement that demonstrates a modest 30% reduction in total target abundance cannot determine whether the degrader molecule suffers from poor catalytic turnover, or whether it drives rapid, potent target proteolysis that triggers an immediate, compensatory transcriptional and translational feedback rebound. Conversely, apparent compound failure, sub-maximal degradation (Dmax), or rapid target recovery during drug washout experiments frequently stems from robust baseline protein turnover rather than insufficient ternary complex formation.
Pulse stable isotope labeling by amino acids in cell culture (pulse SILAC or pSILAC) directly resolves this fundamental analytical ambiguity. By introducing heavy-isotope-labeled amino acids for defined metabolic windows, pulse SILAC physically bifurcates the intracellular proteome into pre-existing (unlabeled light or medium-labeled) and newly synthesized (heavy-labeled) populations. This isotope deconvolution enables independent, proteome-wide quantification of true degradation velocities, compensatory synthesis rates, and target half-lives (t1/2) without perturbing cellular physiology.
Core Decision Takeaway for Degrader Optimization: Total protein abundance is a lagging, composite readout. When an active degrader triggers homeostatic resynthesis, steady-state depletion underestimates true target proteolysis. Pulse SILAC decouples kdeg from ksyn within a single mass spectrometry experiment, distinguishing genuine catalytic failure from rapid biological rebound.
Biophysical Mechanisms and Analytical Failure Modes in Degrader Profiling
Event-driven pharmacology: the Hook effect, cooperativity, and basal proteostasis
Unlike conventional small-molecule inhibitors that operate through occupancy-driven pharmacology, targeted protein degraders function via event-driven pharmacology. A single degrader molecule binds both a target protein of interest (POI) and an E3 ubiquitin ligase (such as cereblon [CRBN], von Hippel-Lindau [VHL], or MDM2), inducing the formation of a transient, catalytically productive ternary complex:
POI + Degrader + E3 ⇌ [POI · Degrader · E3] → Ubiquitinated POI + Degrader + E3
Following recruitment, an E2 conjugating enzyme transfers multiple ubiquitin moieties onto accessible lysine residues on the POI surface. Once tagged with a polyubiquitin chain (typically linked via Lys48 or Lys11), the substrate is recognized and degraded by the 26S proteasome, while the degrader molecule dissociates intact to engage another target molecule.
This catalytic mode of action introduces several unique pharmacokinetic-pharmacodynamic (PK-PD) complexities that cannot be interpreted through steady-state protein measurements alone:
- The Hook Effect (Two-Body vs. Three-Body Equilibria): At elevated degrader concentrations, binary complexes ([POI · Degrader] and [E3 · Degrader]) outcompete ternary complex assembly, leading to loss of degradation efficiency. Without resolving the underlying degradation rate constant (kdeg), researchers cannot distinguish whether a diminishing response at high doses represents the Hook effect, solubility limitations, or compound cytotoxicity.
- Cooperativity vs. Degradation Velocity: Strong ternary complex binding affinity (positive cooperativity, α > 1) does not necessarily correlate with high degradation velocity. The spatial orientation of lysine residues on the target relative to the catalytic site of the E2/E3 complex dictates whether ubiquitin transfer occurs efficiently (kcat). A stable ternary complex with poor geometric positioning can act as a competitive inhibitor rather than an active degrader.
- Target Vulnerability and Basal Proteostasis: The cellular outcome of degradation depends heavily on the target's intrinsic baseline half-life and cellular demand. If a target is transcribed and translated at a rate higher than the catalytic clearing capacity of the available E3 ligase pool, the total cellular abundance will appear virtually unchanged despite high degradation flux.
Why steady-state abundance masks compensatory resynthesis
When degraders target master transcription factors (e.g., BRD4, AR, ER, or IKZF1/3), epigenetic modifiers (e.g., HDACs, SMARCA2/4), or kinases in feedback-regulated signaling cascades (e.g., MEK/ERK, AKT/mTOR), the rapid depletion of the target relieves auto-inhibitory transcriptional checkpoints or activates acute cellular stress responses. The cell responds by upregulating target gene transcription and accelerating mRNA translation.
In a steady-state measurement, the instrument captures only the net sum of pre-existing and newly translated molecules: [P]total = [P]pre-existing + [P]new. If a compound accelerates target degradation by 5-fold, but compensatory transcriptional feedback simultaneously increases protein translation by 4-fold, the measured steady-state reduction in total target abundance will be a modest 20%, leading the project team to discard a highly potent degrader candidate.
Ribotoxic stress and half-life distortion in cycloheximide chase
To prevent resynthesis from confounding degradation measurements, researchers historically treated cells with cycloheximide (CHX) to freeze translational elongation, tracking the disappearance of the target protein over time. However, chemical translational arrest severely alters cell physiology:
- Ubiquitin Homeostasis Depletion: The synthesis of free ubiquitin monomers and ubiquitin-precursor proteins ceases, leading to depletion of the free ubiquitin pool within 60–120 minutes.
- E3 Ligase and Chaperone Exhaustion: Many E3 ligases and proteasome regulatory subunits are themselves short-lived proteins with half-lives of less than 2 hours. Inhibiting their translation rapidly reduces degradation capacity.
- Activation of the Integrated Stress Response (ISR): CHX treatment induces ribotoxic stress kinase activation (ZAKα, GCN2), extensive translational stalling, and acute apoptosis, confounding quantitative interpretation.
Consequently, half-life values obtained via cycloheximide chase frequently deviate by several hundred percent from true physiological turnover rates.
Rebound ambiguity following compound clearance
During preclinical lead characterization, determining target recovery kinetics following drug washout is essential to guide in vivo dosing regimens. When a target protein rapidly recovers within 6–12 hours after compound removal, steady-state profiling cannot establish whether the recovery reflects rapid nascent translation driven by high baseline turnover, or whether the compound dissociated prematurely from the target. Conversely, slow recovery could indicate long target residence times or prolonged downstream transcriptional repression.
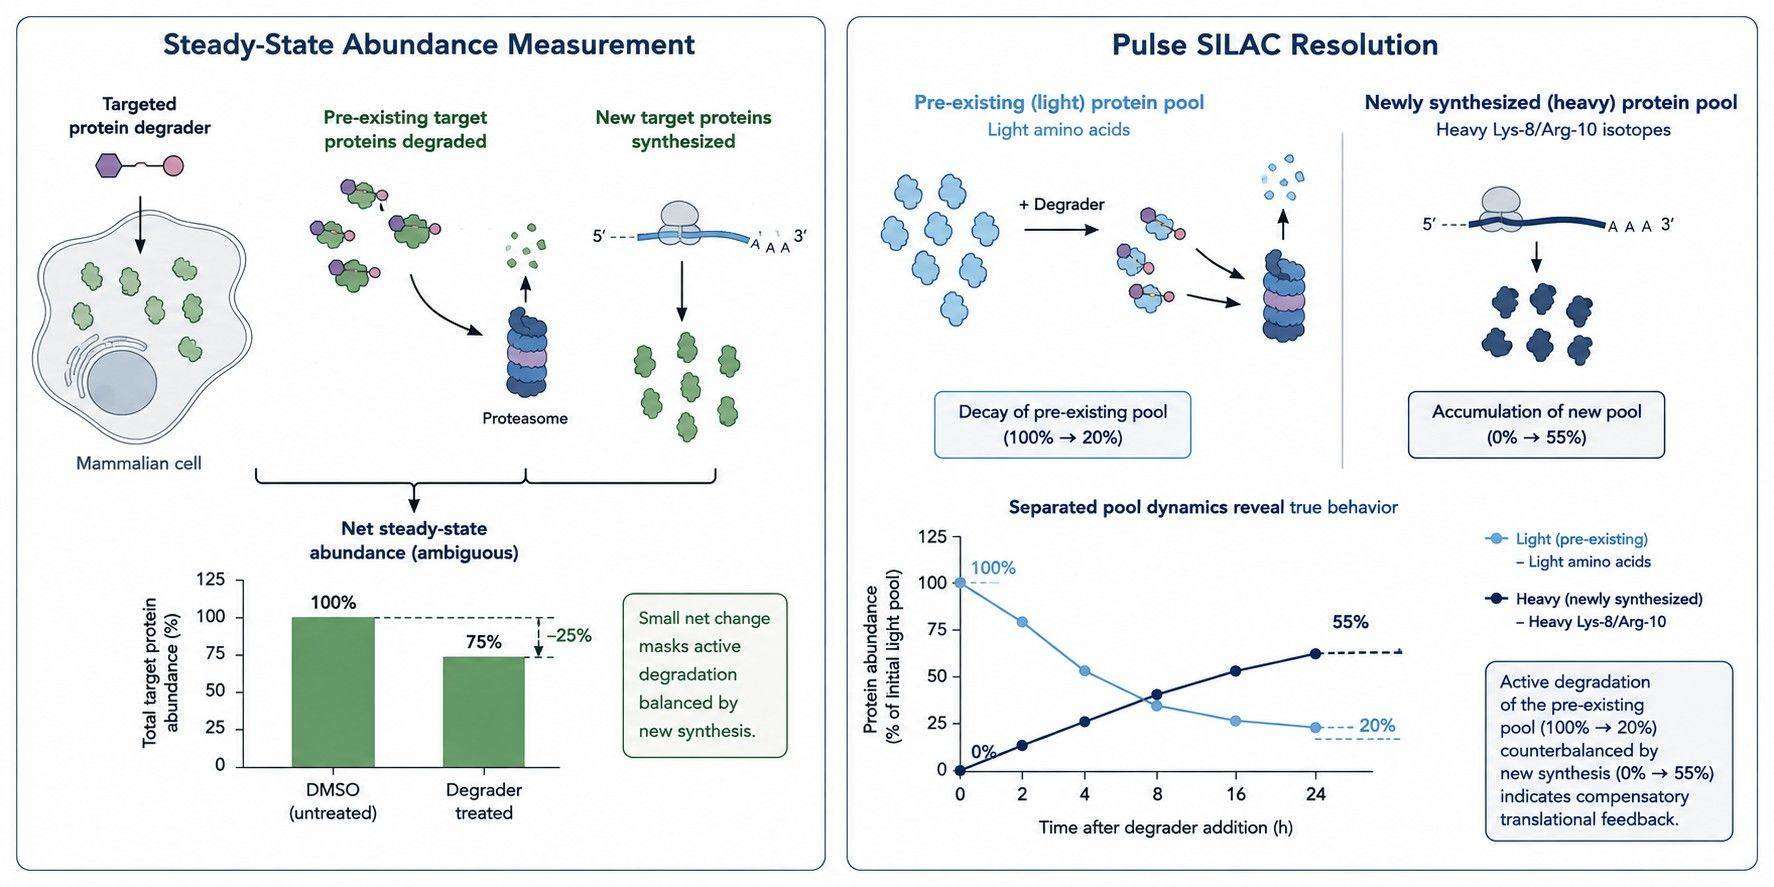 Figure 1. Decoupling target degradation from compensatory resynthesis. Steady-state measurements conflate pre-existing target loss with nascent translation, masking compound efficacy.
Method Selection: Evaluating Technologies for Protein Turnover Measurement
Before committing precious compound stocks and biological models to an experimental campaign, researchers must evaluate which protein turnover technology aligns with their analytical throughput, temporal resolution, and biological requirements.
| Feature / Metric | Steady-State TMT / DIA | Cycloheximide (CHX) Chase | HaloTag / dTAG Systems | Bioorthogonal Nascent (AHA) | Pulse SILAC (pSILAC) MS |
|---|---|---|---|---|---|
| Primary Metric | Endpoint relative abundance ([P]t / [P]0) | Apparent clearance rate under global translational arrest | Optical fluorescence decay kinetics (promoter-driven) | Newly synthesized protein enrichment ratio | Simultaneous true rate constants: kdeg, ksyn, and t1/2 |
| Cellular Perturbation | Minimal (compound exposure only) | Severe (acute ribotoxic stress and ubiquitin exhaustion) | Genetic modification required (overexpression artifacts) | Moderate (methionine starvation and analog stress) | Undisturbed physiological state (non-toxic stable isotope tracers) |
| Resolution of Resynthesis | None (completely conflated) | Zero (translation artificially blocked) | Moderate (depends on dual-fluorophore systems) | High (nascent pool isolated via affinity enrichment) | Complete (resolved in precursor mass spectra without enrichment) |
| Proteome-Wide Breadth | High (>8,000–10,000 proteins) | Low (typically single-target Western blot) | Single-target only (requires engineered cell line) | Moderate (enrichment-dependent; >2,000–4,000 proteins) | Deep discovery (>6,000–9,000 proteins) or focused targeted PRM |
| Endogenous Compatibility | Full (native untagged cell models) | Full (native untagged cell models) | None (requires knock-in or transgenic tagging) | Full (native untagged cell models) | Full (native untagged cell models) |
| Kinetic Modeling Rigor | None (violates non-steady-state rules) | Moderate (measures net decay only) | Moderate (often confounded by promoter expression) | Moderate (measures synthesis pulse only) | High (fits non-steady-state differential equations) |
Where initial high-throughput compound ranking is the immediate priority, teams frequently utilize SILAC protein degrader efficacy screening assays. However, when resolving subtle potency differences, establishing mechanistic causality, or characterizing lead molecules for IND-enabling studies, dynamic pulse SILAC provides the necessary analytical resolution.
Pulse SILAC Experimental Design and Labeling Architectures
Implementing a successful pulse SILAC study requires selecting an isotopic labeling scheme that matches the anticipated degradation velocity of the target and the pharmacological profile of the compound.
| Architecture | Labeling Strategy | Best Suited For | Primary Strength | Decision-Limiting Consideration |
|---|---|---|---|---|
| Forward Pulse SILAC | Cells grown in Light medium; switched to Heavy medium (13C6, 15N2-Lys / 13C6, 15N4-Arg) upon compound dosing | Acute degradation kinetics; short-lived proteins; fast-acting degraders (1–8 h) | Minimal cell pre-conditioning; directly captures nascent translation changes | Low heavy incorporation at very early time points requires high MS sensitivity |
| Reverse Pulse SILAC (Pulse-Chase) | Cells pre-labeled to >98% saturation in Heavy medium; switched to Light medium with compound | Stable targets; long baseline half-lives (t1/2 > 16 h); prolonged dosing | Measures pure pre-existing decay without interference from nascent translation | Requires 5–7 doublings in heavy media prior to treatment, increasing cost |
| Dual-Pulse (Quasi-Three-Plex) | Light baseline; Vehicle pulsed with Medium isotopes (13C6-Lys / 13C6-Arg); Degrader pulsed with Heavy isotopes | Direct vehicle-vs-degrader comparative quantification; multiplexed runs | Minimizes run-to-run LC-MS drift; direct intra-scan H/M ratio calculation | Complex three-channel MS spectra; potential isotopic envelope overlaps |
Forward pulse SILAC for acute degradation and nascent translation
In the forward pulse configuration, cells are initially cultured in standard light growth medium containing natural isotopic abundance amino acids (12C6, 14N2-L-Lysine and 12C6, 14N4-L-Arginine). At time zero (t = 0), the light medium is rapidly removed, the cell monolayer is rinsed with pre-warmed PBS or isotope-free base medium, and the cells are replenished with heavy medium containing 13C6, 15N2-L-Lysine (Lys-8, +8.0142 Da) and 13C6, 15N4-L-Arginine (Arg-10, +10.0083 Da) formulated with dialyzed FBS, simultaneously with the addition of the degrader compound or vehicle control:
- Analytical Readout: The exponential disappearance of the light chromatographic peak (L) directly reflects the degradation velocity of the pre-existing protein pool synthesized prior to drug exposure. Concurrently, the progressive accumulation of the heavy chromatographic peak (H) quantifies nascent protein synthesis (ksyn).
- Application Window: Optimal for fast-acting degraders (e.g., BRD4, BTK, or IRAK4 degraders) and targets with baseline half-lives of less than 8 hours. Time points typically span 0.5, 1, 2, 4, 8, and 12 hours post-treatment.
Reverse pulse-chase SILAC for extended half-life targets
For targets with extensive baseline stability (t1/2 > 16–24 h) or slow-binding compounds requiring extended incubation, forward pulse labeling can suffer from low heavy-to-light (H/L) ratios during the early hours of incubation. In reverse pulse-chase SILAC, cells are pre-cultured in heavy SILAC medium for 5 to 7 population doublings until uniform isotopic saturation (>98% incorporation) is achieved, following established procedures for SILAC-based proteomics analysis:
- Analytical Readout: At t = 0, cells are washed and switched to light chase medium containing the degrader compound. The analytical focus shifts to measuring the pure exponential decay of the saturated heavy pool (H) without interference from newly translated proteins, which now incorporate light amino acids (L).
- Application Window: Essential for long-lived targets (e.g., structural proteins, mitochondrial enzymes, epigenetic regulators) and multi-day washout studies examining the durability of degradation.
Dual-pulse isotopic multiplexing for direct ratioing
To minimize sample preparation variability, run-to-run retention time drift, and electrospray ionization fluctuations, vehicle-treated and degrader-treated samples can be pulsed with distinct isotopic labels and multiplexed prior to digestion:
- Baseline Pool: Unlabeled light isotopes (12C6, 14N2-Lys, 12C6, 14N4-Arg).
- Vehicle Pulse: Medium isotopes (13C6, 14N2-L-Lysine [Lys-4, +4.0251 Da] and 13C6, 14N4-L-Arginine [Arg-6, +6.0201 Da]).
- Degrader Pulse: Heavy isotopes (13C6, 15N2-L-Lysine [Lys-8] and 13C6, 15N4-L-Arginine [Arg-10]).
Equal cell numbers or protein masses from vehicle (Medium) and degrader (Heavy) arms are combined immediately following cell lysis. In the resulting high-resolution mass spectra, the H/M ratio provides a direct, intra-scan readout of compound-induced nascent translation differences, while the shared L channel reflects the pre-existing pool clearance.
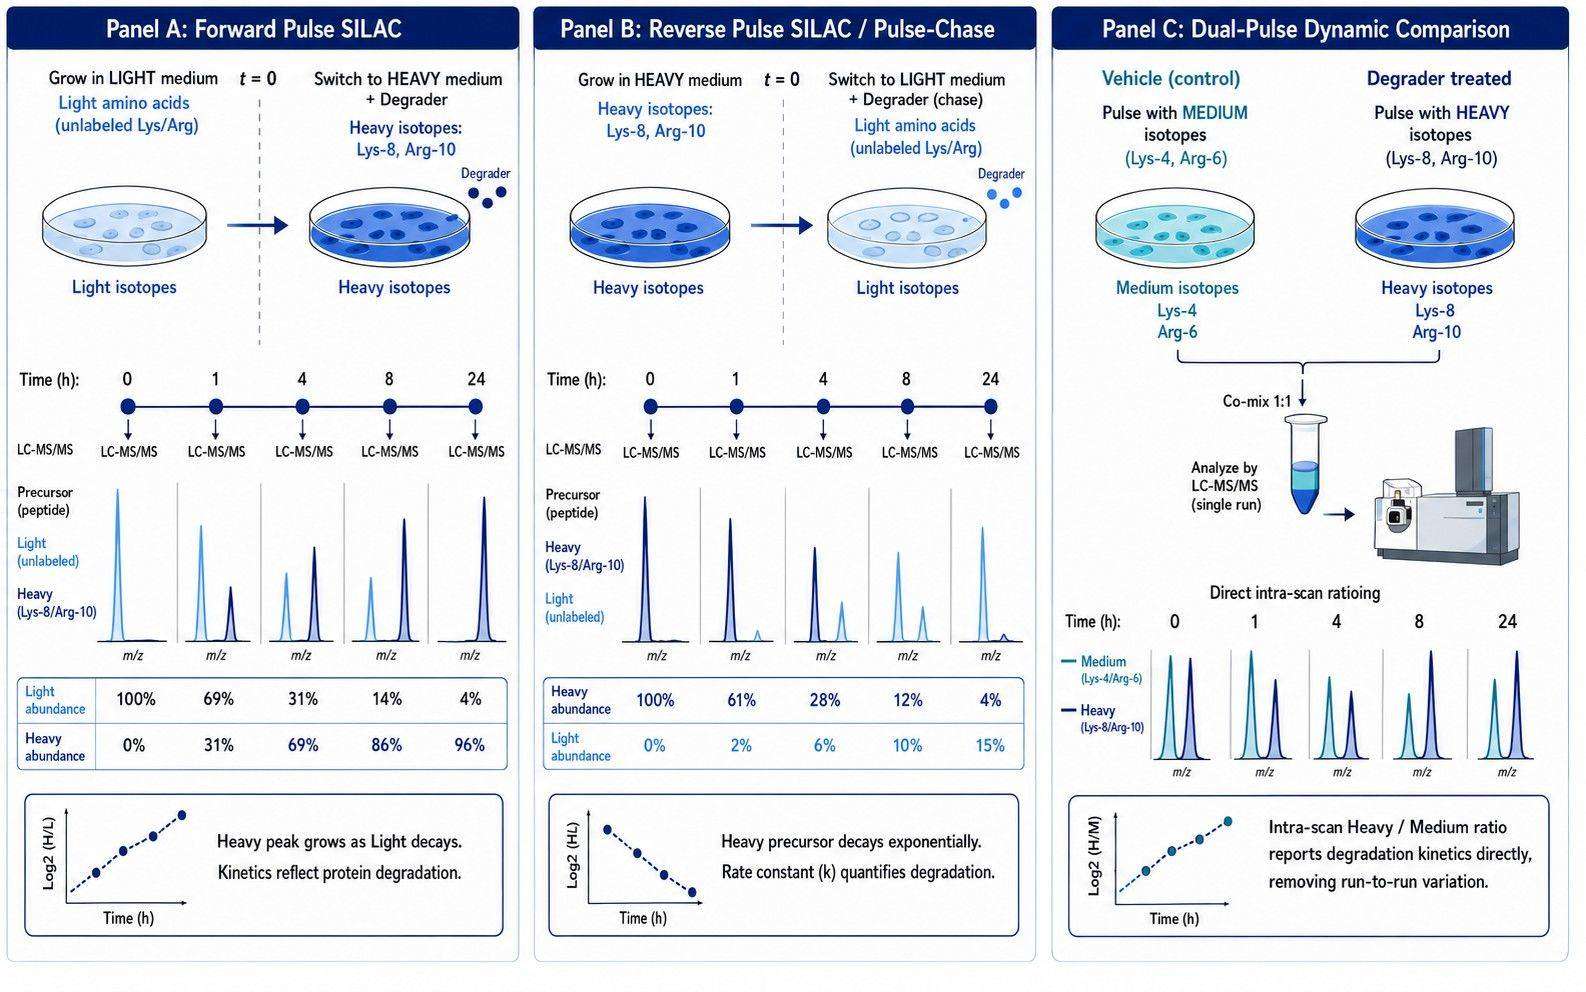 Figure 2. Experimental architectures of pulse SILAC in targeted protein degrader studies across acute, extended, and multiplexed comparative designs.
Mathematical Modeling and Rate Constant Extraction
Extracting accurate biological rate constants requires fitting quantitative mass spectrometry data to non-steady-state differential rate equations. Under standard physiological conditions, the rate of change of a target protein's concentration [P] is governed by:
d[P]/dt = ksyn - (kdeg + μ)[P]
where ksyn is the zero-order rate constant of protein translation (concentration · time-1), kdeg is the first-order rate constant of target degradation (time-1), and μ is the cellular growth rate or dilution constant (μ = ln(2) / tdoubling). For acute time-courses (t ≤ 8 h), cellular dilution is typically negligible (μ ≈ 0).
Modeling pre-existing pool clearance and target half-life
In forward pulse experiments, pre-existing protein molecules synthesized prior to isotope switching are uncoupled from new synthesis. Their disappearance follows first-order exponential decay: [P]pre(t) = [P](0) · e-(kdeg + μ)·t. Taking the natural logarithm transforms this into a linear relationship: ln([P]pre(t) / [P](0)) = -(kdeg + μ) · t.
Linear regression of the log-transformed light intensity ratios across time points yields the slope -(kdeg + μ). Once corrected for the measured cellular doubling rate μ, the target's apparent physiological half-life is calculated as:
t1/2 = ln(2) / kdeg
Modeling nascent protein accumulation and translational feedback
Concurrently, newly translated protein molecules incorporate the heavy isotope tracer: [P]new(t) = (ksyn / (kdeg + μ)) · (1 - e-(kdeg + μ)·t). For short pulse intervals where the incubation duration is significantly shorter than the target's half-life (t ≪ t1/2), the exponential term can be expanded via Taylor series (e-x ≈ 1 - x), simplifying the equation to:
[P]new(t) ≈ ksyn · t
Under these narrow labeling windows, the accumulation of the heavy signal is directly proportional to the rate of protein translation (ksyn), providing an unconfounded assessment of whether compound treatment accelerates or represses target translation.
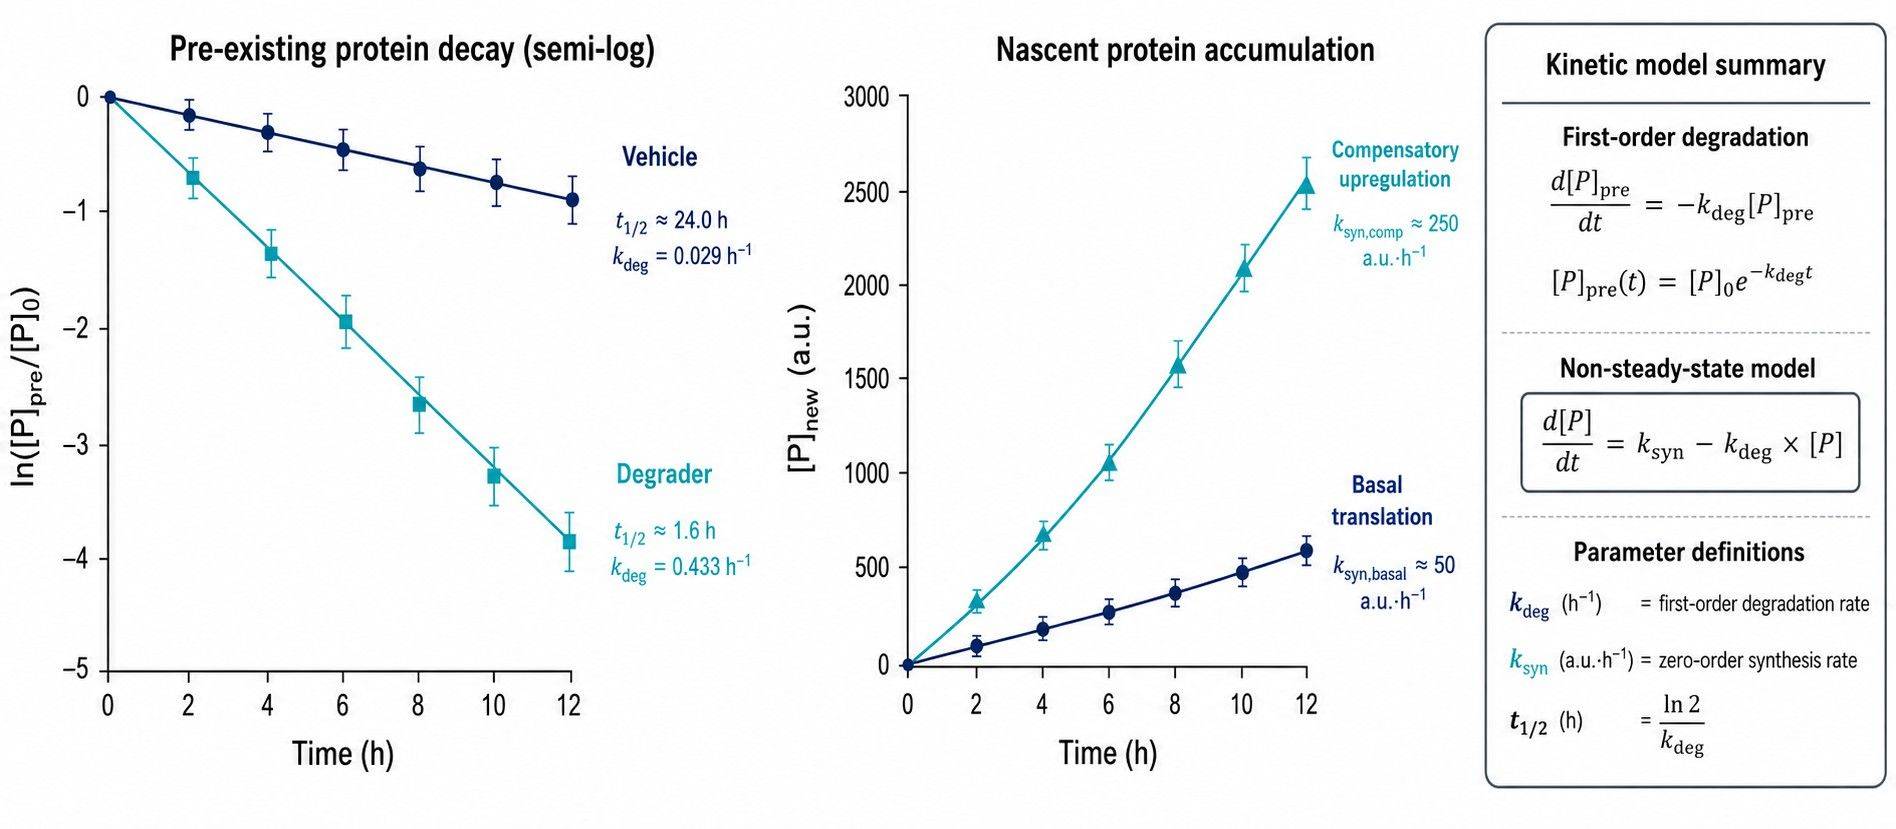 Figure 3. Kinetic deconvolution and rate constant extraction. Non-linear regression resolves degradation velocity (kdeg)
from nascent translation (ksyn).
Figure 3. Kinetic deconvolution and rate constant extraction. Non-linear regression resolves degradation velocity (kdeg)
from nascent translation (ksyn).
Pre-Analytical Controls, Amino Acid Pool Kinetics, and Quality Assurance
The fidelity of pulse SILAC measurements depends strictly on pre-analytical controls, cell culture rigor, and isotopic pool quality. Small technical artifacts in isotope handling can be misinterpreted as biological turnover shifts.
Correcting for precursor pool enrichment lag and proteolytic recycling
When growth media is exchanged, the intracellular pool of free amino acids does not instantaneously reach 100% heavy isotope saturation. Two physical phenomena introduce a temporal lag:
- Transport Kinetics: Cellular uptake of heavy lysine and arginine through cationic amino acid transporters requires time to equilibrate.
- Endogenous Proteolytic Recycling: Continuous proteasomal and lysosomal degradation of pre-existing, unlabeled proteins releases free light amino acids back into the cytoplasm, diluting the heavy amino acid pool.
The true fractional enrichment of the precursor pool over time, p(t), follows an exponential rise: p(t) = 1 - e-kaa·t, where kaa represents the amino acid turnover rate constant. Mathematical modeling corrects for this lag by calibrating p(t) against high-turnover reference peptides or measuring intracellular free amino acids via targeted LC-MS/MS, convoluting p(t) into the synthesis rate calculations.
Suppressing arginine-to-proline metabolic interconversion
In mammalian cell culture, cellular arginases can convert isotope-labeled L-arginine into ornithine and subsequently into L-proline, leading to heavy isotope incorporation into proline residues (+6.0138 Da). This causes splitting of isotopic mass envelopes, reduces chromatographic signal-to-noise, and compromises quantitative accuracy. Supplementing growth media with excess unlabeled L-proline (200–300 mg/L) completely suppresses this metabolic shunt through feedback inhibition.
Four-arm control architecture: inactive analogs and proteasome rescue
To establish that accelerated target decay is driven specifically by targeted ubiquitination and proteasomal clearance, every study design must incorporate a mandatory 4-arm control regimen:
| Study Arm | Formulation / Treatment | Primary QC Function | Expected Analytical Result |
|---|---|---|---|
| Arm 1: Vehicle Control | 0.1% DMSO + Heavy Pulse | Establishes basal protein degradation (kdeg, base) and translation (ksyn, base) | Baseline exponential decay; defines reference half-life (t1/2, base) |
| Arm 2: Degrader Compound | Active PROTAC/Glue + Heavy Pulse | Measures compound-accelerated degradation and translation response | Accelerated light decay (increased kdeg); nascent heavy accumulation |
| Arm 3: Inactive Analog Control | Non-binding enantiomer/diastereomer OR warhead-only competitor | Controls for off-target binding, non-specific transcription, and cellular toxicity | Decay kinetics and synthesis rates identical to Arm 1 (Vehicle) |
| Arm 4: Proteasome Rescue Arm | Active Degrader + Proteasome Inhibitor (Bortezomib / MG132) | Verifies ubiquitin-proteasome dependency of the observed degradation | Complete block of accelerated light decay; light signal restored to baseline |
Data Deconvolution, Biological Boundaries, and Targeted Validation
High-resolution LC-MS/MS acquisition: DDA vs. DIA-PASEF
Converting raw mass spectrometry data into validated rate constants requires high-resolution instrumentation and rigorous chromatographic peak integration:
- High-Resolution Data-Dependent Acquisition (DDA): Conducted on Orbitrap Exploris or Tribrid platforms. Enables deep peptide identification via high-resolution MS/MS (HCD) and accurate precursor area calculation. However, stochastic precursor selection can introduce missing values across longitudinal time-courses.
- Data-Independent Acquisition with Trapped Ion Mobility (DIA-PASEF): Implemented on timsTOF platforms. Combines high-speed precursor fragmentation with collisional cross section (CCS) alignment. DIA-PASEF provides data completeness across complex multi-timepoint studies, ensuring that low-intensity nascent heavy peaks are consistently quantified without missing values.
Decoupling on-target degradation from secondary pathway cascades
A primary advantage of discovery-scale pulse SILAC is its capacity to monitor the turnover kinetics of over 8,000 background proteins simultaneously. This proteome-wide view reveals critical off-target pharmacology:
- Direct Off-Target Degradation: Neo-substrate degradation (e.g., SALL4, ZFP91, or GSPT1) is identified by accelerated light decay curves matching the kinetics of the primary POI.
- Secondary Transcriptional Cascades: Downstream effector proteins exhibit elevated heavy synthesis (ksyn) without any acceleration in their baseline degradation rate (kdeg).
- Proteostasis Collapse: General proteotoxicity manifests as a global deceleration of protein degradation across hundreds of unrelated proteins.
Translating fractional turnover into absolute molecular flux via PRM
Pulse SILAC measures fractional turnover ratios. Converting fractional rates into absolute molecular velocities requires measuring absolute target copy numbers via targeted proteomics (PRM with heavy isotope-labeled synthetic peptide standards). Furthermore, accelerated turnover demonstrates compound-induced degradation but does not prove direct ternary complex assembly. Direct biophysical target engagement should be cross-validated using orthogonal platforms such as the NGPro™ platform or biophysical binding assays.
Technical Feasibility Protocol and Study Planning Checklist
Before initiating sample processing, research teams should execute the following stepwise feasibility protocol:
- Target Baseline Detectability: Confirm that the target protein yields at least 2–3 observable tryptic peptides in discovery LC-MS/MS without enrichment. Low-abundance targets (<500 copies/cell) require targeted PRM or immunoaffinity enrichment.
- Dialyzed Serum Growth Compatibility: Verify that cell doubling times, morphology, and target expression levels are stable across 48 hours of culture in 10% dFBS.
- Dosing Matrix Calibration: Calibrate degrader concentration series across 3–4 concentrations spanning the estimated binary KD, cellular DC50, and high-concentration Hook effect regime.
- Time-Point Distribution: Establish a minimum of 5 longitudinal sampling points tailored to target turnover (e.g., 0, 1, 2, 4, 8, 16 hours for medium targets; 0, 0.5, 1, 2, 4 hours for fast targets).
- Negative and Rescue Controls: Include vehicle (0.1% DMSO), structurally matched inactive analog, and proteasome inhibitor rescue arms (n = 3 biological replicates per condition).
- Post-Harvest Quenching SOP: Implement rapid cryogenic washing (<30 seconds with ice-cold PBS) to freeze metabolic activity instantly and prevent ex vivo target proteolysis during harvesting.
NGPro Support for Targeted Protein Degradation Programs
The NGPro™ platform connects deep discovery proteomics and high-precision targeted proteomics (PRM/MRM) for targeted protein degradation programs. From metabolic pulse labeling design and dialyzed serum optimization to nanoLC-MS/MS data acquisition on Orbitrap Exploris and timsTOF platforms, our technical team assists with labeling window selection, precursor pool lag modeling, and kinetic rate deconvolution.
To confirm the mechanistic cascade, our analytical pipeline integrates upstream DIA-MS ubiquitinome analysis to map specific ubiquitinated lysine residues prior to proteasomal degradation, providing an end-to-end evidence package for degrader characterization.
Contact our technical team to discuss your targeted degrader program, evaluate cell line feasibility in dialyzed media, and design a customized pulse SILAC turnover study.
Frequently Asked Questions
References
- Schwanhäusser, B. et al. Global quantification of mammalian gene expression control. Nature. 2011;473:337–342.
- Savitski, M. M. et al. Tracking cancer drugs in living cells by thermal profiling of the proteome. Science. 2014;346:1255784.
- Winter, G. E. et al. Phthalimide conjugations promote the degradation of aberrant transcription factors. Science. 2015;348:1376–1381.
- Doherty, M. K. et al. Turnover of the human proteome: determination of protein half-lives by dynamic SILAC. J. Proteome Res. 2009;8:104–112.
- Cambridge, S. B. et al. Systems-wide proteomic analysis in mammalian cells reveals conserved, stoichiometric protein turnover during cell cycle progression. Cell Rep. 2011;1:383–394.
- Zecha, J. et al. Peptide level turnover measurements enable the study of proteoform dynamics. Mol. Cell. Proteomics. 2018;17:974–992.
- Donovan, K. A. et al. Mapping the modularity of molecular glue-induced target degradation. Cell. 2020;183:986–1000.
 4D Proteomics with Data-Independent Acquisition (DIA)