Liquid chromatography-mass spectrometry (LC-MS), a powerful analytical technique, combines liquid chromatography as the separation system and mass spectrometry as the detection system. In this process, samples undergo separation in the chromatographic section with the mobile phase. After ionization, the mass analyzer of the mass spectrometer separates ion fragments based on their mass-to-charge ratio, generating a mass spectrum. The coupling of liquid chromatography and mass spectrometry capitalizes on the complementary strengths of both techniques, merging the high separation capability of chromatography for complex samples with the high selectivity, sensitivity, and structural information provided by MS. LC-MS finds extensive applications in areas such as pharmaceutical analysis, food analysis, and environmental analysis.
Advantages of LC-MS Technology
Wide Analytical Range: MS can detect virtually all compounds, overcoming challenges in analyzing thermally unstable compounds.
Strong Separation Capability: Even if the analyzed mixture is not completely separated on the chromatogram, the characteristic ion mass chromatogram from MS enables the differentiation of individual components for qualitative and quantitative analysis.
Reliable Qualitative Analysis: LC-MS provides molecular weight and rich structural information simultaneously for each component, ensuring reliable qualitative results.
Low Detection Limits: With high sensitivity, MS significantly lowers detection limits. The use of Selected Ion Monitoring (SIM) further enhances detection capabilities by an order of magnitude or more.
Rapid Analysis: HPLC-MS employs narrow-bore columns, reducing analysis time and improving separation efficiency.
High Automation Level: HPLC-MS boasts a high degree of automation, streamlining analytical processes.
Targeted LC-MS Plant Metabolomics
Unlock precise insights into plant metabolism with our LC-MS targeted plant metabolomics services. We specialize in the individual detection and quantification of specific metabolites including nucleotides, flavonoids, alkaloids, amino acids, and more. Our tailored approach allows for a focused analysis, providing detailed information on the targeted compounds of interest. Benefit from:
- Focused Analysis: Concentrate on specific metabolites relevant to your research goals.
- Quantitative Precision: Accurate quantification facilitated by isotopically labeled internal standards and rigorous calibration.
- Customized Solutions: Tailored methodologies based on the unique characteristics of your plant samples.
Untargeted LC-MS Plant Metabolomics
Explore the full spectrum of plant metabolism with our LC-MS untargeted plant metabolomics services. Ideal for comprehensive metabolomics studies, this approach covers a wide range of metabolites, offering a holistic view of the plant's biochemical landscape. Our services encompass:
- Broad Metabolite Coverage: Capture a diverse array of metabolites, providing a global perspective on plant metabolism.
- Versatile Applications: Suitable for various plants including Arabidopsis, rice, tomato, corn, potato, and more.
- Data-Rich Insights: Uncover novel metabolites and patterns, contributing to a deeper understanding of plant responses to environmental stimuli.
Application of LC-MS in Plant Metabolomics
Metabolic Phenotype Analysis: Uncover the metabolic landscape of plants through our LC-MS services. We specialize in studying metabolic phenotype differences, providing detailed insights into the biochemical composition of various plant tissues. Understand how metabolite profiles change in response to developmental stages, environmental factors, or genetic modifications.
Transgenic Plant Safety Assessment: Assess the safety of transgenic plants with precision using LC-MS. Our services facilitate in-depth analysis of metabolite alterations in genetically modified plants, ensuring a thorough evaluation of their metabolic stability and safety. Trust us for comprehensive data crucial for regulatory compliance.
Biotic and Abiotic Stress Studies: Delve into the plant's response to both biotic and abiotic stresses. Our LC-MS services enable researchers to identify and quantify stress-induced metabolites, unraveling the intricate mechanisms plants employ to cope with challenges. This insight aids in developing stress-resistant crop varieties and enhancing agricultural resilience.
Plant Gene Function Identification: Facilitate gene function identification in plants through LC-MS. We offer targeted and untargeted metabolomics approaches to elucidate the roles of specific genes in plant metabolism. Unravel the biochemical pathways influenced by gene expression, contributing to a deeper understanding of plant biology.
Support for Plant Breeding: Enhance your plant breeding programs with our LC-MS expertise. Our services assist in identifying and selecting plant varieties with desirable metabolomic traits, expediting the breeding process. Gain a competitive edge in developing crops with improved nutritional profiles, resistance to stress, and enhanced overall performance.
Interpreting LC-MS Data
Data Interpretation Workflow
The process of interpreting LC-MS data is a nuanced journey that involves several key steps:
a. Peak Detection and Integration: The initial phase includes peak detection and integration. Peaks in the chromatogram represent individual metabolites. The integration of these peaks provides quantitative information about the abundance of each metabolite.
b. Mass Spectral Identification: Following peak integration, mass spectral identification takes center stage. Mass spectra offer a fingerprint of each metabolite, aiding in their accurate identification. High-resolution mass spectrometry is particularly valuable in resolving compounds with similar mass-to-charge ratios.
c. Retention Time Alignment: To enhance accuracy, retention time alignment is performed. This step ensures that peaks corresponding to the same metabolite across multiple samples are precisely aligned, facilitating comparative analysis.
d. Data Normalization: Normalization is crucial for accounting for variations in sample concentration and instrumental responses. It ensures that quantitative comparisons are valid and reflective of true biological differences.
Report Types and Formats
The interpretation of LC-MS data culminates in the generation of comprehensive reports. These reports, tailored to convey complex information in a digestible format, can take various forms:
a. Metabolite Profiling Reports: Metabolite profiling reports provide an overview of the identified metabolites, their relative abundances, and any discernible trends across samples. Graphical representations, such as heatmaps or volcano plots, offer visual insights into the data.
b. Pathway Enrichment Analyses: Pathway enrichment analyses illuminate the biological context by identifying metabolic pathways significantly impacted. These analyses often include pathway maps, highlighting key pathways and associated metabolites.
c. Concentration Trends: Detailed concentration trends of individual metabolites are crucial for understanding dynamic changes within the sample set. Line graphs or bar charts effectively convey concentration variations.
d. Quality Control Metrics: Reports may incorporate quality control metrics, ensuring the reliability of the data. Parameters such as signal-to-noise ratios, chromatographic peak shapes, and reproducibility measures contribute to the assessment of data quality.
Information Contained in Reports
Reports generated from LC-MS data interpretation are rich in information, encompassing:
a. Metabolite Identification: A comprehensive list of identified metabolites, including chemical formulas and mass spectra, facilitates a deeper understanding of the biochemical composition.
b. Quantitative Abundance: Quantitative abundance data elucidate the concentration levels of each metabolite, enabling comparisons between samples and conditions.
c. Statistical Significance: Reports often highlight statistically significant differences, providing confidence in the biological relevance of observed changes.
d. Biological Context: Pathway analyses embed the data in a biological context, offering insights into the functional implications of observed metabolic alterations.
Quality Control Measures for LC-MS Analysis
| Quality Control Measures |
Description |
| Instrument Calibration and Performance Check |
a. Regular Calibration: Scheduled calibration using standard compounds to ensure accurate mass measurement.
b. Performance Verification: System suitability tests (SST) to evaluate instrument performance. Monitoring parameters such as resolution, peak symmetry, and signal-to-noise ratios. |
| Internal Standards and Blank Runs |
a. Internal Standards: Inclusion of stable isotope-labeled internal standards. Facilitates correction for variations in sample preparation and instrument response.
b. Blank Runs: Regular analysis of blank samples (solvent only) to detect and correct background noise. Ensures the reliability of peak detection and prevents false identifications. |
| Quality Control Samples |
a. Use of QC Samples: Integration of quality control (QC) samples in analytical batches. Monitors system stability and reproducibility throughout the analysis.
b. Acceptance Criteria: Establishing acceptance criteria for QC sample performance. Reanalysis or troubleshooting in case of deviations from set criteria. |
| Data Normalization and Batch Correction |
a. Normalization: Correction for variations in sample concentration and injection volume. Ensures accurate quantitative comparisons between samples.
b. Batch Correction: Addressing systematic variations between analytical batches. Minimizes batch effects to enhance data reliability. |
| Reproducibility Checks |
a. Replicate Analyses: Performing replicate analyses of selected samples. Evaluating the reproducibility of results and identifying potential outliers.
b. Statistical Metrics: Calculation of coefficients of variation and other statistical measures. Assessment of data reproducibility and robustness. |
| Cross-Laboratory Standardization |
a. External Standards: Participation in external quality assessment programs. Comparison of results with external standards for inter-laboratory standardization. |
| Documentation and Audit Trail |
a. Comprehensive Documentation: Recording all experimental details, instrument settings, and data processing steps. Facilitates traceability and troubleshooting in case of discrepancies.
b. Audit Trail: Implementation of an audit trail for changes made to data or analytical parameters. Ensures data integrity and compliance with regulatory standards. |
Case. Metabolomics Insight into Grape Polyphenol Responses to Water Stress
Background
Understanding the influence of environmental factors, particularly water stress, on the polyphenol composition of grape berry skins is crucial for elucidating the complex interplay between genetics and environmental conditions in grapevine cultivation. Polyphenols, key compounds in grape berries, contribute to wine quality and are responsive to environmental stressors.
Samples
The study involved an association panel of 279 Vitis vinifera cultivars, representing the genetic and phenotypic diversity in cultivated grapevines. Berry skin samples were collected over two vintages (2014 and 2015) under both irrigated and non-irrigated conditions.
Technological Methods
A targeted metabolomics approach was employed, utilizing Multiple Reaction Monitoring (MRM) to analyze a broad spectrum of polyphenolic compounds. This included 96 directly analyzed molecules and 9 additional compounds released after acid-catalyzed depolymerization of proanthocyanidins. The comprehensive dataset enabled the establishment of correlation networks, providing insights into polyphenol metabolism and biosynthetic pathways. The analytical approach allowed for a detailed examination of the impact of water stress on polyphenol composition.
Results
Water Stress-Induced Changes in Polyphenol Composition: Water stress led to a significant decrease in the biosynthesis of catechin and epicatechin, impacting flavan-3-ol monomers and proanthocyanidins, as well as other polyphenolic classes, such as phenyl- and catechyl-pyranoanthocyanins, caftaric-anthocyanin adducts, and more.
Differential Response Patterns Across Cultivars: Unsupervised hierarchical clustering revealed distinct response patterns to water stress across different cultivars and groups of analytical variables. Some cultivars exhibited increased stilbene levels under irrigation, while others showed decreased anthocyanins and flavonols, highlighting the cultivar-specific nature of the response.
Cluster Analysis and Correlation Networks: Clustering of polyphenols based on their response to water status revealed groups of compounds with similar behavior. Correlation networks illustrated relationships between various polyphenol classes, providing a comprehensive view of their interconnected biosynthetic pathways.
Genetic Diversity in Drought Response: Clustering of cultivars based on their response to drought confirmed the influence of genetic factors on polyphenol composition. Genetic groups did not emerge as a predominant factor, suggesting that individual cultivar characteristics play a significant role in the response to water stress.
Large Scale Metabolomics for Polyphenol Profiling: The study utilized a large-scale metabolomics approach, targeting an extensive number of polyphenolic compounds. The analysis not only validated known polyphenol reactions but also revealed potential new compounds, emphasizing the depth and scope of the metabolomics study.
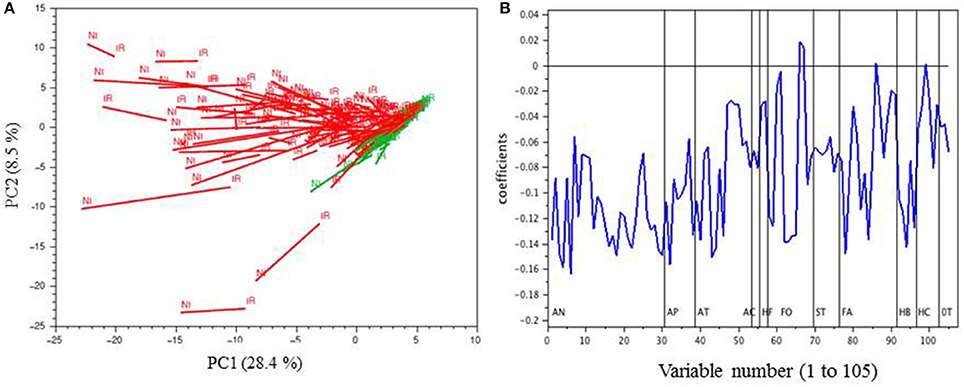 PCA of the MRM phenolic composition data of berry skin samples collected in 2014
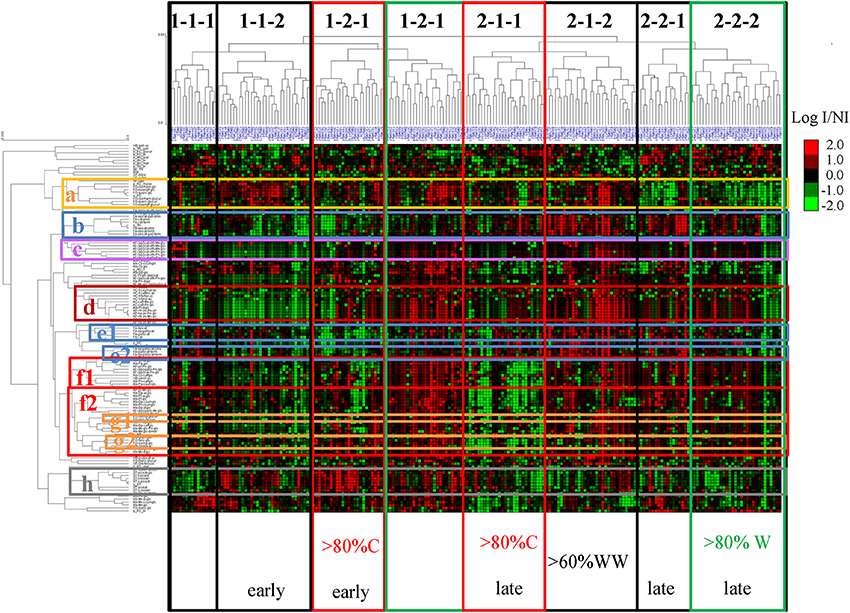 Unsupervised hierarchical clustering of metabolites and cultivars affected by drought
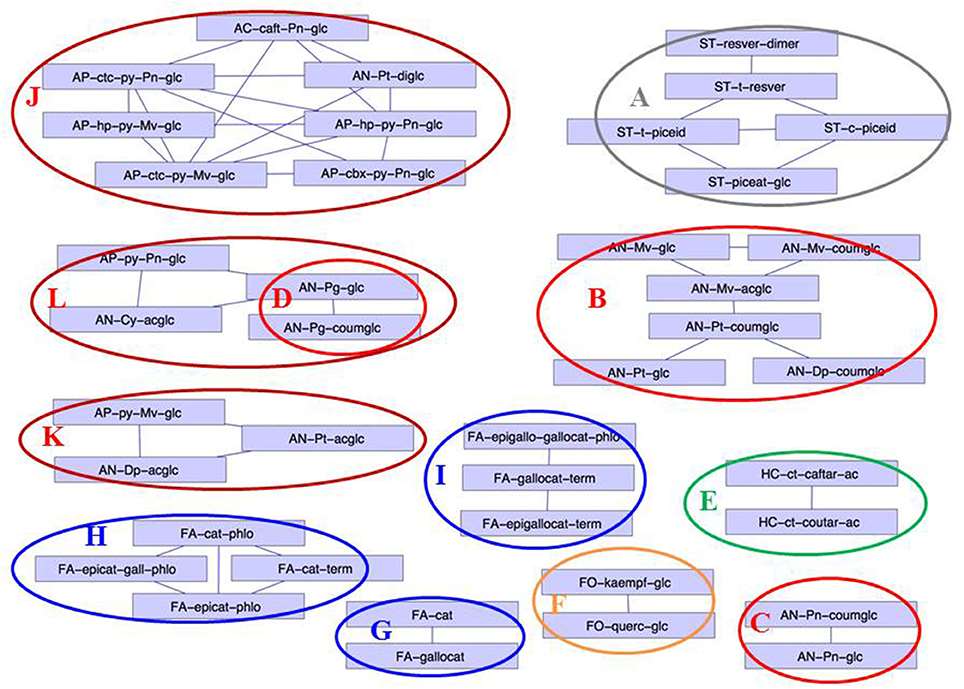 Correlation network (correlations >0.8) established from the Log (concentration I/concentration NI)
Reference
- Pinasseau, Lucie, et al. "Cultivar diversity of grape skin polyphenol composition and changes in response to drought investigated by LC-MS based metabolomics." Frontiers in plant science 8 (2017): 1826.