What are Anthocyanins?
Anthocyanins belong to a class of water-soluble flavonoids, a subgroup of phenolic compounds. These pigments are responsible for the vivid red, purple, and blue colors observed in many fruits, vegetables, and flowers. Anthocyanins are synthesized through the phenylpropanoid pathway and are derived from a core structure called anthocyanidin. Various modifications, including glycosylation, acylation, and methylation, contribute to the structural diversity of anthocyanins.
The analysis of anthocyanins provides crucial information about their composition, abundance, and biological activities. Understanding the profile of anthocyanins in different plant species or cultivars can shed light on their genetic regulation and environmental responses. Moreover, anthocyanin analysis is instrumental in plant breeding programs aiming to enhance the color intensity, stability, and nutritional value of fruits and vegetables. In the field of human health, anthocyanins have gained attention for their potential antioxidant, anti-inflammatory, and anticancer properties. By analyzing anthocyanins, researchers can identify specific compounds that contribute to these health benefits and optimize their extraction and purification methods.
Anthocyanin Metabolome Analysis Services at Creative Proteomics
Identification and Quantification: Using advanced mass spectrometry-based techniques, such as liquid chromatography-mass spectrometry (LC-MS) and high-resolution mass spectrometry (HRMS), we identify and quantify anthocyanins and their metabolic intermediates in various sample matrices. These techniques enable the separation, identification, and accurate quantification of anthocyanin compounds, even at trace levels.
Structural Elucidation: Creative Proteomics employs cutting-edge mass spectrometry techniques, including high-resolution mass spectrometry (HRMS) and tandem mass spectrometry (MS/MS), for the structural elucidation of anthocyanin compounds. These techniques provide valuable information about the chemical modifications, fragmentation patterns, and biosynthesis pathways of anthocyanins, enhancing our understanding of their biological functions.
Metabolic Pathway Analysis: We offer comprehensive metabolic pathway analysis to explore the interconnections between anthocyanins and other metabolites in different biological systems. By integrating techniques such as LC-MS and HRMS, we can decipher the complex metabolic networks and identify key intermediates and regulatory nodes within the anthocyanin metabolism pathway.
To achieve these analyses, Creative Proteomics employs cutting-edge instrumental models:
- Liquid Chromatography-Mass Spectrometry (LC-MS): We utilize the Thermo Scientific™ Q Exactive™ Plus Hybrid Quadrupole-Orbitrap™ Mass Spectrometer. This state-of-the-art instrument offers high-resolution and accurate mass measurement, allowing for sensitive and reliable analysis of anthocyanins in complex biological samples.
- High-Resolution Mass Spectrometry (HRMS): For structural elucidation and accurate determination of molecular masses, we utilize the Thermo Scientific™ Orbitrap Exploris™ 480 Mass Spectrometer. This instrument provides exceptional mass accuracy, resolving power, and spectral quality for in-depth analysis of anthocyanin compounds.
By combining these advanced techniques and instrumental models, we ensure precise and comprehensive anthocyanin metabolome analysis, enabling you to unravel the complexities of anthocyanin metabolism and gain valuable insights into their biological significance.
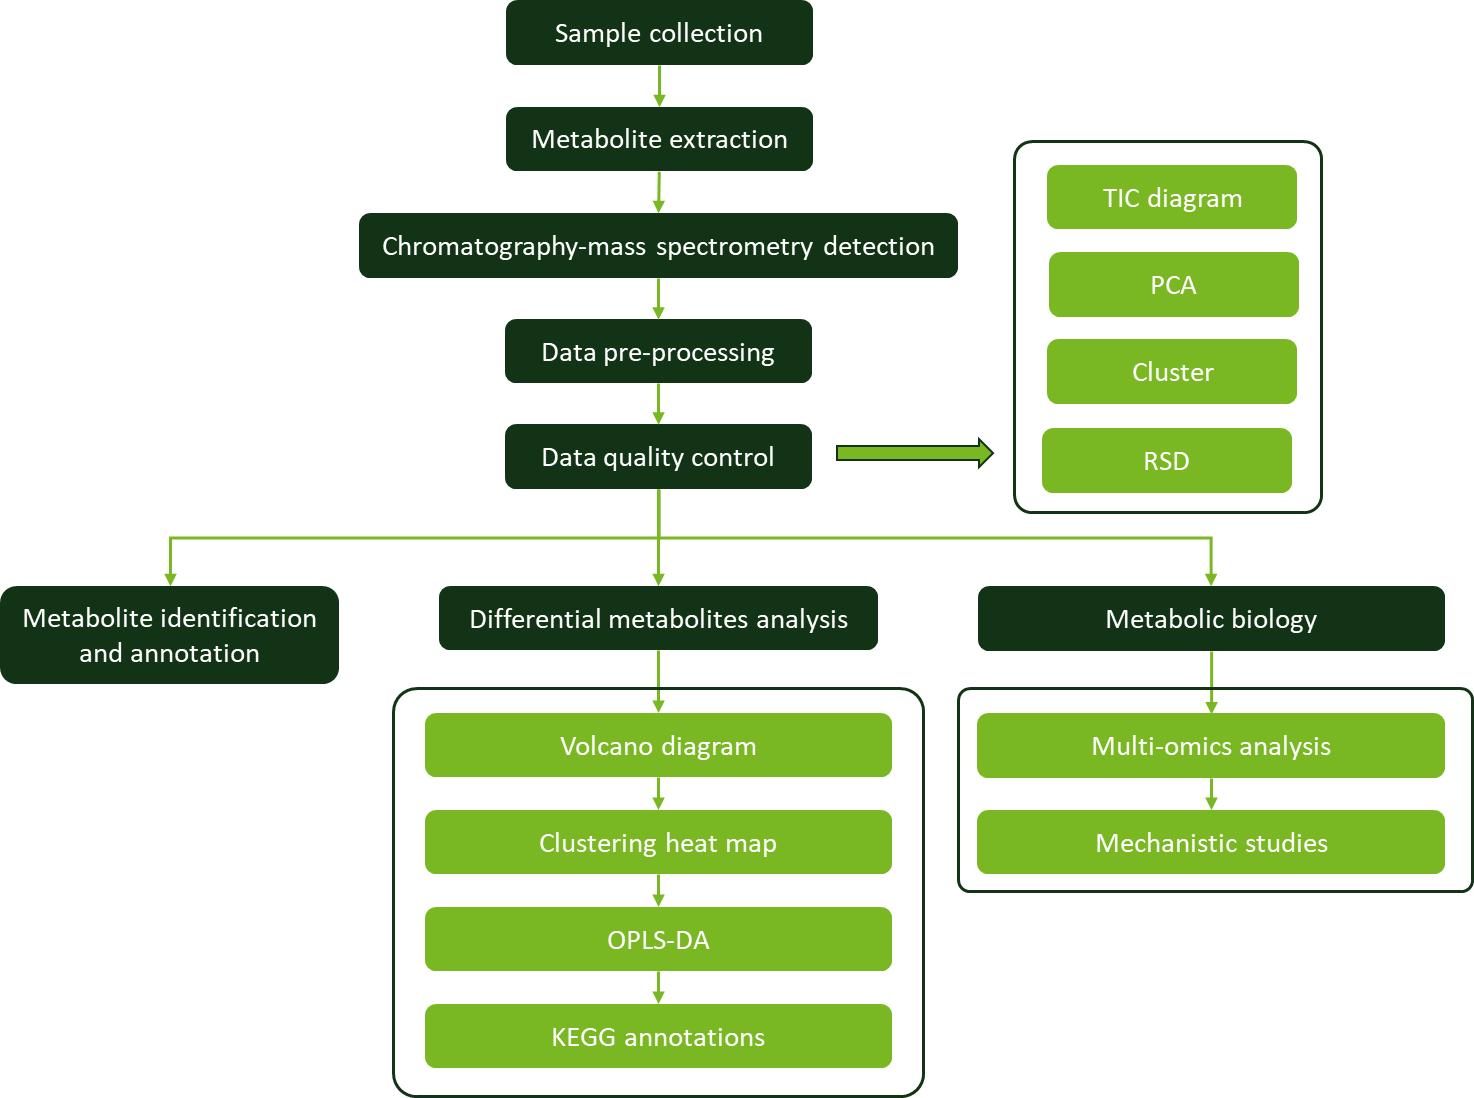 Workflow for Plant Metabolomics Service
List of Anthocyanins Analyzed (including but not limited to)
| Anthocyanidin Subclass |
Anthocyanin Metabolites |
| Cyanidin |
Cyanidin-3-glucoside, Cyanidin-3-rutinoside, Cyanidin-3-galactoside, Cyanidin-3-arabinoside, and more. |
| Delphinidin |
Delphinidin-3-glucoside, Delphinidin-3-rutinoside, Delphinidin-3-galactoside, Delphinidin-3-arabinoside, and more. |
| Malvidin |
Malvidin-3-glucoside, Malvidin-3-rutinoside, Malvidin-3-galactoside, Malvidin-3-arabinoside, and more. |
| Pelargonidin |
Pelargonidin-3-glucoside, Pelargonidin-3-rutinoside, Pelargonidin-3-galactoside, Pelargonidin-3-arabinoside, and more. |
| Peonidin |
Peonidin-3-glucoside, Peonidin-3-rutinoside, Peonidin-3-galactoside, Peonidin-3-arabinoside, and more. |
| Petunidin |
Petunidin-3-glucoside, Petunidin-3-rutinoside, Petunidin-3-galactoside, Petunidin-3-arabinoside, and more. |
Applications of Anthocyanin Analysis
Plant Breeding and Agriculture: Anthocyanin analysis helps in selecting and breeding plants with desired color characteristics, enhancing the aesthetic and market value of fruits, vegetables and ornamentals, as well as improving the nutrient content and antioxidant capacity of crops.
Environmental Stress Response: Anthocyanin accumulation in plants is often associated with environmental stress conditions such as high light, low temperature and nutrient deficiencies. Analyzing the dynamics of anthocyanin levels can provide insights into plant responses to stress and help develop stress-tolerant cultivars.
Phylogenetic Studies: Comparative analysis of anthocyanin levels in different plant species and genera can help to categorize and understand plant evolutionary relationships.
Plant Signaling and Defense Mechanisms: Anthocyanins are associated with plant signaling and defense against various pathogens and herbivores. Studying the regulatory mechanisms and interactions between anthocyanins and other defense-related compounds can provide valuable insights into plant defense strategies.
Sample Requirements for Anthocyanins Metabolism Assay
| Sample Types |
Minimum Sample Size |
| Plant Samples |
Roots, stems and leaves, floral parts, fruits/seeds, rhizomes, buds/tender leaves, tissue sections, pollen, bark, trunk/wood, resin/gum, resin acids, seedlings/young plants, rhizosphere soil, root exudates. |
100 mg - 1 g |
| Animal Samples |
Tissues |
100 mg - 1 g |
| Cell Samples |
Cells and Culture |
106 - 108 cells |
Case 1. Understanding Purple-Leaf Formation in Tea Cultivars: Anthocyanin Content and Transcriptome Analysis
Background:
The study focused on investigating the purple phenotype and anthocyanin content in two tea cultivars, Zikui (ZK) and N61. The researchers aimed to understand the factors responsible for the color variation in tea leaves and explore the underlying metabolic and genetic processes associated with purple-leaf formation.
Sample:
The samples used in the study were leaves from ZK and N61 tea cultivars at different growth stages, including 5, 10, 15, 30, and 45 days. These time points allowed for the observation of color changes and the analysis of anthocyanin content during leaf development.
Technical Platform and Procedure:
Phenotypic Observation and Anthocyanin Content: The researchers visually observed the color changes in the leaves of ZK and N61 at different growth stages. Anthocyanin content was measured using the pH differential method.
Analysis of Differential Metabolite Components and Relative Contents: Liquid chromatography-mass spectrometry (LC-MS) was used to analyze the metabolite components in the leaves of ZK and N61. Differential expression analysis was performed to identify metabolites that differed significantly between the two cultivars.
Analysis of Transcriptome Sequencing Quality: Transcriptome analysis of ZK and N61 was conducted using Illumina RNA-seq technology. Reads containing adaptors and low-quality reads were removed, and clean reads were obtained for further analysis.
Analysis of Differentially Expressed Genes (DEGs): DEGs in ZK and N61 were identified based on transcriptome sequencing data. Gene Ontology (GO) analysis and Kyoto Encyclopedia of Gene and Genome (KEGG) pathway enrichment analysis were performed to understand the biological processes and metabolic pathways associated with purple-leaf formation.
Results
Phenotypic Observation and Anthocyanin Content: ZK leaves exhibited a purple coloration that intensified until 15 days and then faded to dark green by 45 days. N61 leaves remained green throughout the experiment. ZK had higher anthocyanin content than N61, with the peak at 15 days.
Analysis of Differential Metabolite Components and Relative Contents: Metabolite analysis revealed various metabolites, including flavonoids, anthocyanins, and proanthocyanidins. Differential expression analysis identified specific metabolites that differed significantly between ZK and N61 at different growth stages.
Analysis of Transcriptome Sequencing Quality: The transcriptome analysis yielded high-quality reads for both ZK and N61, ensuring reliable data for downstream analysis.
Analysis of Differentially Expressed Genes (DEGs): DEG analysis identified numerous genes that were differentially expressed between ZK and N61 at different growth stages. GO analysis and KEGG pathway enrichment analysis revealed key biological processes and metabolic pathways associated with purple-leaf formation.
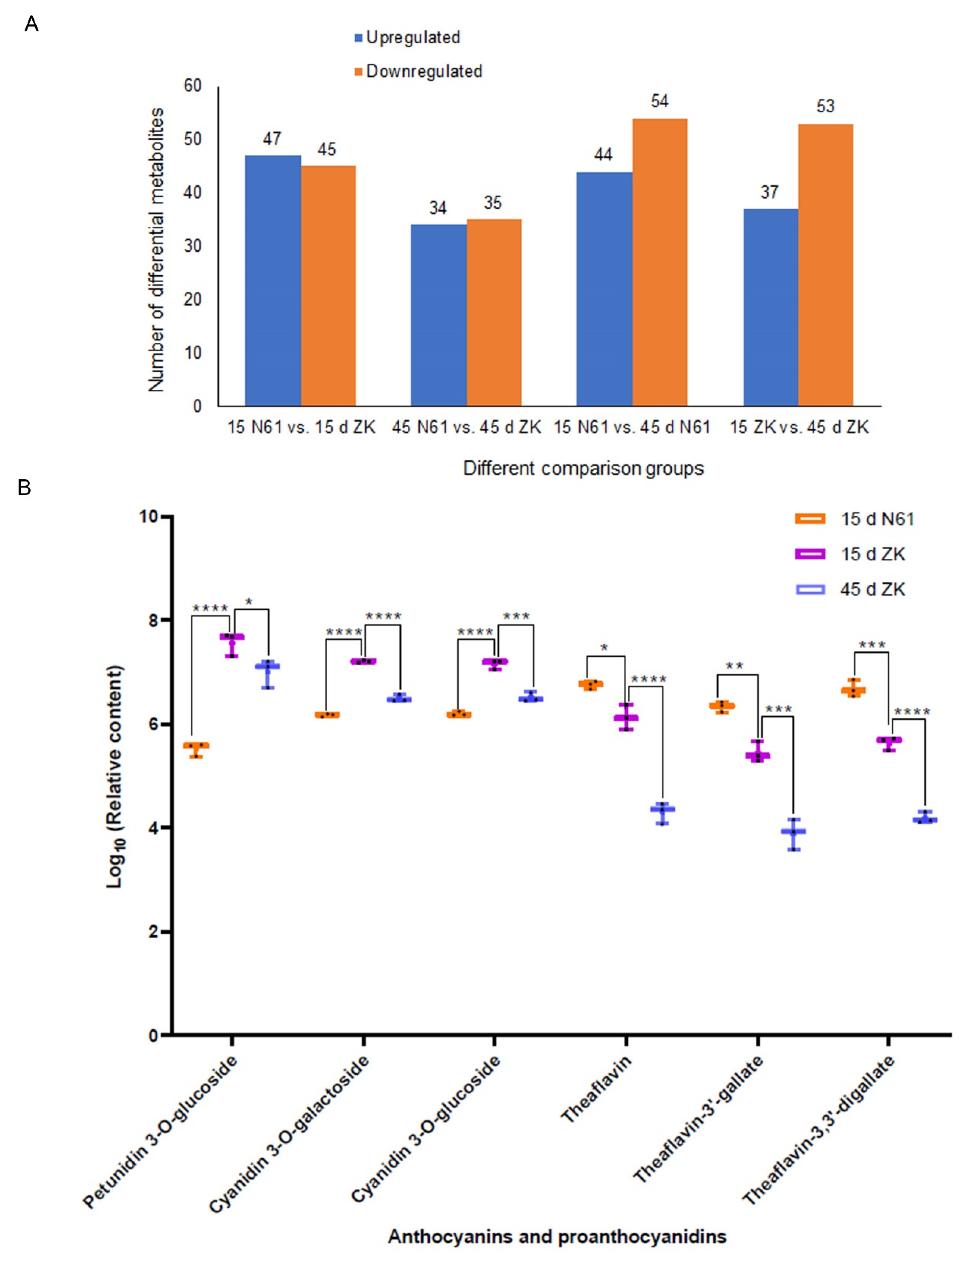 Analysis of differential metabolite components and relative content of key metabolites in the Zikui (ZK) and N61 cultivars.
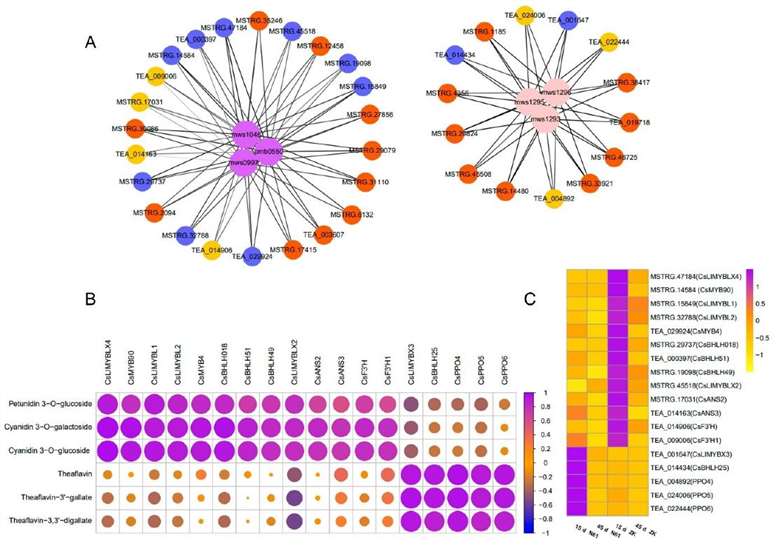 Correlation analysis between genes and key metabolites of purple-leaf formation in Zikui tea
Reference
- Cai, Ju, et al. "Integrative analysis of metabolomics and transcriptomics reveals molecular mechanisms of anthocyanin metabolism in the zikui tea plant (Camellia sinensis cv. Zikui)." International Journal of Molecular Sciences 23.9 (2022): 4780.