DIA Proteomics Software and Tools: DIA-NN, Spectronaut, and FragPipe
Data-independent acquisition (DIA) proteomics has become a core strategy for large-scale protein quantification because of its reproducibility and depth of coverage. The success of DIA studies, however, depends heavily on the analysis software chosen. Among the leading tools, DIA-NN, Spectronaut, and FragPipe provide different approaches for spectral library usage, FDR estimation, alignment, and quantitative output.
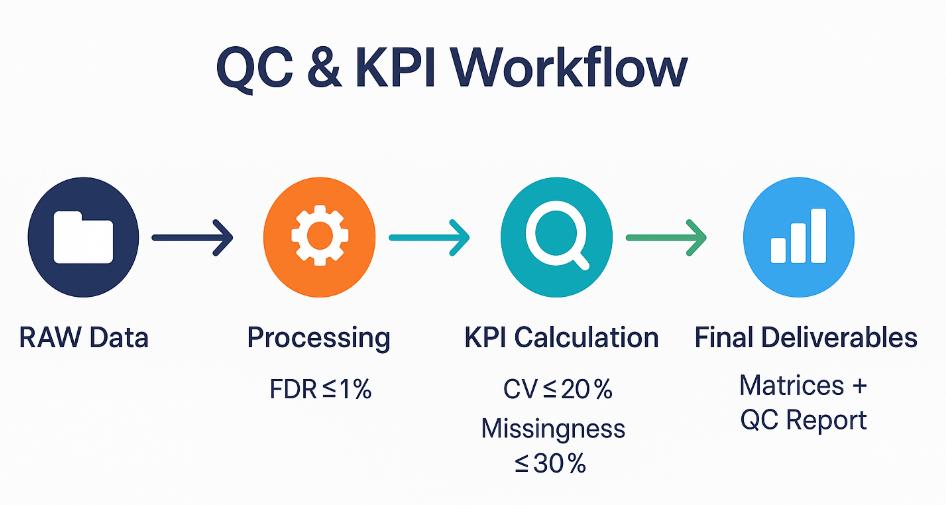
This article offers a systematic comparison of these platforms using consistent and measurable KPIs: 1% peptide/protein FDR, QC-pool protein CV ≤20%, and sample-level missingness ≤30%. In addition, metrics such as batch stability, computational efficiency, and compatibility with downstream omics are assessed to give a realistic view of performance in research-use service environments.
The following sections outline where each tool fits in the DIA workflow, how to benchmark them with standardized metrics, and how to select the right solution for different project scenarios—including high-throughput proteomics services, deep-coverage discovery projects, timsTOF with ion-mobility–enabled DIA ion-mobility workflows, and challenging clinical-style matrices such as plasma or FFPE.
Positioning in the DIA Workflow — What Each Tool Covers
Unified analysis path: RAW → feature detection / chromatogram extraction → (library-based or library-free) search & scoring → FDR control → RT (±IM) alignment → normalization & batch handling → protein inference → quantitative matrices → QC review → export & handoff.
Roles by product family:
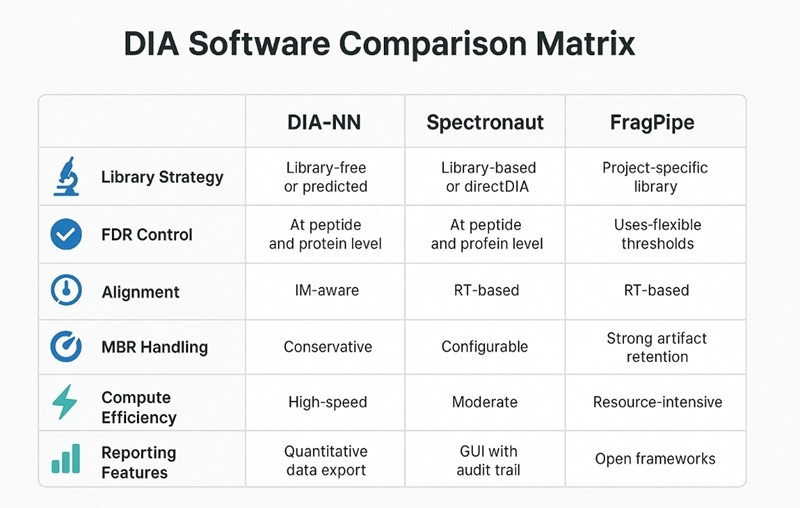
- DIA-NN — High-speed library-free/predicted-library workflows; robust cross-batch merging; IM-aware for timsTOF with ion-mobility–enabled DIA; conservative MBR controls.
- Spectronaut — Mature directDIA and library-based modes; audit-friendly GUI reports; templated exports and QC figures for sign-off.
- FragPipe ecosystem — Open, composable pipeline (MSFragger-DIA, DIA-Umpire, etc.); retains intermediates (mzML/pepXML/features); container-friendly for CI/CD and traceability.
Evaluation Framework for DIA Proteomics Software: KPIs, Benchmarks, Auditability
To avoid "same samples, different numbers," standardize definitions and metrics across tools.
Core KPIs (report consistently)
- Identification & quantification capacity: peptide and protein counts at 1% peptide FDR / 1% protein FDR; reproducibly quantified proteins (intersection across technical replicates).
- Stability: QC-pool protein-level CV (median and 95th percentile); sample-level missingness (% cells missing in the protein matrix).
- Alignment quality: RT residuals after iRT-anchored alignment; IM residuals where applicable.
- MBR impact: % rows affected by match-between-runs and the evidence thresholds used.
- Efficiency: runtime per sample; CPU/RAM footprint; library build/maintenance burden; ease of re-running with version locking.
- Auditability: software version pins; parameter snapshot; protein grouping policy; FDR/q-value columns in exports; export template version.
Benchmark design (pre-award bake-off)
- Matrices: cell/solid-tissue lysate, depleted plasma, FFPE (≥3 matrix types).
- Gradients: ≥2 (e.g., 60/120 min; add 30 min if relevant to your service tiers).
- Load: low vs. standard per matrix.
- Replicates: ≥3 technical replicates/condition; QC-pool every ~10–12 runs; ≥2 acquisition batches to test cross-batch merging.
Library Strategy — Project Library, Predicted Library, or Library-Free (directDIA)
Library families
- Project library (DDA/GPF): maximal depth; requires upfront effort and maintenance.
- Predicted/in-silico library: fast start-up; balanced depth vs. effort.
- Library-free/directDIA: quickest to launch; highly scalable for large cohorts.
Tool tendencies
- DIA-NN: excellent predicted-library and library-free performance; strong cross-batch stability; IM-aware alignment/scoring.
- Spectronaut: polished directDIA with GUI QC and standardized exports.
- FragPipe ecosystem: flexible open pipelines; strong artifact retention; ideal where traceability and method development matter.
Decision aide
| Constraint / Goal | Strategy | Rationale |
| Few samples, no historical DDA | Library-free / predicted | Minimal setup; rapid proof-of-concept. |
| Large cohorts, multi-batch | Predicted + conservative MBR | Stable across batches; predictable compute. |
| Maximum depth | Project library (DDA/GPF) | Sensitivity with tighter interference control. |
| timsTOF with ion-mobility–enabled DIA | IM-aware search/alignment | Proper 1/K0 handling and alignment. |
Library hygiene: constrain peptide candidates (length, charge ranges, protease rules); avoid over-broad libraries in plasma/FFPE; version the library and record all filters in the deliverables.
Ensuring Consistency in DIA Data Analysis (FDR, MBR, Protein Grouping, Missingness)
To make DIA proteomics results comparable across different software platforms and project contexts, it is critical to enforce consistent definitions and reporting standards.
- FDR and PEP definitions: Apply a uniform threshold of 1% peptide FDR and 1% protein FDR, with the target–decoy scheme and q-value column explicitly reported. To ensure fairness across tools, all KPIs should be recalculated from native score tables with a blind script, minimizing software-specific heuristics.
- Protein grouping: Use a consistent parsimonious grouping policy, and map results to UniProt accessions and gene symbols to support reproducible downstream analyses and integration with transcriptomics or metabolomics.
- Alignment and match-between-runs (MBR): Use QC-pool anchors for retention time alignment, and quantify residual drift to monitor stability. MBR should be applied conservatively; when enabled, thresholds and evidence requirements must be documented. For transparency, provide both MBR-off (primary) and MBR-on (sensitivity) result matrices.
- Missingness policy: Report headline QC metrics without imputation. If imputation is later applied (e.g., MNAR-aware methods), clearly document the statistical rationale, parameters, and impact in the README or metadata.
By consolidating these practices, DIA proteomics projects can achieve reproducible and auditable outputs that remain consistent regardless of which analysis tool—DIA-NN, Spectronaut, or FragPipe—is used.
Tool Deep Dives with Scenario-Ready Presets
DIA-NN — Fast Library-Free/Predicted Workflows; Cross-Batch; IM-Aware
Strengths: high-throughput/budget-sensitive cohorts; timsTOF with ion-mobility–enabled DIA data; conservative MBR and stable cross-batch merges.
Starting parameters by matrix:
| Aspect | Cell/Tissue | Depleted Plasma | FFPE |
| FDR policy | 1% peptide / 1% protein | same | same |
| Variable mods | Oxidation(M), Acetyl(Protein N-term); Carbamidomethyl(C) fixed | same | same; filter artefactual cross-links |
| MBR | On, stricter evidence thresholds | More conservative (or off for headline) | Provide off/on pair if coverage is fragile |
| Alignment | Global RT with QC anchor; per-run refinement | same | same |
| Quant exports | Protein + peptide matrices | same | same |
Compute: pragmatic mid-tier baseline is 16–32 vCPU and 64–128 GB RAM per concurrent job; prefer NVMe for intermediates.
Pitfalls → mitigations: oversized predicted libraries → narrow peptide filters; plasma/FFPE interference → tighten fragment evidence and interference removal; cross-batch drift → QC-anchored corrections prior to merging.
Spectronaut — directDIA Workflows and QC Reporting
Strengths: standardized GUI reports, templated exports, and comprehensive QC figures; robust directDIA and library-based modes.
Starting configuration:
- FDR & scoring: 1%/1% with consistent target–decoy; iRT normalization; expose q-value columns.
- Interference control: enable interference scoring/competition; require a minimum robust fragment count; cap low-intensity ions.
- Protein grouping: parsimonious; map to UniProt + Gene Symbol.
- Batch normalization: QC-anchored normalization; version export templates per project.
- Exports: protein table, peptide table, (optional) transition-level table, raw scoring table, QC figure bundle.
Pitfalls → mitigations: over-wide libraries inflate false discoveries → tighten the library and validate FDR curves; export template drift → treat templates as versioned artifacts in the SOP.
FragPipe Ecosystem — MSFragger-DIA and DIA-Umpire in Open Pipelines
Strengths: transparent open pipeline (MSFragger-DIA, DIA-Umpire); retains mzML/pepXML/features; ideal for traceability and method development.
Starting configuration:
- FDR/scoring: 1%/1%; record target–decoy method and q-value definition in logs.
- Pseudo-spectra/features: tune peak extraction thresholds to reduce low-confidence fragments; balance sensitivity vs. compute.
- Intermediate retention: keep mzML and feature/pepXML layers for recomputation and issue isolation.
- Compute: sensitive to storage and I/O; use NVMe and sharded parallelization.
Pitfalls → mitigations: component version coupling → wrap in a pinned container image and deliver the manifest; reproducibility friction → ship config YAML and (if permitted) CI snippets.
Throughput and Cost — Compute Sizing, Parallelization, and TAT
What drives runtime and cost
- Gradient length & chromatographic density: longer runs → more features → heavier scoring & alignment.
- Library strategy: library-free/predicted libraries reduce upfront cost; project libraries improve sensitivity but add build time and compute during library construction.
- Matrix complexity: plasma and FFPE typically require stricter interference control and can increase effective runtime.
- Batching & parallelization: queue design (sharding by run, by fraction/library step) determines wall-clock TAT.
Back-of-envelope planning
- Total CPU-hours ≈ N samples × (baseline CPU-h per sample) × (multipliers for gradient × library strategy × matrix difficulty).
Use this to size vCPU and RAM per concurrent job to hit your promised TAT (e.g., weekly cohorts vs. monthly waves). - Prefer NVMe for temp/intermediate files; avoid network storage bottlenecks during feature extraction and scoring.
- Implement checkpointing: cache feature tables and intermediate score files so that FDR/alignment tweaks don't trigger full re-runs.
Failure & re-run policy
Auto-flag and branch on: aberrant FDR curves, alignment failures, or outlier missingness.
Provide a triage SOP (re-extract → re-score → narrow library → adjust alignment anchors) to recover quickly.
Unified QC & Release Criteria — Thresholds and Visual Checks
| Metric | Pass (Release) | Target (Preferred) | Notes |
| Peptide / Protein FDR | 1% / 1% | 0.5% / 1% | Declare target–decoy scheme and q-value column. |
| QC-pool protein CV (median) | ≤ 20% | ≤ 15% | Inject QC-pool every ~10–12 samples. |
| Sample-level missingness (protein table) | ≤ 30% | ≤ 20% | Report before imputation. |
| RT alignment median residual | ≤ 30 s | ≤ 15 s | iRT-anchored; monitor non-linear drift. |
| (If IM) IM alignment error | Within preset bound | Lower is better | Match acquisition windowing and 1/K0 handling. |
| MBR contribution (rows affected) | ≤ 20% | ≤ 10% | Ship MBR off/on comparison when used. |
Supplemental visuals & checks
- FDR curves and score distributions to spot tail irregularities.
- Missingness heatmap and multi-metric outlier detection to identify problematic samples.
- Cross-batch drift plots (before/after normalization) with residuals.
Decision Tree — Scenario-Based Default Prescriptions
Step 1—Identify your scenario
A. High-throughput cohort, cost-sensitive
B. Deep-coverage project (ample material, willing to build libraries)
C. timsTOF with ion-mobility–enabled DIA with ion mobility
D. Hard matrices (depleted plasma, FFPE) and/or multi-batch mega-cohorts
Step 2—Apply the matching prescription
| Scenario | Tooling & strategy | Key preset elements | Expected KPI ranges (directional) | Compute & TAT notes |
| A High-throughput | DIA-NN, library-free or predicted library | 1%/1% FDR; conservative MBR; QC-anchored RT alignment; narrow predicted library filters | QC CV median ≤20%; MBR rows ≤20% | 16–32 vCPU, 64–128 GB RAM per concurrent job; short TAT |
| B Deep coverage | Spectronaut + project library (or DIA-NN + GPF) | Strict interference removal; longer gradients; controlled MBR; strict library hygiene | Higher reproducible protein counts, lower missingness | Longer total compute; upfront library build time |
| C IM dimension | DIA-NN (or IM-aware FragPipe path) | Enable IM alignment; ensure acquisition windows and 1/K0 settings are mirrored | RT/IM residuals within bounds; stable IDs across runs | Scale CPU/RAM with window count and peak density |
| D Hard matrices / mega-cohorts | Spectronaut (audit/QC GUI) or DIA-NN (cross-batch robust) | Tight fragment evidence; restrained MBR; strict version locking; standardized exports | Missingness controlled; low false-positive risk | Treat SOP and template versioning as release artifacts |
Ranges are indicative and depend on matrix, gradient, and load. Always run a pilot blind evaluation (10–20 injections) to finalize thresholds.
FAQ — DIA-NN vs Spectronaut vs FragPipe
DIA-NN vs. Spectronaut vs. FragPipe—which is "best"?
A: It depends on your scenario. For high-throughput and budget-sensitive work with minimal setup, DIA-NN (library-free/predicted) is an excellent default. For audit-heavy programs that value GUI reporting and standardized exports, Spectronaut is often preferred. If you need open, composable pipelines with full artifact retention and CI-friendly operation, the FragPipe ecosystem is ideal. Decide using CV, missingness, reproducible protein counts, and MBR contribution—not identification counts alone.
Can we proceed without a DDA/GPF project library?
A: Yes. Library-free or predicted-library routes generally suffice for most research projects and accelerate start-up. When you require maximum depth or targeted panels, consider building a project library and tightening interference controls.
Does MBR inflate false positives?
A: It can if used aggressively. We default to conservative MBR and report the evidence thresholds. When MBR materially affects outputs, we deliver two matrices (MBR off/on) so downstream statistics can run a sensitivity analysis.
How do I plug results into transcriptomics or metabolomics platforms?
A: We ship protein and peptide matrices plus an ID mapping table (UniProt ↔ Gene Symbol ↔ Entrez ↔ Ensembl) and a concise field dictionary. This eliminates ad-hoc reconciliation and enables immediate pathway/network analysis.
How do I reproduce your results later?
A: Use the delivered parameters.json, software version pinning, and (for open pipelines) container image references. Our folder includes native score tables and logs; for FragPipe-based runs, intermediate mzML/pepXML/feature tables are retained to enable recomputation.
References:
- Demichev, Vadim, et al. "High sensitivity dia-PASEF proteomics with DIA-NN and FragPipe" bioRxiv (2021): 2021.03.08.434385.
- Egertson, James D., et al. "A Comparative Analysis of Data Analysis Tools for Data-Independent Acquisition Mass Spectrometry." Journal of Proteome Research (2023).
- Demichev, Vadim, et al. "dia-PASEF data analysis using FragPipe and DIA-NN for deep proteomics." Nature Communications (2022).
- Smith, et al. "Benchmarking of Quantitative Proteomics Workflows for Limited-Sample Analysis: FragPipe vs Spectronaut." Molecular & Cellular Proteomics (2025).
 4D Proteomics with Data-Independent Acquisition (DIA)