
Exosome proteomics is often described as a window into cell state. In practice, it's also a window into whatever your isolation workflow was best at capturing.
That's not a philosophical point. It's a measurement problem.
When two labs profile "plasma exosomes" with LC-MS/MS but use different isolation principles, they can produce protein lists that disagree not because biology differs, but because the workflows selected different EV subpopulations and different contaminant backgrounds. Comparative MS studies have shown exactly this kind of method-dependent shift in EV subtype enrichment, contaminant fingerprints, and protein IDs (for example, see the method comparison work summarized in Mass-spectrometry based proteome comparison of extracellular vesicle isolation strategies).
Below is a practical explanation of why exosome protein cargo varies by isolation method, which proteins are most likely to become exosome biomarker false positives, and how to design studies that survive translational scrutiny.
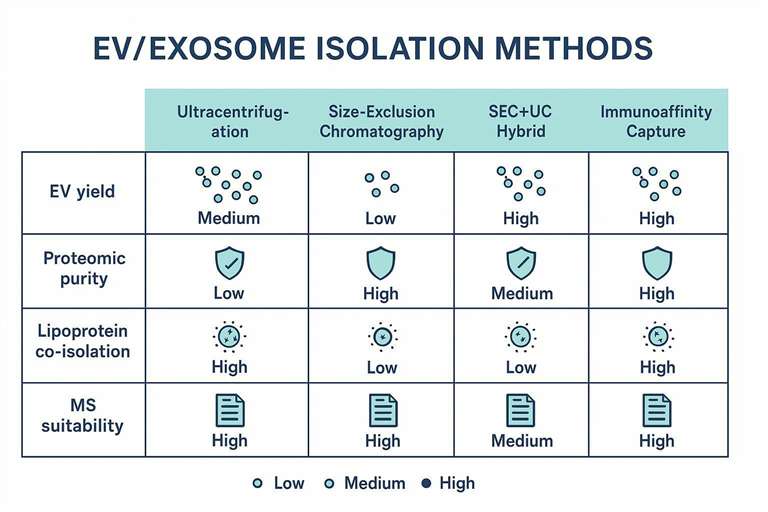
The Impact of Isolation Workflows on EV Proteomics
In practice, most apparent differences in exosome protein cargo across cohorts trace back to one of two causes: EV subpopulation shifts (what you captured) or contaminant shifts (what you co-captured). Both are driven by your isolation physics.
The fundamental reality in EV proteomics is that isolation methods don't merely "purify" exosomes. They behave as selection filters.
A size-based method enriches particles that match a hydrodynamic radius window. A density-based workflow enriches particles that sediment or band in a buoyant density window. An affinity method enriches particles that express the captured epitope at the moment you run the sample. Each choice alters which EV subpopulations dominate the final tube.
That selection becomes the upstream determinant of your LC-MS/MS readout. A workflow that returns "more particles" is not automatically returning more EV signal. Reviews of blood-derived exosome workflows note that common quantitation methods can't reliably discriminate EVs from similarly sized contaminants such as lipoproteins, and that combining isolation methods can reduce nanoscale contaminants and improve interpretability (see Human blood exosomes: isolation and characterization methods).
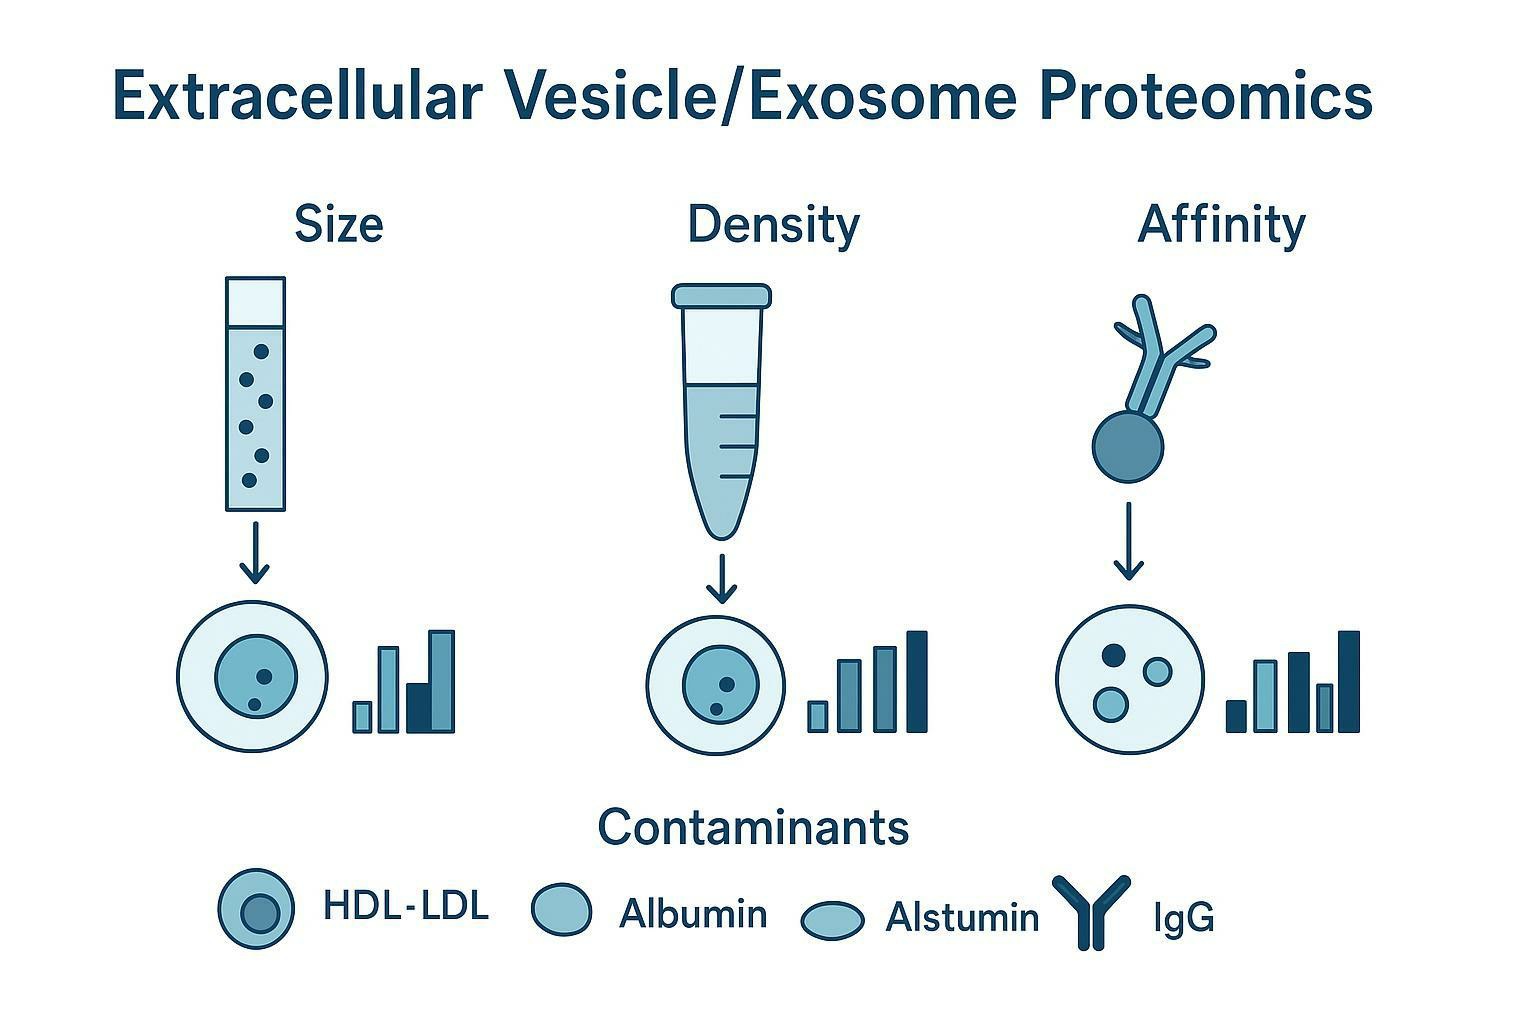
The "Co-isolation Window" dilemma
This is where co-isolation of lipoproteins becomes a hard technical constraint, not a footnote. In blood, lipoproteins outnumber EVs by orders of magnitude, so even a small overlap in the separation window can dominate your final prep.
The core trap in plasma/serum EV proteomics is that multiple non-EV entities overlap with EVs in the exact properties that isolation methods select for:
- Lipoproteins (HDL/LDL/VLDL and remnants) overlap in size and partially in density.
- High-abundance soluble proteins (albumin, immunoglobulins, complement proteins) can co-pellet, co-elute, or co-precipitate.
- Protein aggregates and ribonucleoprotein complexes can behave like nanoparticles.
So every workflow creates a co-isolation window: a set of things you didn't mean to isolate, but did anyway because they look "EV-like" under that method's physics.
Why this matters specifically for LC-MS/MS biomarker discovery
In LC-MS/MS, the measurement penalty for co-isolation is not subtle. High-abundance proteins and lipoprotein-associated proteins can dominate the ion current, driving LC-MS/MS ion suppression plasma effects and compressing the dynamic range available for low-abundance vesicle proteins.
The downstream consequences look like "biology," but they're often method artifacts:
- Inflated sample-to-sample variance when contaminant levels vary between tubes.
- False-positive biomarker candidates that track disease-associated plasma lipoprotein changes rather than EV biology.
- Poor cross-cohort replication when another site uses a different isolation method.
Key Takeaway: In EV biomarker proteomics, method choice is part of your measurement model. If you don't control it, you don't control what "differential expression" means.
Method-Specific Biases in Protein Signatures
Isolation technique is not a neutral preprocessing step. It's a biophysical constraint on what proteins can survive into the MS vial, and what else comes along for the ride.
Ultracentrifugation (dUC/DGUC): Shear Stress and the Protein Corona
Many discovery pipelines still rely on differential ultracentrifugation exosome proteomics because it can remove a large fraction of free plasma proteins when carefully optimized. The trade-off is that force, time, and wash strategy can change both vesicle integrity and what remains associated with the vesicle surface.
Differential ultracentrifugation (dUC) and density-gradient ultracentrifugation (DGUC) enrich EVs through repeated high-g pelleting or banding steps. Those forces are useful, but they aren't gentle.
Vesicle integrity under high g-force
Prolonged high-speed centrifugation can introduce shear stress, hydrostatic pressure, and repeated pellet resuspension. Depending on rotor geometry, duration, viscosity, and wash strategy, this can promote:
- vesicle aggregation
- membrane deformation
- loss of loosely associated surface material
Proteomic consequence: corona stripping and surface signal loss
A practical way to think about this in proteomics terms is that ultracentrifugation can bias what is retained on the vesicle surface.
Some surface-exposed proteins and loosely associated "protein corona" components are not covalently anchored. If those interactions are disrupted during pelleting and washing, you can lose potential low-abundance surface biomarkers from the final preparation.
Co-precipitation bias toward dense particles
In plasma/serum, centrifugation-based methods can also co-sediment dense non-EV material, including HDL-range particles and protein aggregates. That's one reason UC-derived isolates can show notable carryover of albumin and immunoglobulin fragments in some settings.
A direct serum comparison illustrates how large the method effect can be. In Comparison of an Optimized Ultracentrifugation Method and Size Exclusion Chromatography for Serum Exosome Isolation, SEC isolates carried substantially higher levels of ALB and apolipoproteins relative to an optimized UC workflow, highlighting that "purity" is method- and protocol-dependent, not just technique-dependent.
Size-Exclusion Chromatography (SEC) and Hybrid Approaches
SEC is a common choice in size exclusion chromatography exosomes proteomics workflows because it preserves vesicle integrity and supports reproducible fractionation, which matters when you're trying to control technical variance across runs.
SEC separates particles by hydrodynamic radius under low shear. For EV proteomics, that gentle handling is a real advantage.
SEC preserves fragile surface-associated material
Because SEC does not require high g-force pelleting, it is less likely to disrupt vesicle morphology and loosely associated surface components. In workflows where the functional protein corona is part of the biological question, SEC can preserve what centrifugation may partially strip.
SEC's inherent flaw: lipoprotein co-elution
The major limitation is straightforward: some lipoproteins and apolipoprotein-rich particles occupy overlapping size regimes and can co-elute with small EV fractions.
In practice, SEC EV fractions from plasma/serum frequently show strong signatures of apolipoproteins such as APOA1, APOC3, and APOE. Without explicit lipoprotein controls, these proteins can dominate differential abundance tables and masquerade as EV-specific signals.
Hybrid workflows as a practical "deep proteomics" default
Hybrid workflows (e.g., SEC followed by UC, or SEC coupled to density-based enrichment) are often used to recover EV proteins while suppressing lipoprotein background.
The reasoning is simple: use SEC for gentleness and fractionation, then apply a second orthogonal separation to collapse the co-isolation window.
If your study goal is discovery-depth proteomics rather than particle counting, it's often worth treating hybrid purification as the default starting point rather than an afterthought.
For a broader overview of available preparation strategies, see Creative Proteomics' practical guide to Exosome Extraction and Purification Methods.
Precipitation vs. Immunoaffinity Traps
If your goal is discovery proteomics, it helps to explicitly label and manage EV proteomics isolation bias rather than treating it as random noise. Precipitation and immunoaffinity introduce bias through different mechanisms, so they also fail in different ways.
Precipitation and immunoaffinity both appeal to translational teams for the same reason: convenience. But they distort the proteome in opposite ways.
Polymer-based precipitation: high yield, maximal non-EV carryover
Polymer precipitation (often PEG-based) can return high particle counts and high apparent protein mass. For LC-MS/MS discovery, that can be a worst-case scenario.
Because precipitation is not selective for EVs, it can bring down:
- abundant plasma proteins (albumin, immunoglobulins)
- lipoproteins and apolipoprotein complexes
- protein aggregates and other nanoparticle-like assemblies
In MS, that broad co-precipitation drives severe ion suppression and can "blind" the instrument to lower-abundance EV cargo.
Immunoaffinity capture: high specificity, narrow subpopulation bias
Immunoaffinity capture (for example, anti-CD9/CD63/CD81) is the inverse: you gain specificity, but you define the population. In other words, immunoaffinity capture exosome subpopulations are the ones you measure, not the full EV mixture.
That means your proteomics profile becomes a profile of the captured epitope-positive subset. If your biomarker biology is in a tetraspanin-low or tetraspanin-negative EV subpopulation, you won't see it.
Immunoaffinity can also introduce antibody-related artifacts (carryover, leachables) and is sensitive to epitope masking by protein corona or sample handling.
For studies focused on phenotype-specific EV analysis, Creative Proteomics also offers the ExoView Exosome / EV Profiling Service, which supports immunocapture-based profiling of EV subpopulations.
Decoding Contaminants: Lipoproteins and Plasma Proteins
A good working assumption in blood-derived EV work is that the first pass will look like plasma exosome contaminants unless you prove otherwise with orthogonal metrics.
If you do plasma/serum EV biomarker discovery, contaminant interpretation is not optional. You need to recognize which proteins are likely reporting on lipoprotein biology, coagulation state, or bulk plasma changes rather than EV cargo.
The apolipoprotein trap
Apolipoproteins are especially dangerous as false biomarker candidates because they are:
- extremely abundant in blood relative to EV proteins
- responsive to metabolic and inflammatory states
- carried by particles that overlap with EVs in size/density
So a workflow that co-isolates lipoproteins tends to yield differential apolipoprotein abundance even when EV biology is unchanged.
In proteomics tables, the usual suspects include APOA1, APOB, APOC3, and APOE. When these rise or fall across case/control groups, it can reflect disease-driven changes in lipoprotein profiles rather than EV packaging.
"Hitchhiker" proteins: HDL-binding and indirect co-isolation
Some proteins show up because they travel with lipoproteins, not because they are packaged into EVs.
Examples often discussed in plasma contexts include:
- RBP4
- transthyretin (prealbumin)
These can bind to HDL or other plasma complexes. If HDL dynamics change across cohorts, hitchhiker proteins can look like EV biomarkers.
A contamination decoding table you can actually use
Use the table below as a screening heuristic before you invest in antibody validation or cohort expansion.
| Protein signal in LC-MS/MS | Common interpretation mistake | More likely explanation to rule out first | What to measure next |
|---|---|---|---|
| APOA1 / APOB / APOC3 / APOE enriched | "EVs carry a disease signature" | lipoprotein co-isolation window | ApoB (lipoprotein burden), EV tetraspanins, fraction-level analysis |
| Albumin / Ig fragments high | "EV prep failed" | co-pelleting/co-precipitation; wash strategy; sample viscosity | ALB level, digestion efficiency/QC, EV-marker-to-ALB ratios |
| RBP4 / transthyretin shifts | "New EV biomarker" | HDL-associated hitchhiking | ApoA1/ApoB trend alignment, HDL depletion controls |
Proteomics Quantitation and Normalization Strategies
There isn't a single universal answer to EV proteomics normalization strategies because normalization only works if the underlying assumptions match your isolate quality.
Normalization is where many EV biomarker studies quietly break.
If contamination varies between samples, a mathematically "correct" normalization can still produce biologically misleading fold changes.
Why total protein normalization can amplify contamination bias
In a contaminated isolate (common in precipitation workflows), total protein is dominated by non-EV proteins. Normalizing everything to total protein can unintentionally:
- upweight contaminant-rich samples
- downweight cleaner samples
- turn contamination differences into apparent EV-cargo differences
That's why total-protein-centric normalization is risky when purity varies.
Particle count normalization is useful, but not sufficient
Normalizing to particle count (e.g., NTA) can improve comparability when EV recovery differs. But in plasma/serum, particle counting can include lipoproteins and other nanoparticles.
So particle normalization works best when you pair it with a contamination QC panel.
If you need a quick method-aligned set of physical readouts (size, concentration, and related parameters) to support downstream proteomics QC, Extracellular Vesicle Analysis: Size, Concentration, and Zeta Potential is a useful framing for the characterization layer.
A contamination-aware QC panel (practical default)
A practical QC strategy is to monitor EV-positive markers together with EV-negative or contaminant-associated markers, then compare their relative signals to flag isolation-related variability. This type of ratio-based assessment can help reveal free-protein carryover, lipoprotein contamination, or batch-to-batch differences introduced by the isolation method.
A quantitative example is described in Improved isolation of extracellular vesicles by removal of both free proteins and lipoproteins, where EV tetraspanins were measured alongside albumin as a marker of free-protein burden and ApoB as a marker of lipoprotein burden.
A practical marker panel may include:
| Category | Example markers | Why it matters |
|---|---|---|
| EV-positive (enrichment) | CD9, CD63, CD81, TSG101, ALIX | tells you if you're actually enriching EV material |
| Free-protein burden | ALB, IgG-heavy/light chains | tracks bulk plasma carryover that can dominate MS |
| Lipoprotein burden | ApoB (and often ApoA1) | tracks the lipoprotein co-isolation window |
A simple sanity check before differential expression: if EV-marker-to-ALB or EV-marker-to-ApoB ratios vary systematically by batch, site, or isolation method, treat that as a major confounder to address before you interpret biology.
Study Design for Robust Biomarker Translation
Method-dependent bias is not something you "fix in analysis" after the fact. The most robust studies engineer it out.
Orthogonal Validation of Discovered Biomarkers
Cross-method validation is one of the cleanest ways to rule out method-specific co-isolates.
If your discovery cohort used dUC (or any centrifugation-heavy workflow), validate the biomarker panel using a separation principle that collapses a different co-isolation window, such as SEC-based workflows or immunoaffinity enrichment.
The logic is simple: a true EV-associated biomarker should survive a reasonable change in isolation physics. A contaminant-driven candidate often won't.
In multicenter studies, consider a predefined cross-method subset early, not as a late "nice-to-have." It gives you a readout of inter-site comparability before you scale sample size.
Preanalytical Sample Governance
Preanalytics and isolation interact.
Collection tube choice, delay to processing, hemolysis, platelet activation, freeze-thaw cycles, and storage conditions can all change the composition of particles and protein complexes available to be isolated. When the isolation method has a broad co-isolation window (e.g., precipitation), those upstream variables can compound into large method-driven proteomic shifts.
Practical governance steps:
- lock the tube type and handling SOP across sites
- standardize processing delay and centrifugation steps upstream of EV isolation
- cap freeze-thaw cycles and track them as a covariate
- randomize extraction order and include pooled QC samples for LC-MS runs
Integrating EV Isolation into Biomarker Study Design
If inconsistent EV recovery, lipoprotein carryover, or method-dependent proteome variation is slowing your biomarker program, EV isolation should be considered part of the analytical design rather than a routine sample-preparation step.
Creative Proteomics' subcellular analysis team supports EV proteomics studies through workflow planning, isolation-method selection, lipoprotein-aware QC strategies, and downstream proteomics execution via Extracellular Vesicles Proteomics Services.
FAQs
What is the best exosome isolation method for LC-MS/MS proteomics?
SEC-based workflows are often the most MS-friendly starting point because they're gentle and can reduce bulk soluble protein carryover, but plasma/serum lipoprotein co-elution remains a key failure mode. For discovery-depth work, many teams use hybrid purification (SEC plus an orthogonal step such as centrifugation or density-based enrichment) to improve signal-to-noise.
Why do apolipoproteins show up as "top hits" in plasma exosome proteomics?
Because lipoproteins are extremely abundant in blood and overlap with EVs in size and partially in density, they frequently co-isolate. Apolipoproteins also change with disease states in bulk plasma, so they can look like compelling biomarker candidates even when the EV cargo is unchanged.
How can I tell whether a candidate biomarker is an EV protein or a co-isolated contaminant?
Start by checking whether the candidate tracks contamination markers across samples (albumin, ApoB/ApoA1) and whether it remains significant after fraction-level analysis or stricter purification. The strongest test is orthogonal validation: confirm the signal in a cohort isolated by a different principle (for example, SEC vs immunocapture).
Should I normalize EV proteomics to total protein, particle count, or EV markers?
Use total protein cautiously when contamination varies, because it can mathematically amplify non-EV carryover. Particle count can help but is confounded by non-EV nanoparticles in plasma. A practical default is to pair a primary normalization approach (often median/TIC scaling or stable EV-marker normalization when appropriate) with contamination-aware QC ratios (EV markers relative to albumin and ApoB/ApoA1) so you can detect method-driven batch effects before differential expression.
Why do two labs get different EV proteomes from the same sample type?
Different isolation methods enrich different EV subpopulations and bring along different contaminant backgrounds. Even when both groups call the result "exosomes," the co-isolation window can be different enough to change which proteins dominate the MS spectra.
References
- Comparison of an Optimized Ultracentrifugation Method and Size Exclusion Chromatography for Serum Exosome Isolation
- Mass-spectrometry based proteome comparison of extracellular vesicle isolation strategies
- Improved isolation of extracellular vesicles by removal of both free proteins and lipoproteins
- A guide to mass spectrometric analysis of extracellular vesicle proteins
- Human blood exosomes: isolation and characterization methods
* For Research Use Only. Not for use in diagnostic procedures.