Subcellomics Creative Proteomics

Cell Surface Proteomics and Surfaceome Profiling Service

Cell surface proteomics helps you measure proteins exposed on the plasma membrane. This surfaceome profiling service is designed for teams who need evidence of target accessibility, not just gene expression. You get LC–MS/MS data that supports drug target discovery, biomarker screening, and cell phenotype comparison.

Surface proteins often change with cell state, disease context, or treatment. Direct measurement helps reduce false positives that can appear when you infer localisation from transcriptomics or bulk proteomics alone.

Service Highlights Applications Platform Workflow Experimental Design Sample Requirements Deliverables CaseFAQ

Cell Surface Proteomics: What It Measures

Cell surface proteomics measures proteins presented on the plasma membrane and exposed to the extracellular space. This surfaceome profiling service helps you bridge the gap between "expression signals" and evidence of surface accessibility, which is critical for antibody-based programs and actionable biomarker discovery.

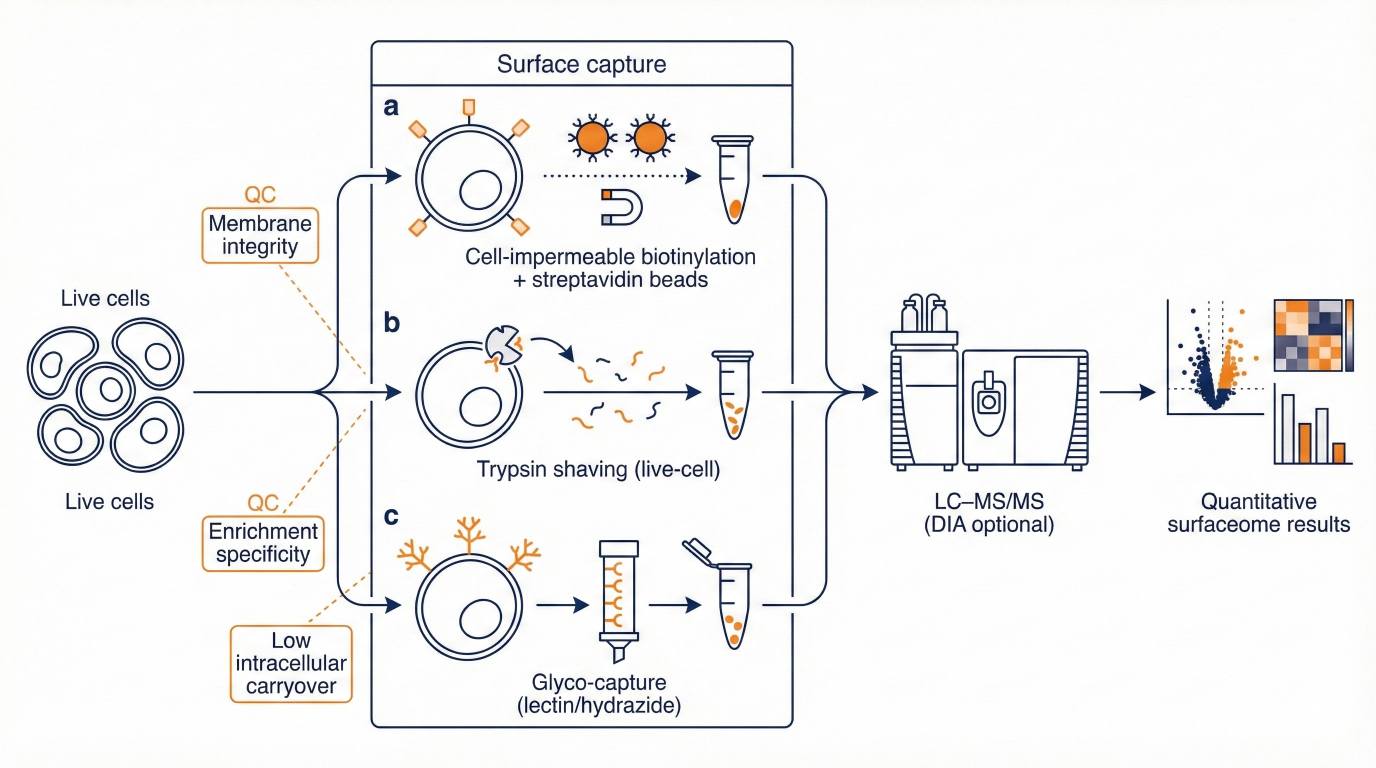
Workflows combine surface-focused enrichment with LC–MS/MS and optional DIA (data-independent acquisition) quantitative proteomics to support consistent comparisons across conditions.

Cell Surface Proteomics Service Highlights for Target Discovery and Biomarkers

  • Surface-focused enrichment designed to prioritise extracellular exposure
  • LC–MS/MS identification with optional DIA quantitative surfaceome profiling
  • Multiple enrichment routes to match biology and sample constraints
  • Membrane-aware sample preparation options for difficult hydrophobic proteins
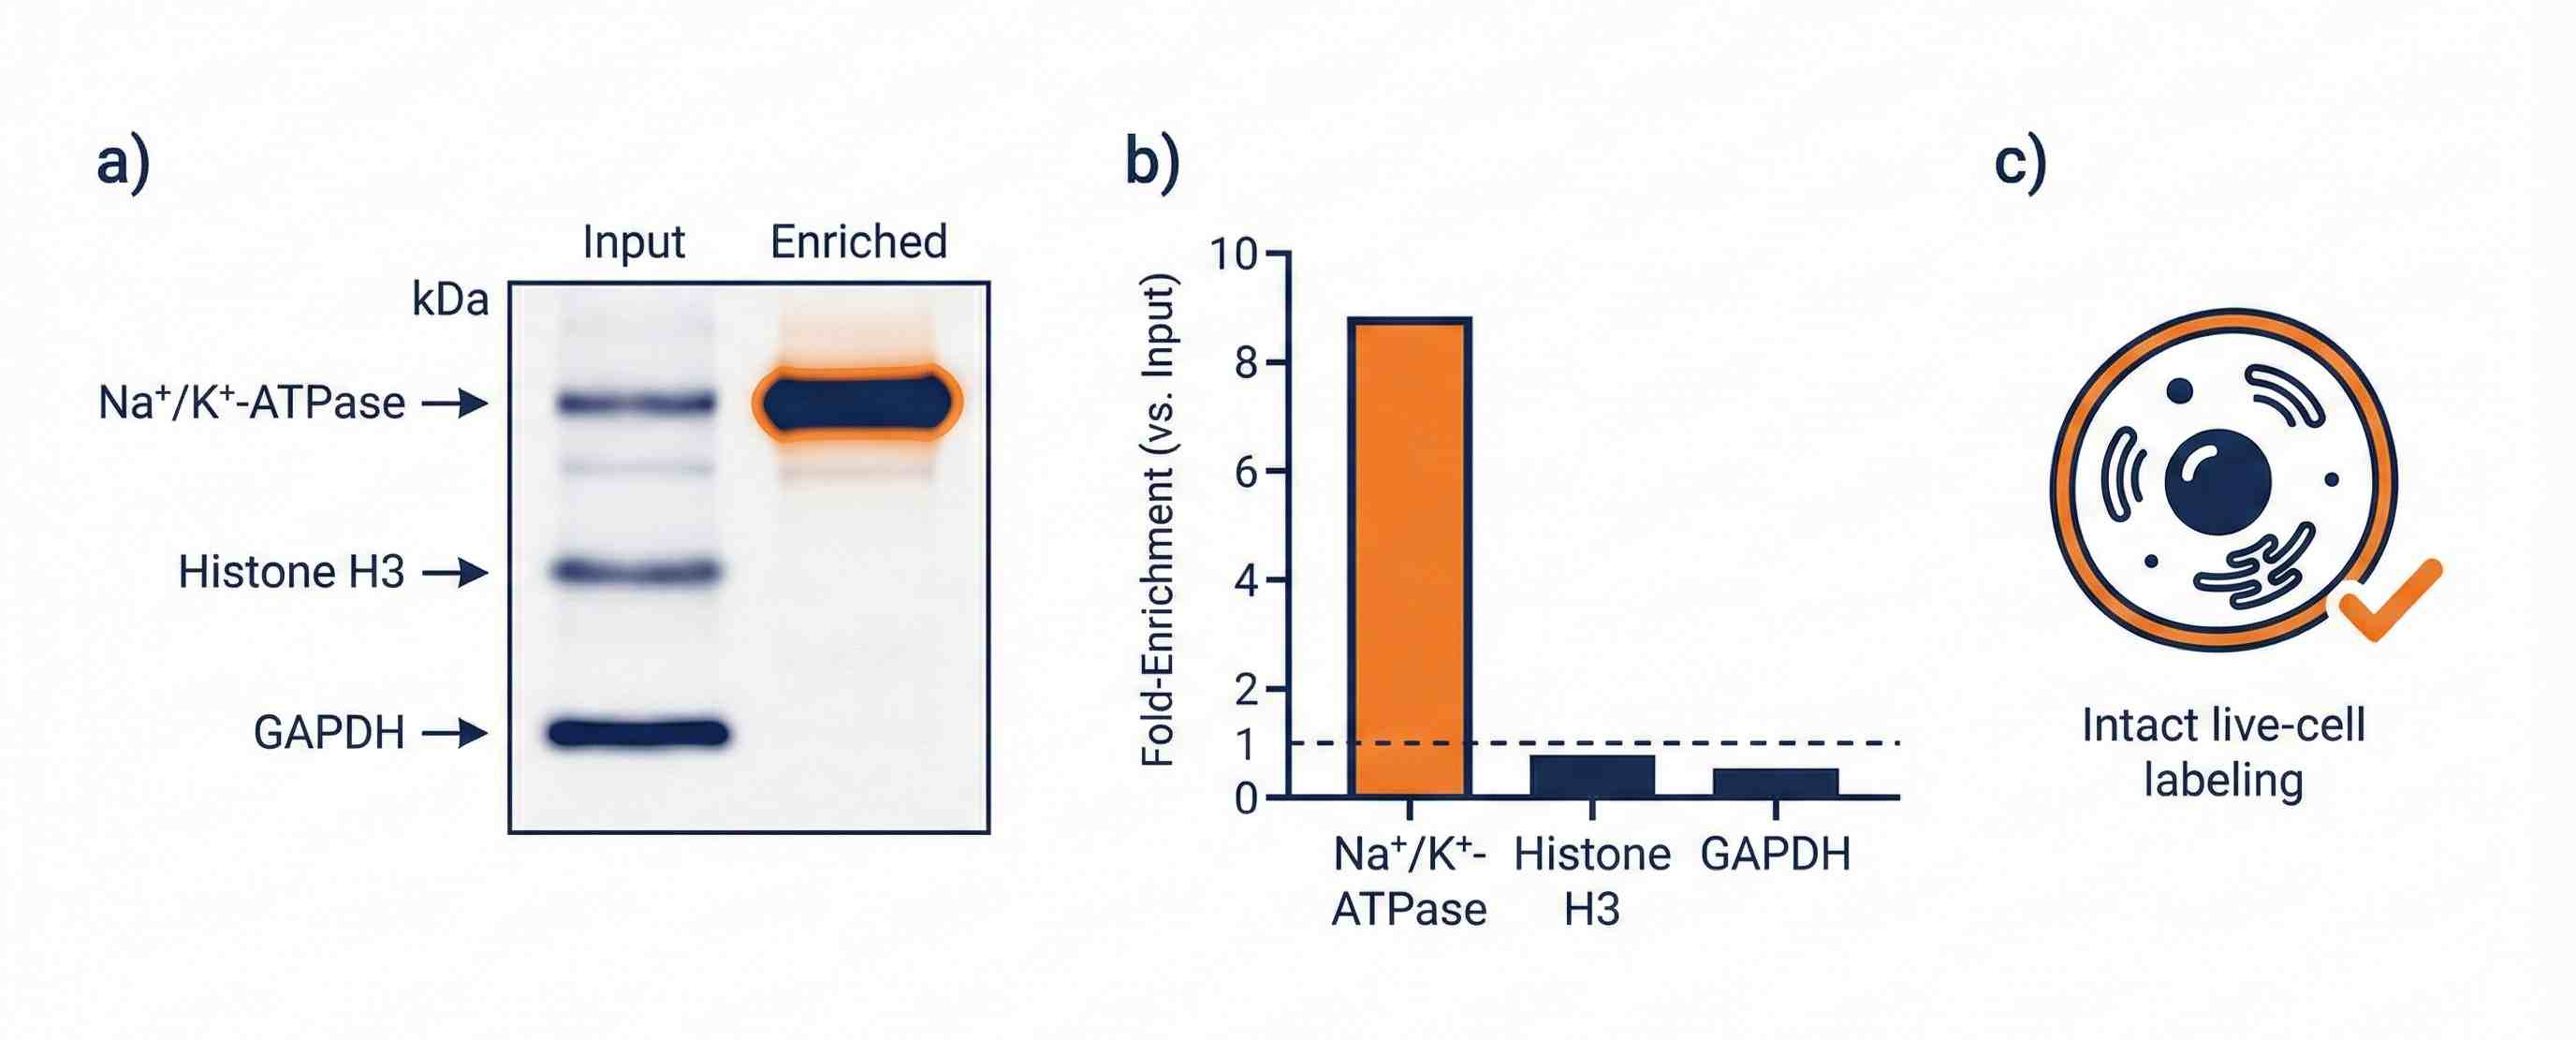
  • QC summaries to assess enrichment specificity and membrane integrity

Surfaceome Profiling Applications and Use Cases (Discovery to Lead Optimisation)

Surfaceome profiling is used when surface accessibility and model relevance drive decisions. Cell surface proteins include receptors, transporters, and adhesion molecules, and their presentation can shift with disease state, differentiation, and treatment.

Goal-to-solution guide

Goal What surfaceome data can support Common next steps
Therapeutic target discovery Evidence of extracellular exposure and condition-specific changes Flow cytometry, IHC/IF, functional assays
Biomarker discovery 
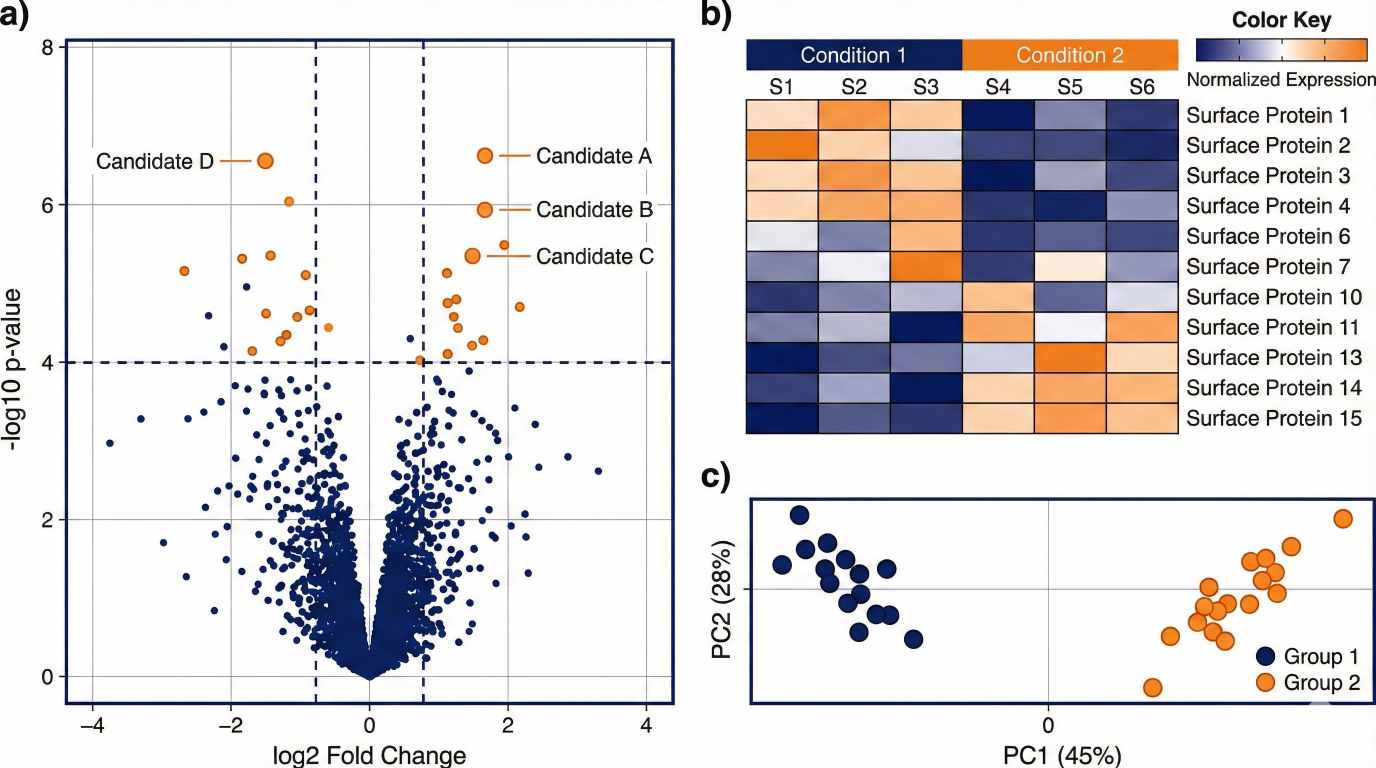
Marker candidates that separate phenotypes across groups Panel design, assay development planning
Cell phenotyping and model selection Surface marker patterns across cell lines or primary research samples Cell sorting strategy, model selection
Drug-response and MOA studies Treatment-driven surfaceome remodelling signals Mechanism follow-up, targeted validation

ADC and bispecific target prioritisation (extracellular domain focus)

Surfaceome data supports shortlisting candidates with evidence of extracellular exposure. Where appropriate, results can be reviewed at the peptide level to support extracellular-domain (ECD) evidence and reduce the risk of pursuing targets that are primarily internal.

Antigen screening for cell therapy (CAR-T/NK and related programs)

Surface profiling helps identify antigens measurable on the cell exterior and supports condition-to-condition comparisons. It can also help prioritise discovery-stage candidates for follow-up safety and specificity assessments.

Cell surface biomarker discovery for stratification and translational readouts

Surfaceome datasets can reveal marker candidates that separate phenotypes and are compatible with antibody-based assays. This can support development of practical validation panels and translational readouts.

Treatment-induced surfaceome changes (research only)

Drug exposure can remodel surface presentation. Surfaceome profiling can support comparisons such as treated vs baseline to help identify resistance markers, compensatory pathways, or combination hypotheses in cell models.

Advantages of Our Cell Surface Proteomics Service

Surface-Accessibility Evidence

Enrichment is designed to prioritise extracellular exposure, not total cellular abundance.

Fit-for-Purpose Enrichment Options

Biotinylation, trypsin shaving, or glyco-capture can be matched to your biology and constraints.

Membrane-Protein Aware Prep

Preparation strategies are built for hydrophobic and multi-pass targets to support LC–MS/MS recovery.

DIA-Ready Quantification

Optional DIA supports consistent comparisons across conditions when quantification is central.

QC for Specificity and Integrity

Marker-based checks help assess enrichment specificity and reduce intracellular carryover risk.

Decision-Ready Deliverables

Outputs are structured for technical review, prioritisation, and downstream validation planning.

Cell Surface Proteomics Platform (Enrichment Chemistry, LC–MS/MS, DIA)

This service uses a surface-focused enrichment strategy paired with LC–MS/MS. Optional modules can be selected to align with specific biological questions and membrane protein challenges.

Core platform components

  • Surface-directed enrichment (cell surface labelling and affinity capture, or surface peptide release)
  • Membrane-aware sample preparation to improve recovery of hydrophobic proteins
  • LC–MS/MS for identification and quantification
  • Optional DIA proteomics for consistent quantitative comparisons
  • QC framework using marker-based logic and membrane integrity checks

Technical note for difficult multi-pass targets

For GPCRs and other multi-pass transmembrane proteins, membrane-aware solubilisation options (for example, detergents, nanodiscs, or SMA-based extraction) may be evaluated to support recovery and LC–MS/MS performance.

Cell Surface Proteomics Workflow (Surface Labelling to Data-Ready Results)

Workflow Steps4 Steps
1 Choose an enrichment route that matches the biology
2 Execute enrichment and sample preparation
3 Acquire LC–MS/MS data with optional DIA quantification
4 Apply QC checks for enrichment specificity and membrane integrity

Step 1: Choose an enrichment route that matches the biology

Surface proteins are often low abundance and hydrophobic. Enrichment strategy determines coverage and interpretability.

Enrichment strategy selection

Method Key strengths Best fit for Typical sample input
Cell-impermeable biotinylation + streptavidin enrichment Broad coverage with clear extracellular-accessibility logic Broad discovery; ADC/bispecific screening Commonly used for cell-based inputs in the 107 range
Trypsin shaving (live-cell) Exposed peptide evidence with reduced background Topology support; verifying surface exposure Often requires higher cell input than labelling workflows
Glyco-capture (surface glycoproteomics) Sensitivity for glycosylated receptors and transporters Deep "receptor-ome" coverage Frequently used when receptor coverage is the priority

Step 2: Execute enrichment and sample preparation

Cell surface biotinylation enrichment workflow (streptavidin capture)

Biotinylation uses cell-impermeable reagents to label accessible amines on extracellular regions while intact membranes act as a barrier. Labeled material is enriched using streptavidin-based affinity capture, then prepared for MS. Typical steps include: surface labelling → quenching → lysis → affinity capture → stringent washing → elution and digestion → LC–MS/MS.

Trypsin shaving live-cell surface proteomics

Trypsin shaving uses controlled protease exposure on intact cells. It releases peptides from exposed extracellular regions into the supernatant. This can reduce intracellular background when the cell membrane remains intact.

Cell surface glycoproteomics via glyco-capture

Many surface proteins are glycosylated. Glyco-capture strategies can enrich glycopeptides and improve detection of receptors and other glycoproteins. Approaches may include lectin capture or chemistry-based enrichment, depending on study goals.

Step 3: Acquire LC–MS/MS data with optional DIA quantification

LC–MS/MS identifies peptides and supports protein-level reporting. DIA proteomics is often used when consistent quantification across groups is a priority. It supports systematic sampling of peptides and can improve comparability across conditions.

Step 4: Apply QC checks for enrichment specificity and membrane integrity

The validity of surfaceome data depends on excluding intracellular "contaminants" and confirming labelling on intact, viable cells.

Marker-based QC logic commonly includes:

  • Enrichment markers: plasma membrane markers should trend higher (example: Na⁺/K⁺-ATPase)
  • Depletion markers: nuclear proteins should be minimal (example: Histone H3)
  • Cytosolic markers: reduced signal is expected (example: GAPDH or actin)

QC summaries are provided in the final package to support internal review and downstream planning.

Experimental Design for DIA Surfaceome Profiling

Quick design checklist (visual guide)

  • Define the question: discovery, comparison, treatment response, or candidate confirmation
  • Lock comparisons: specify primary contrasts (e.g., treated vs control; subtype A vs B)
  • Use biological replicates when quantification matters: supports statistical confidence, especially for DIA
  • Keep handling consistent: same harvest method, timing, buffers, and processing steps across groups
  • Plan validation early: decide what will be checked by flow/IHC/IF or functional assays

Design elements (at-a-glance)

Design Element Best Practice Why It Helps
Group definition Clear group labels and inclusion rules Prevents ambiguous interpretation
Replicates Include biological replicates for comparative claims Improves confidence in differential signals
Randomisation / batching Minimise batch effects; track batches if unavoidable Reduces technical bias
Primary endpoints Decide whether you prioritise coverage, quantification, or ECD evidence Aligns method + reporting
Reporting focus Predefine what "decision-ready" means for your program Makes outputs actionable

Sample Requirements for Cell Surface Proteomics

Sample type (customer-facing) Recommended sample input Compatible enrichment routes
Cell lines (adherent or suspension) Biotinylation: ~1×10⁷–5×10⁷ cells
Trypsin shaving: ≥5×10⁷ cells
Glyco-capture: ~1×10⁸ cells
Biotinylation, Trypsin shaving, Glyco-capture
Primary cells (research samples) Input range depends on availability and chosen route; biotinylation/shaving require intact live-cell membranes Biotinylation or Trypsin shaving (live-cell) when feasible; Glyco-capture when receptor coverage is the priority

What You'll Receive

  • Quantitative surfaceome tables aligned to your experimental groups, with peptide-level evidence
  • Differential analysis summaries (with visual outputs such as volcano plots and heatmaps, as appropriate)
  • Subcellular and surface-focused annotation to support separation of likely surface proteins from background signals
  • Target prioritisation views based on quantitative trends and annotation confidence (where appropriate for the study)
  • QC summary focused on enrichment specificity and membrane integrity
  • Raw and processed MS data files (as appropriate for your workflow)
Diagram of surfaceome profiling with biotinylation, shaving, glyco-capture, LC–MS/MS, optional DIA, and QC.

Surfaceome profiling overview: three enrichment routes converge to LC–MS/MS with optional DIA and QC checkpoints.

 QC figure with input vs enriched markers: Na+/K+-ATPase up, Histone H3 and GAPDH down; integrity check.

QC summary showing surface marker enrichment and depletion of nuclear/cytosolic markers to confirm specificity.

Multi-panel plot with volcano, heatmap, and PCA showing condition-separated surface proteins and highlighted hits.

Differential surfaceome results across conditions: volcano plot, heatmap, and PCA highlighting surface candidates.

Client-Published Surfaceome Case Highlights

Case 1: BiDAC-Induced Plasma Membrane Protein Degradation

Objective: Define how BiDAC treatment drives loss of plasma membrane proteins and identify key pathway regulators.

Method: Morphological profiling + genetic screening, supported by mass spectrometry-based analysis for mechanism mapping.

Result: The study links BiDAC action to regulated trafficking/degradation of plasma-membrane targets, supporting drug-induced surfaceome remodeling positioning.

Read full article: Research Square, 2024.

Case 2: Endolysosomal Pathway Drives Plasma Membrane Target Loss

Objective: Validate the route by which BiDACs trigger degradation of plasma membrane proteins.

Method: Mechanistic profiling + screening with TMT-based quantitative proteomics (LC–MS/MS) to quantify treatment-linked changes.

Result: Demonstrates plasma-membrane targets are routed into endolysosomal degradation, aligning with service claims around surface target depletion evidence across conditions.

Read full article: Nature Communications, 2025.

FAQs – Surfaceome Insights

How does surfaceome abundance correlate with total cellular protein levels?

Correlation is often poor due to post-translational regulation. High mRNA or total protein levels do not guarantee surface translocation; proteins may be sequestered in the ER/Golgi or targeted for lysosomal degradation. Surfaceome profiling directly measures the functionally active pool available for ligand binding or therapeutic targeting. This makes it a superior predictor for antibody-drug efficacy compared to bulk proteomics or RNA-seq, which cannot distinguish between intracellular and membrane-presented fractions.

Why is biotinylation preferred over total membrane fractionation for target discovery?

Total membrane fractionation captures proteins from all lipid bilayers, including the mitochondria, ER, and nucleus, resulting in high intracellular noise. Cell-impermeable biotinylation selectively tags primary amines on the extracellular domains (ECD) of proteins on intact cells. This chemical gating ensures that the enriched fraction represents only the proteins physically accessible from the outside, drastically increasing the signal-to-noise ratio for ADC and CAR-T antigen discovery.

Can LC-MS/MS detect low-abundance receptors like GPCRs?

Yes, through Data-Independent Acquisition (DIA) and optimized solubilization. GPCRs and multi-pass transmembrane proteins are historically "difficult" due to low expression and extreme hydrophobicity. We utilize membrane-mimetic surfactants (e.g., DDM or SMA) and high-sensitivity DIA-MS to overcome these barriers. This approach ensures consistent sampling of low-frequency peptides, allowing for the quantification of signaling receptors that are often missed by standard DDA (Data-Dependent Acquisition) methods.

How do you ensure surfaceome data is not skewed by dead cells?

Cell membrane integrity is critical. If cell viability drops below 90%, "cell-impermeable" labeling reagents can leak into the cytoplasm, leading to the false-positive identification of abundant cytosolic proteins (e.g., Actin, Tubulin). We implement strict viability gating prior to labeling and utilize specialized quenching buffers to stop the reaction instantaneously. Our marker-based QC then audits the final data to confirm the depletion of nuclear and mitochondrial proteins.

How does surface proteomics complement Flow Cytometry (FACS) in drug development?

FACS is a "hypothesis-driven" tool requiring high-quality antibodies for known targets. In contrast, Surfaceome MS is a "hypothesis-generating" discovery tool that identifies thousands of proteins simultaneously without requiring antibodies. In the drug development pipeline, MS is used to generate an unbiased shortlist of condition-specific candidates, which are then validated for absolute quantification and population-specific gating using Flow Cytometry.

What bioinformatic filters are used to define a "true" surface protein?

We apply a multi-layered annotation filter. Beyond simple Gene Ontology (GO) terms, we cross-reference data with the Surfaceome Database and use TMHMM or SignalP algorithms to predict transmembrane helices and signal peptides. This identifies proteins with high "surface propensity." We further categorize results into High, Medium, and Low confidence tiers based on the presence of extracellular domains and experimental evidence of accessibility.

Publications

Online Inquiry ×
inquiry

Hi there - let me know if you have any questions.

×