Leverage mass spectrometry (MS)-based multi-omics and gold-standard mitochondrial functional assays to decode mitochondrial health, energy metabolism, and disease mechanisms—from sample preparation and high-purity mitochondrial isolation to systems-level bioinformatics interpretation.
- High-purity isolation: Percoll / density-gradient ultracentrifugation with ER contamination control (QC-supported).
- Deep proteome coverage: typically 1,200+ mitochondrial proteins identified (project-dependent).
- Targeted panels: TCA cycle metabolites and Cardiolipin (CL) lipidomics with quantitative workflows.
Isolation & QC Proteomics Lipidomics Metabolomics Seahorse & Function Instrumentation Case Studies Sample & ShippingFAQ
ER carryover and MAM-associated contamination are common failure points in mitochondrial omics. Because mitochondria physically contact the endoplasmic reticulum through mitochondria-associated membranes (MAMs), basic enrichment methods can introduce ER/microsomal signals that distort downstream proteomics, lipidomics (cardiolipin), and metabolomics (TCA cycle) results.
To maximize interpretability, we apply purity-first isolation workflows and provide marker-based QC evidence with every project.
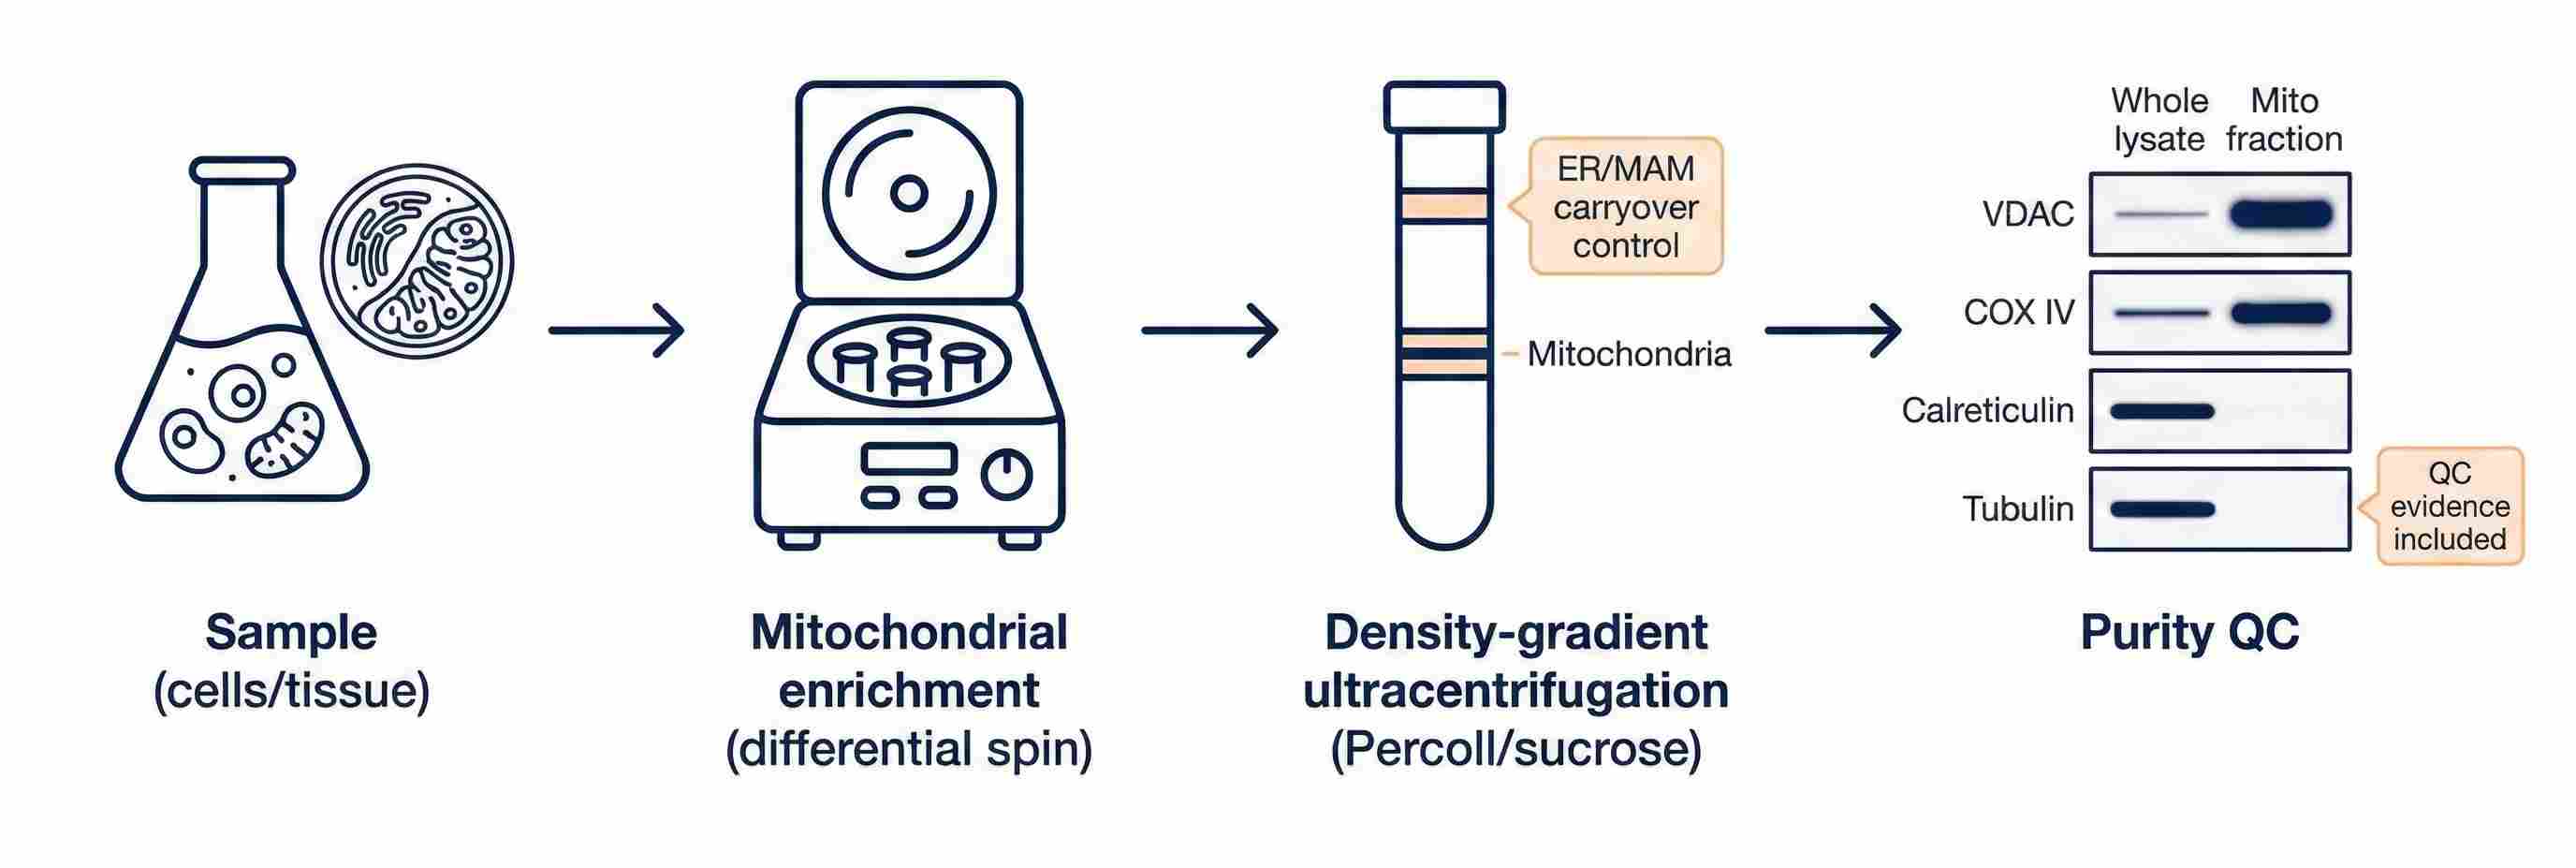 Purity-first mitochondrial isolation workflow with marker-based QC (VDAC/COX IV; Calreticulin/Tubulin).
Recommended isolation strategy (project-dependent)
- Density-gradient ultracentrifugation (e.g., Percoll / sucrose options) to enrich mitochondria and reduce ER/microsome carryover
- Optional workflows for frozen tissues, low-input samples, and membrane-enriched preparations (as applicable)
Purity & integrity QC you receive
| QC goal |
What we verify |
Marker examples |
What you receive |
| Mitochondria enrichment |
Mitochondrial fraction is enriched |
VDAC, COX IV |
Western blot image + QC summary |
| ER depletion |
ER signal is minimized |
Calreticulin |
WB comparison + interpretation |
| Cytosol depletion |
Cytosolic carryover reduced |
Tubulin |
WB comparison + interpretation |
| Functional integrity (optional) |
Mitochondria remain intact/active |
Citrate synthase activity; cytochrome c release |
Activity readout or QC summary |
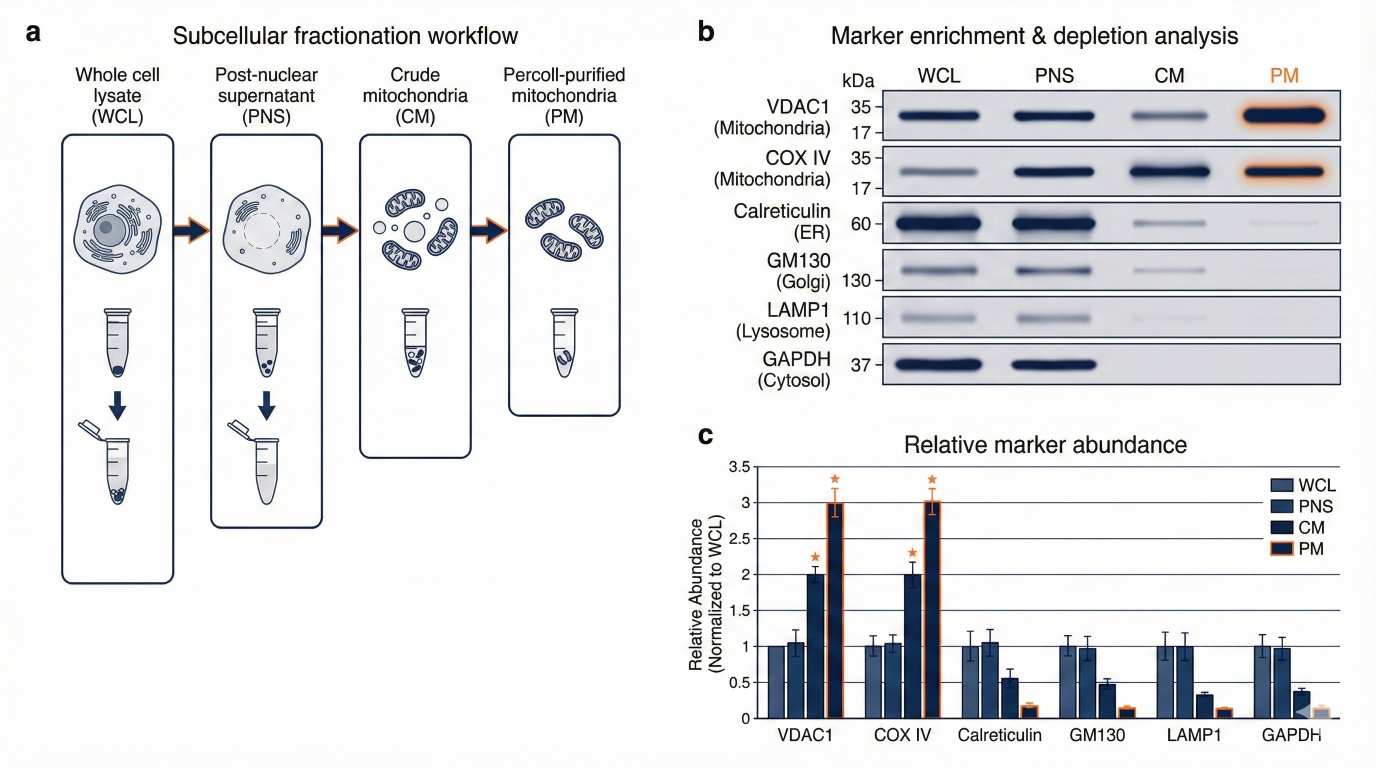 Illustrative purity validation: multi-marker WB across fractions with enrichment/depletion quantification.
MS-based mitochondrial proteomics for OXPHOS/ETC complexes (Complex I–V), mitochondrial transporters, and pathway-level mechanisms. Suitable for disease models, drug-toxicity studies, and multi-omics integration.
Proteomics options (choose by study design)
| Service option |
Workflow |
Best for |
What you receive |
| Discovery proteomics |
DDA / DIA, label-free quant |
Broad profiling; pathway discovery |
Protein IDs + quant tables; differential analysis; figure set |
| Multiplex comparative proteomics |
TMT labeling |
Many groups/timepoints; strong comparability |
Ratio tables; batch-aware stats; prioritized findings |
| Targeted verification (optional) |
PRM / SRM/MRM (project-dependent) |
Confirm key proteins (ETC subunits, transporters) |
Target list quant; verification report |
What you receive
- Identification & quantification tables (with confidence control, e.g., FDR thresholds per project)
- Differential protein analysis (fold change + statistics)
- Functional interpretation: GO/KEGG enrichment, mitochondrial pathway summaries, optional network views
- Figure package: heatmaps, volcano plots, pathway maps
- Optional: purity QC summary (e.g., mitochondria enrichment + ER/cytosol depletion markers)
Profile mitochondrial lipids with a cardiolipin (CL)-focused workflow plus optional mitochondria-related lipid panels (phospholipids, sphingolipids, acylcarnitines, CoQ, and neutral lipids—scope-dependent). This service is designed for mechanism studies in mitochondrial dysfunction, stress responses, and drug-induced toxicity.
| Lipid class / target |
Why it matters (mitochondria) |
Typical outputs |
Typical applications |
| Cardiolipin (CL) |
IMM signature; ETC supercomplex stability |
Total CL, species profile, remodeling |
cardiolipin remodeling; Barth syndrome |
| Oxidized CL (optional) |
Oxidative damage / apoptosis-linked lipid change |
Oxidation features, oxidized species |
oxidized cardiolipin; mito toxicity |
| Phospholipids (PC/PE/PI/PS/PG) |
Membrane composition; PG → CL precursor |
Class abundance, PE/PC, key species |
mitochondrial phospholipid profiling |
| Sphingolipids (Cer/SM/HexCer) |
Stress signaling; apoptosis pathways |
Class/species changes |
ceramide mitochondria apoptosis |
| Acylcarnitines (optional) |
FA transport & β-oxidation status |
SC/MC/LC acylcarnitines |
acylcarnitine panel; FAO defects |
| CoQ/ubiquinone-related (optional) |
ETC electron carrier; redox balance |
CoQ level / redox features |
CoQ10 mitochondrial metabolism |
| Neutral lipids (TAG/DAG/CE) (optional) |
Lipid storage/turnover; lipotoxicity links |
Class/species changes |
lipotoxicity mitochondria |
What you receive
- Lipid identification/quantification tables (relative or absolute by study design)
- CL species distribution and remodeling interpretation (CL-focused projects)
- Summary figures: lipid class composition and key-species heatmaps (scope-dependent)
Quantify mitochondrial metabolism with a TCA cycle core panel plus optional add-on panels covering energy cofactors (NAD+/NADH, ATP/ADP) and other mitochondria-related pathways (scope-dependent). This service is designed to pinpoint metabolic bottlenecks, substrate utilization shifts, and redox/energy imbalance in mitochondrial dysfunction models.
| Panel / targets |
Why it matters |
Typical outputs |
| TCA cycle core (citrate, isocitrate, α-ketoglutarate, succinate, fumarate, malate; additional organic acids as applicable) |
Core carbon flux feeding OXPHOS and biosynthesis |
Relative or absolute quant tables; group comparisons; pathway summary |
| Energy & redox cofactors (optional) (NAD+/NADH, ATP/ADP) |
Energy charge and cellular redox state linked to mitochondrial function |
Levels and ratios (design-dependent); comparison statistics |
| Fatty acid oxidation (FAO)–related metabolites (optional) |
Mitochondrial substrate utilization and stress adaptation |
FAO-relevant metabolite set (scope-dependent); trend and group comparisons |
| Amino acid catabolism (optional) (e.g., BCAA-related markers) |
Anaplerosis and coupling of nitrogen/energy metabolism |
Target metabolite set (scope-dependent); differential patterns |
| Redox/antioxidant metabolism (optional) (e.g., GSH/GSSG-related markers) |
Oxidative stress buffering capacity and redox imbalance |
Redox marker levels/ratios (design-dependent); summary interpretation |
| One-carbon / nucleotide-related metabolism (optional) |
Biosynthetic support and stress response linked to mitochondrial pathways |
Target set (scope-dependent); group comparisons and pathway context |
What you receive
- Metabolite quantification tables (relative or absolute by study design)
- Statistical comparisons across groups plus concise, figure-ready summaries (scope-dependent)
- Pathway-focused interpretation centered on mitochondrial energy and redox biology
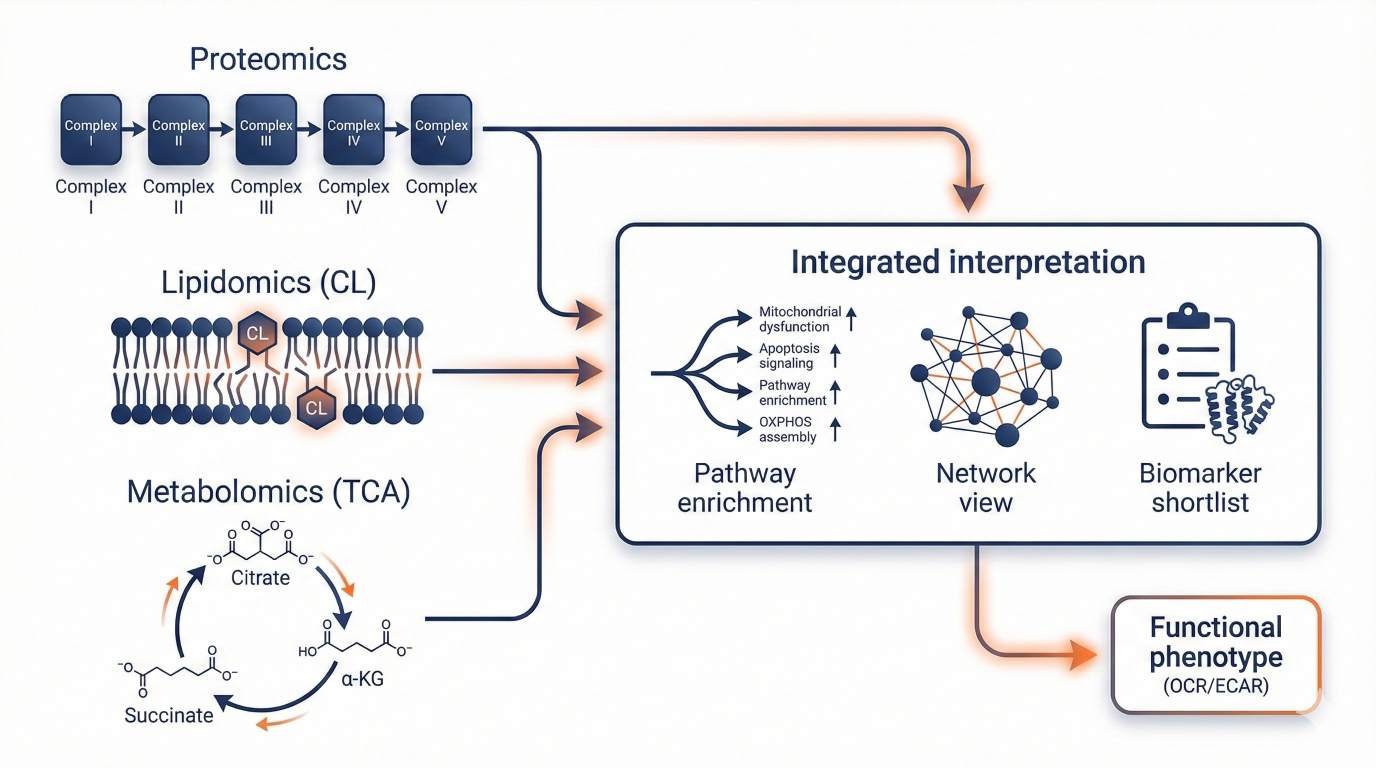 Multi-omics integration: proteomics + cardiolipin lipidomics + TCA metabolomics linked to functional phenotypes.
Seahorse XF Bioenergetics & Mitochondrial Functional Assays
Measure mitochondrial function in living systems with Agilent Seahorse XF bioenergetics (OCR/ECAR) and complementary assays for membrane potential (ΔΨm; TMRM/TMRE or JC-1), mitochondrial ROS (MitoSOX/Amplex Red), and ATP output (ATP/ADP). This combined workflow provides a mechanism-ready functional phenotype that can be directly integrated with proteomics, metabolomics, and lipidomics.
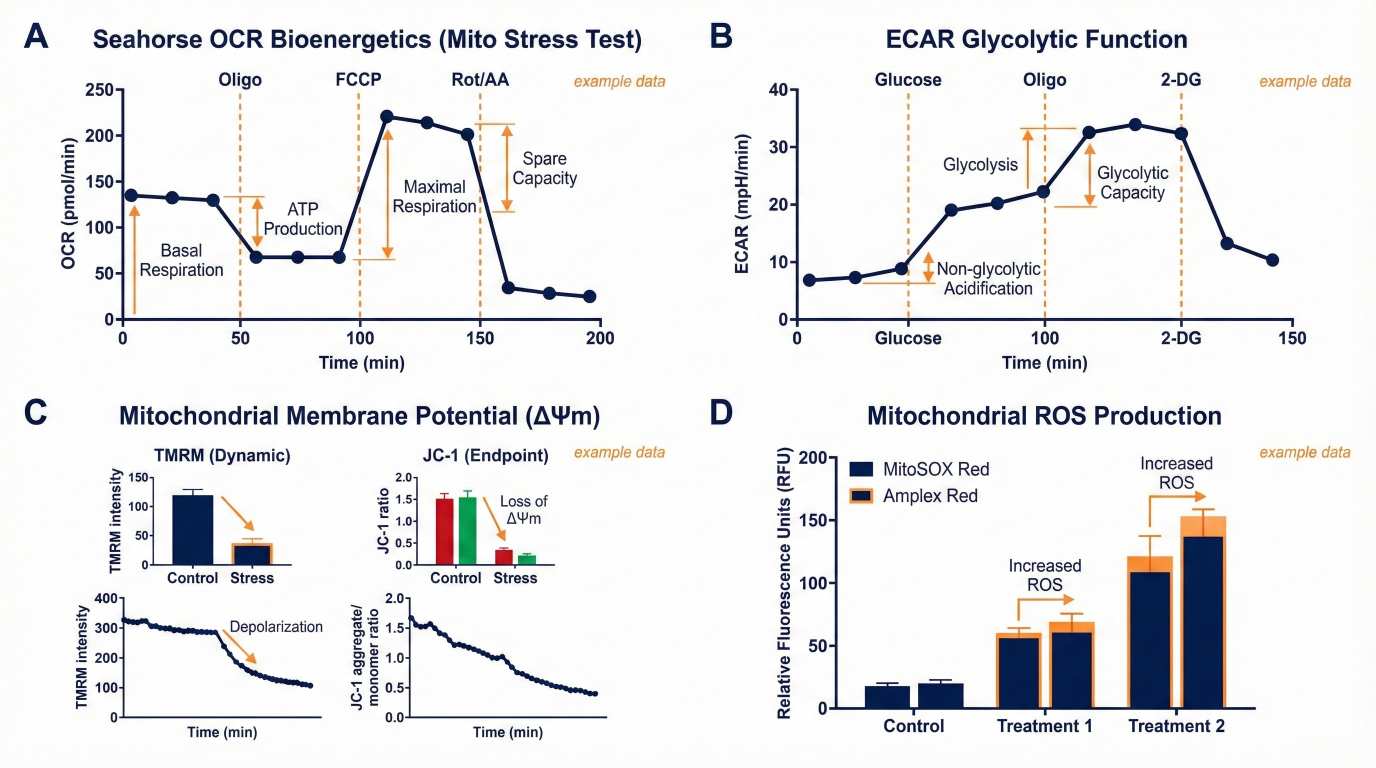 Example Seahorse OCR/ECAR and functional readouts: ΔΨm, mitoROS, and ATP/ADP.
Bioenergetics & Functional Assay Matrix (Gold-Standard Readouts)
| Assay dimension |
Key readouts |
Recommended platform |
What you learn |
| Bioenergetics |
OCR, ECAR, Basal respiration, ATP production, Maximal respiration, Spare respiratory capacity |
Agilent Seahorse XF (model per project) |
Distinguish OXPHOS capacity, glycolytic compensation, and stress resilience |
| Membrane potential (ΔΨm) |
Polarization vs depolarization dynamics |
TMRM/TMRE (dynamic) or JC-1 (ratiometric endpoint) |
Identify early dysfunction vs late collapse; evaluate drug toxicity and apoptosis progression |
| Mitochondrial ROS |
O2•−, H2O2 |
MitoSOX Red / Amplex Red |
Quantify mitochondria-linked oxidative stress and redox imbalance |
| ATP output |
ATP, ATP/ADP ratio |
Luminescence or targeted workflows (scope-dependent) |
Assess energy output efficiency and cellular energetic state (optional add-on; distinct from metabolomics panel). |
What you receive
- Seahorse raw curves + normalized results (OCR/ECAR)
- Calculated parameters: basal respiration, ATP production, maximal respiration, spare respiratory capacity (as applicable)
- Statistical comparisons across groups + figure-ready plots
- Optional: integrated interpretation with omics data (e.g., ETC protein changes, TCA metabolite shifts, cardiolipin remodeling)
ΔΨm Assay Selection (TMRM/TMRE vs JC-1)
| Your goal |
Recommended dye |
Why it's a good fit |
Service notes (to ensure interpretable data) |
| Track dynamic ΔΨm changes in live cells (time-course / treatment response) |
TMRM / TMRE |
Strong fit for dynamic monitoring when optimized; commonly used for live-cell workflows |
We optimize dye concentration/exposure and normalization strategy based on cell type and experimental design |
| Ratiometric endpoint comparison across groups (e.g., control vs treatment) |
JC-1 |
Provides ratiometric readout (aggregate/monomer) useful for endpoint comparisons |
We implement controls to reduce stress-related artifacts and confirm the most stable readout window |
| High-content imaging alignment with microscopy workflows |
TMRM / TMRE (preferred) or JC-1 |
TMRM/TMRE often integrate smoothly with live imaging; JC-1 can be used when ratiometric endpoint is needed |
We recommend the dye based on imaging modality, throughput, and phototoxicity constraints |
| Drug toxicity / apoptosis studies requiring early sensitivity |
TMRM / TMRE + optional ROS/ATP readouts |
ΔΨm changes are often early events; combining ΔΨm + ROS + ATP/ADP improves mechanistic confidence |
We can pair ΔΨm with MitoSOX/Amplex Red and ATP/ADP to support mechanistic interpretation |
We finalize the ΔΨm workflow during project scoping to match your sample type, throughput, and readout needs, and to ensure the clearest signal-to-noise for your model.
Functional add-ons (Optional)
Beyond OCR/ECAR, ΔΨm, ROS, and ATP readouts, we can add the following functional modules during project scoping to strengthen mechanism-level conclusions:
- Mitochondrial Ca²⁺ assays: evaluate calcium handling and stress coupling in live cells or isolated mitochondria. (link: /mitochondrial-calcium-ion-detection/)
- mPTP (permeability transition pore) assays: assess pore opening as an early injury/toxicity mechanism and mitochondrial integrity readout. (link: /mitochondrial-permeability-transition-pore-analysis/)
- Respiratory chain enzyme activity (Complex I–V): activity assays that complement ETC protein abundance from proteomics. (link: /mitochondrial-respiratory-chain-enzyme-analysis/)
- OXPHOS-focused functional profiling: design-focused stress tests to distinguish substrate limitation vs ETC capacity changes. (link: /mitochondrial-oxidative-phosphorylation-analysis/)
Not sure which modules you need? Share your model system and hypothesis—we will recommend the minimal, most interpretable readout set.
Mitochondrial Analysis: Instrumentation & Platform Selection
We use high-resolution mass spectrometry (MS) platforms to ensure accuracy, sensitivity, and data reliability. Based on your project needs, we choose the platform that best aligns with your analysis goals.
| Platform |
Ideal Use |
Key Features |
Best For |
| Orbitrap Exploris 480 |
Deep proteomics discovery |
High-resolution, advanced scan modes |
Complex sample analysis, protein discovery |
| Q Exactive HF-X |
Quantitative proteomics |
High sensitivity, optimized for DIA |
OXPHOS/ETC profiling, multi-condition studies |
| Triple Quadrupole (6500+) |
Targeted quantification |
Absolute quantification, MRM/SRM |
Protein verification (e.g., transporters) |
| Agilent Seahorse XF |
Functional assays (OCR/ECAR) |
Real-time bioenergetic measurement |
Mitochondrial bioenergetics, live-cell analysis |
| FAIMS Pro (Optional) |
Ion mobility separation |
Enhances sensitivity in complex samples |
Low-abundance proteins |
Orbitrap Exploris 480 (Figure from Thermo) |
Q Exactive HF-X MS (Figure from Thermo) |
Triple Quad™ 6500+ (Figure from Sciex) |
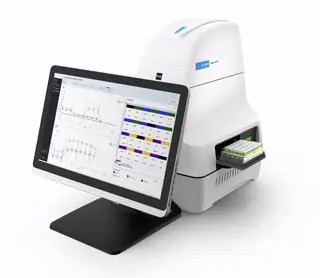
Seahorse XF (Figure from Agilent) |
Case Studies: Seahorse + Multi-Omics for Mitochondrial Mechanisms
Case 1: Kaempferol Improves Mitochondrial Respiration via Cardiolipin Remodeling in a Fatty Liver Cell Model (MASLD)
Objective: Test whether kaempferol improves mitochondrial respiration and cardiolipin (CL) profile in linoleic-acid–loaded hepatic cells.
Method: Seahorse extracellular flux analysis to quantify mitochondrial respiration parameters (incl. ATP-linked respiration), plus LC–MS lipidomics to quantify total CL, CL species (e.g., CL72:8), and MLCL/CL ratio.
Result: Kaempferol increased mitochondrial respiratory function (incl. ATP production) and improved CL metrics (higher total CL, increased CL72:8, improved MLCL/CL ratio), linking CL remodeling to energy output.
Read full article: Nutrients, 2024.
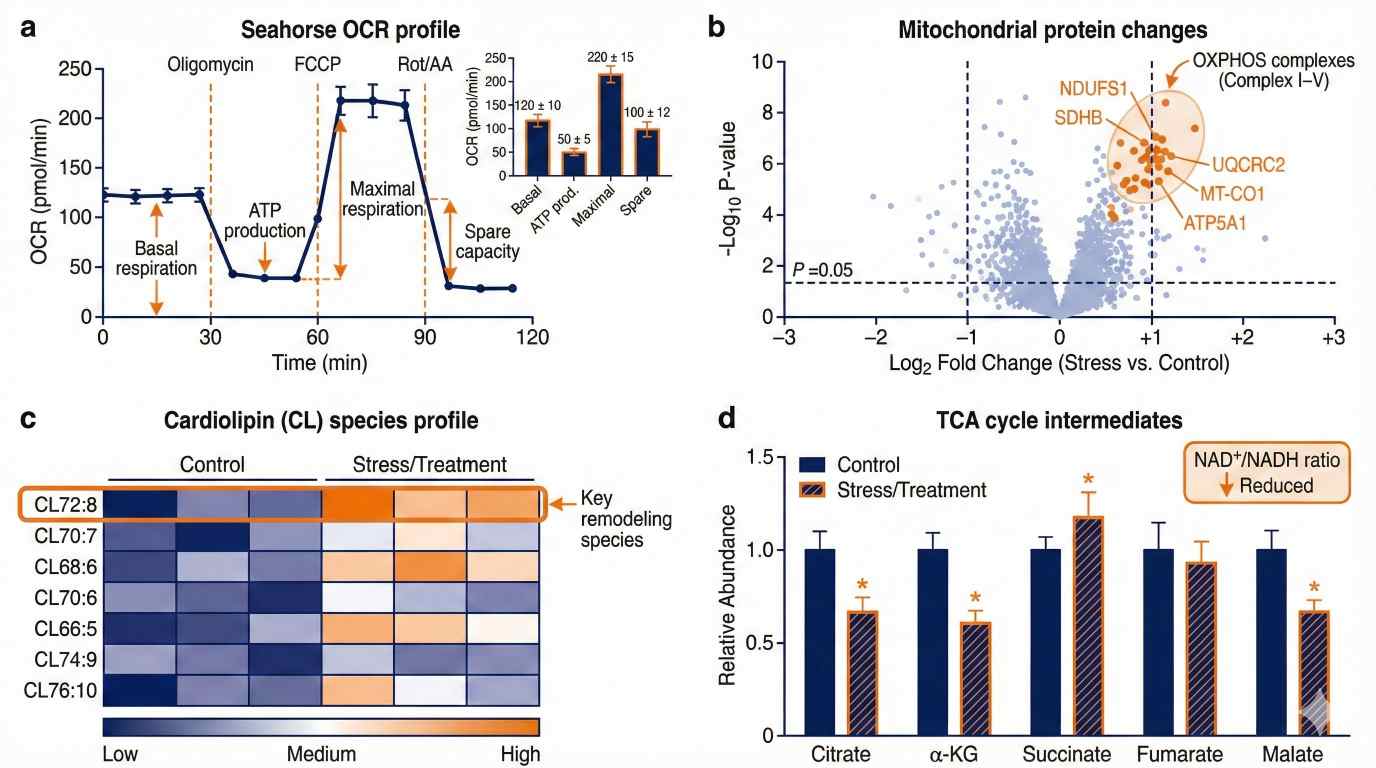 Illustrative integration: Seahorse OCR with proteomics, cardiolipin heatmap, and TCA metabolites for mechanism calls.
Sample Requirements & Shipping Guide
To ensure the best results for your mitochondrial analysis, we have specific guidelines for sample handling and shipping. Below are the key requirements for cells, fresh/frozen tissues, and isolated mitochondria.
Sample Types & Requirements
| Sample Type |
Requirements |
Storage & Shipping |
Notes |
| Cells (culture) |
Recommended: ~2 million cells per condition (low-input available upon request). |
For omics: frozen pellets on dry ice. For Seahorse/live cells: confirm shipping conditions in advance (cell-type dependent). |
Use appropriate culture medium and avoid contamination. |
| Fresh Tissue |
Fresh tissue (e.g., liver, muscle, brain) for mitochondrial isolation. |
Keep at 4°C for up to 24 hours; ship on ice packs. |
Minimize ischemia time and store tissues on ice until shipment. |
| Frozen Tissue |
Recommended: ~50 mg tissue (lower input may be possible upon request). |
Ship on dry ice. |
Tissue should be snap-frozen or stored at -80°C before shipping. |
| Isolated Mitochondria |
Recommended: ~1 mg protein (project-dependent; lower input may be possible). |
Ship on dry ice (frozen). |
Use high-purity mitochondrial preparations for accurate results. |
Key Shipping Guidelines
- Ship samples on dry ice for frozen tissues and mitochondria to maintain sample integrity.
- For fresh tissue: Use ice packs, ship overnight for optimal viability.
- Labeling: Clearly mark the tissue type, sample condition (e.g., frozen, fresh, isolated), and any special storage requirements.
Special Considerations
- If using frozen tissue, ensure no prior freeze-thaw cycles have occurred.
- For live cells, ensure they are shipped overnight under optimal conditions to preserve cell viability.
Note: Ensure that samples are well-packaged to prevent damage or thawing during transit.
FAQ
Q1: Why is density-gradient isolation (e.g., Percoll) preferred over kit-based enrichment for mitochondrial omics?
Answer: Kit-based enrichment can retain ER/MAM and cytosolic carryover, introducing background that obscures low-abundance mitochondrial transporters and distorts cardiolipin and TCA-related measurements. Density-gradient ultracentrifugation provides higher organelle resolution, supported by marker-based QC (mitochondrial enrichment plus ER/cytosol depletion) to maximize interpretability.
Q2: How do you integrate Seahorse XF functional data with MS-based proteomics?
Answer: We integrate datasets through cross-platform correlation. For example, reduced maximal respiration can be assessed alongside MS-proteomics changes in ETC complexes I–V and assembly factors, helping clarify whether the phenotype aligns with altered protein abundance or complex composition shifts, linking functional readouts to molecular drivers.
Q3: What normalization approaches do you recommend for mitochondrial assays?
Answer: Total protein is a common baseline, but we often recommend a second normalization factor such as citrate synthase activity or VDAC1/COX IV abundance to account for differences in mitochondrial mass and integrity. For isolated mitochondria respiration assays (when applicable), citrate synthase–based normalization helps distinguish changes in mitochondrial quality from differences in mitochondrial quantity.
Q4: Why is cardiolipin (CL) profiling widely used as a key indicator of mitochondrial health?
Answer: Cardiolipin is highly enriched in the inner mitochondrial membrane and supports ETC supercomplex stability and cristae structure. Tracking MLCL/CL ratio and CL species remodeling (e.g., CL 72:8) can sensitively reflect mitochondrial stress and toxicity mechanisms that may be missed in whole-cell lipidomics.
Q5: Can I measure physiological OCR (Seahorse bioenergetics) from frozen tissue?
Answer: Generally no—freeze–thaw disrupts membrane integrity and coupling, so OCR measurements from frozen tissue are not reliable for physiological bioenergetics. Functional assays require viable cells or freshly isolated mitochondria, while snap-frozen tissues are well suited for endpoint molecular profiling, including proteomics, lipidomics, and targeted TCA-related metabolomics.