High-Plex Single-Cell Spatial Protein Profiling (CODEX Upgraded) on FFPE, Fresh-Frozen (OCT), and TMA
Enable whole-slide high-plex multiplex immunofluorescence (mIF) and single-cell spatial proteomics outputs—from images to cell×marker matrices, cell neighborhoods, and cell–cell proximity interaction features for translational research and cohort-scale discovery.
Overview Advantages Workflow Antibody Panel Deliverables ApplicationsSample RequirementsCase StudiesFAQ Get a Custom Proposal
Service Overview: High-Plex Single-Cell Spatial Proteomics (PCF / CODEX Lineage)
PCF-based spatial proteomics (CODEX lineage) enables ultra-high-plex protein detection directly in tissue while preserving architecture. This service is designed to deliver decision-ready outputs—from whole-slide multiplex images to analysis-ready single-cell matrices and spatial analytics.
With PCF spatial proteomics, you can study:
- Cell types and functional states in situ
- Spatial microenvironments and immune niches
- Whole-slide heterogeneity across regions (e.g., adjacent → invasive margin → tumor core)
- Cohort-scale comparisons with standardized outputs and QC
Technology Principle: DNA-Barcoded Antibodies And Cyclic Imaging (IP-Safe)
PCF/CODEX workflows use DNA-barcoded antibodies and fluorescent reporter probes to enable high-plex imaging on a single tissue section:
- Antibodies carry unique DNA barcodes
- Reporter probes hybridize to barcodes to reveal signal
- Cycles repeat: Hybridize → Image → Remove → Repeat
- The same tissue section accumulates high-plex profiles across cycles
Key Advantages And Differentiators: High-Plex, Single-Cell, Whole-Slide
High-Plex Multiplex Immunofluorescence: 100+ Marker Capability
Compared to conventional IHC or low-plex IF, PCF workflows support dozens to 100+ protein markers per tissue section (feasibility depends on tissue type, background, and panel design). This unlocks:
- Multi-lineage phenotyping (immune, tumor, stroma, vasculature)
- Functional state mapping (activation, exhaustion, proliferation, metabolism-associated markers)
- Co-expression patterns and pathway adjacency relationships
- High-dimensional discovery without losing spatial context
Whole-Slide Spatial Proteomics: Unbiased Mapping Across The Entire Section
Whole-slide imaging is a major differentiator versus ROI-only approaches:
- Global coverage: avoids pre-selecting ROIs and missing critical niches
- Heterogeneity quantification: measure regional differences across the full slide
- Rare event capture: detect rare structures (e.g., TLS-like regions) and gradients
- Cohort readiness: consistent rules for spatial features across many slides
Single-Cell Spatial Protein Profiling: Quantification In Tissue Context
Single-cell quantification preserves spatial meaning while enabling robust downstream analysis and cohort comparability.
How It Works: PhenoCycler-Fusion Spatial Proteomics Workflow
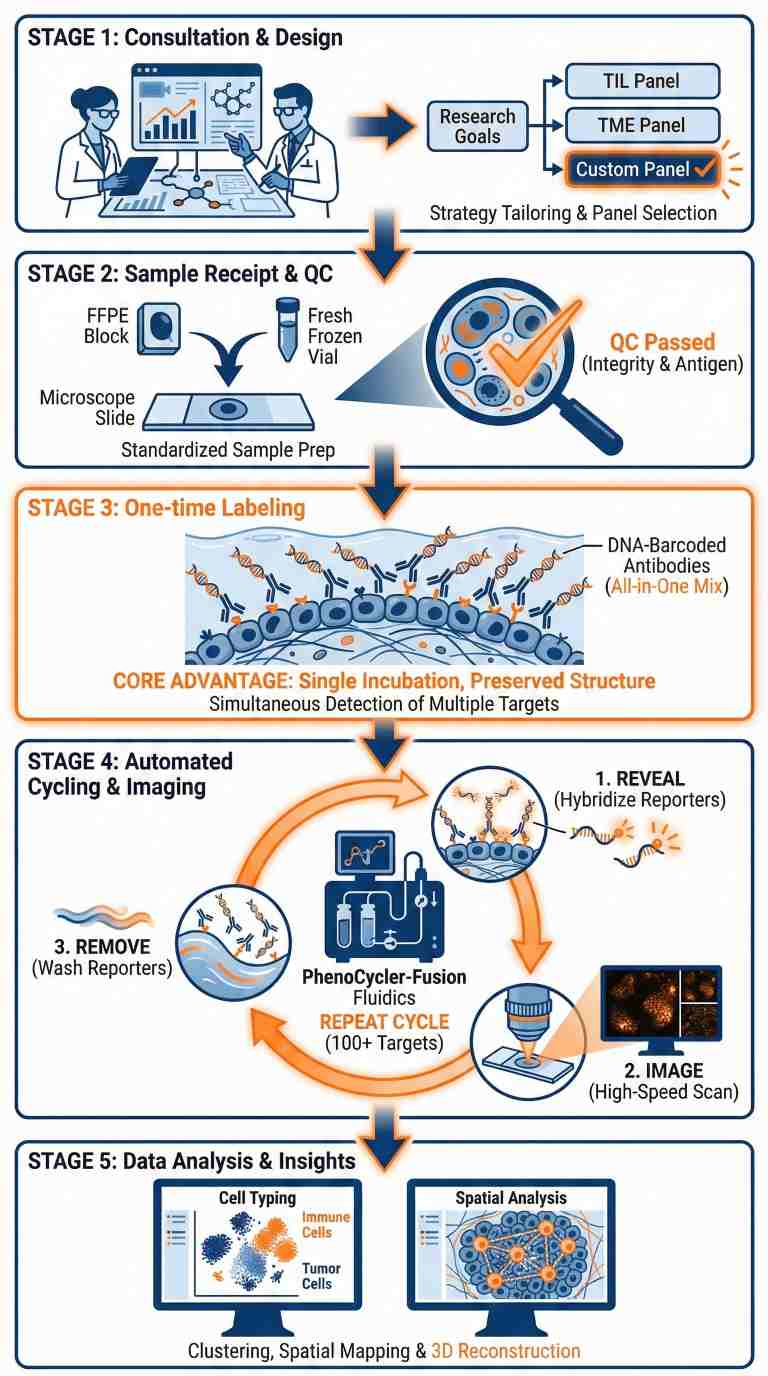 Comprehensive service workflow for PhenoCycler-Fusion single-cell spatial proteomics and high-plex protein imaging.
Antibody Panel Options
32-Plex Antibody Panel for Human FFPE Samples
Scope: Applicable across multiple cancer types.
Immune Core & Lymphocyte Function
| Protein Marker |
Biological Relevance |
Protein Marker |
Biological Relevance |
| CD4 |
Helper T cells |
FoxP3 |
Regulatory T cells (Tregs) |
| CD68 |
Macrophages |
Granzyme B |
Activated T cells or NK cells |
| CD20 |
B cells |
CD21 |
B cells, Follicular Dendritic Cells (FDC) |
| CD8 |
Cytotoxic T cells |
CD79a |
B cells |
| HLA-DR |
Antigen-presenting cells (MHCII) |
TCF-1 |
Wnt signaling transcription factor |
| CD3e |
T cells |
TOX |
T cell exhaustion transcription factor |
| CD44 |
Activated T cells |
|
|
| CD45 |
Leukocytes (White blood cells) |
|
|
| CD14 |
Monocytes |
|
|
| Ki67 |
Proliferating cells |
|
|
| CD45RO |
Memory T cells |
|
|
| Pan-Cytokeratin |
Epithelial & tumor cells |
|
|
Immune Effects, Checkpoints & Structural Markers
| Protein Marker |
Biological Relevance |
Protein Marker |
Biological Relevance |
| IDO1 |
Immune checkpoint |
CD31 |
Endothelial cells |
| PD-1 |
Immune checkpoint |
CD34 |
Endothelial / Hematopoietic stem cells |
| PD-L1 |
Checkpoint / PD-1 ligand |
Beta-actin |
Cytoskeletal protein |
| IFNG |
Immune effector cytokine |
E-cadherin |
Adhesion protein (Epithelial) |
|
|
SMA |
Alpha-Smooth Muscle Actin |
|
|
Vimentin |
Mesenchymal cell marker |
|
|
Collagen IV |
Extracellular matrix (ECM) |
|
|
b-Catenin1 |
Cell adhesion / Wnt signaling |
|
|
Podoplanin |
Lymphatic endothelial cells |
|
|
Caveolin |
Caveolae membrane protein |
Core Panel (25-Plex, Mouse Fresh Frozen Samples)
| Protein Marker |
Biological Relevance |
Protein Marker |
Biological Relevance |
| CD90 |
HSCs, T cells, Fibroblasts |
CD38 |
NK, Monocytes, Activated B/T cells |
| CD31 |
Vascular epithelium |
Ly6g |
Neutrophils |
| TCR |
T cells |
CD21/35 |
Mature B cells, FDCs |
| Ter119 |
Red blood cells |
CD71 |
Bone marrow progenitor cells |
| CD44 |
Activated T cells |
IgD |
Naive B cells |
| CD45 |
Immune cells |
CD4 |
Helper T cells |
| CD19 |
B cells, FDCs |
CD11c |
Dendritic cells (DCs) |
| CD169 |
Macrophages |
CD24 |
Dendritic cells (DCs) |
| CD45R/B220 |
B cells |
CD8a |
Cytotoxic T cells |
| MHCI |
Antigen-presenting cells |
CD49f |
Endothelial cells |
| CD3 |
T cells |
CD11b |
Myeloid cells |
| IgM |
Immature B cells |
Ki67 |
Proliferating cells |
| CD5 |
T cells |
|
|
Deliverables And Service Packages: L1 Images, L2 Single-Cell Matrix, L3 Spatial Analytics
We offer tiered deliverables so teams can match scope to budget and decision needs.
L1: Whole-Slide Multiplex Images + QC Summary
- Multiplex images (whole-slide or multi-ROI)
- QC summary: section integrity + image quality + background screening
L2: Single-Cell Matrix + Phenotypes + Coordinates
We deliver analysis-ready single-cell outputs (not just images):
- Cell × marker expression matrix (per-cell quantified protein signals)
- Cell phenotype labels (cell types/states; project-specific)
- Per-cell coordinates (x, y) with QC flags
- Optional compartment labels (tumor/stroma/immune regions; project-specific)
L3: Neighborhoods + Interaction Features + Report-Ready Figures
Beyond "cell counts," we provide spatial inference outputs such as:
- Neighborhood analysis: microenvironment "niches" and spatial microdomains
- Proximity/interaction feature tables: who is near whom (contact-like spatial relationships)
- Spatial enrichment / co-localization metrics
- Group comparisons when cohort labels are provided (e.g., treatment response groups)
- Optional report deck: methods overview + QC appendix + key figures
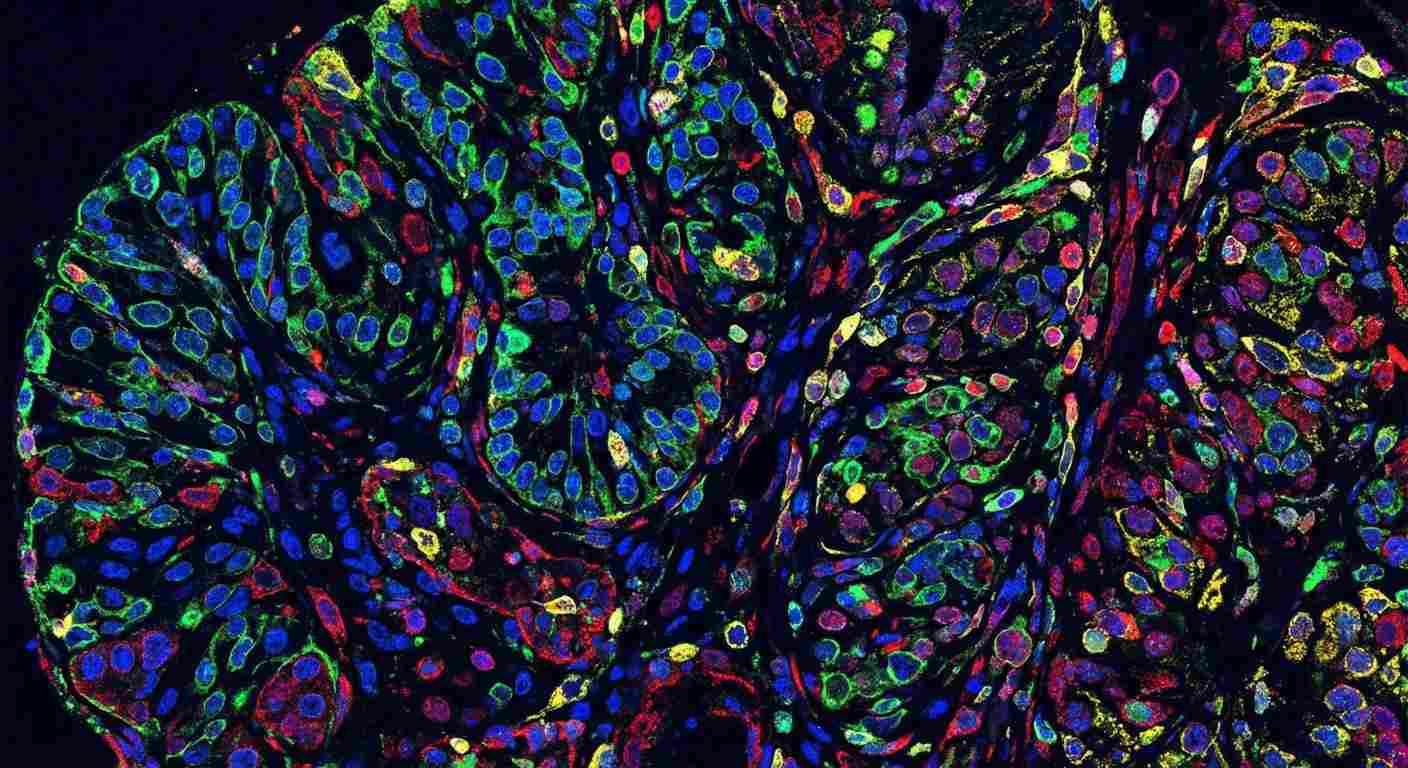
Multiplex Single-Cell Imaging
High-resolution PhenoCycler-Fusion multiplex immunofluorescence showing diverse protein expression at single-cell resolution.
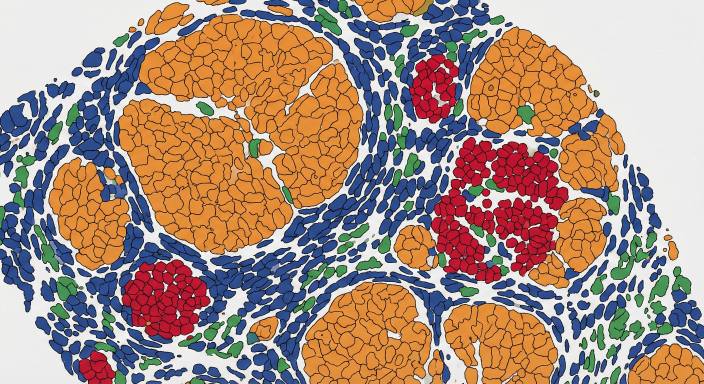
Cell Segmentation & Phenotype Mapping
Single-cell segmentation and phenotype map illustrating the spatial clustering of distinct cell types in the tissue microenvironment.
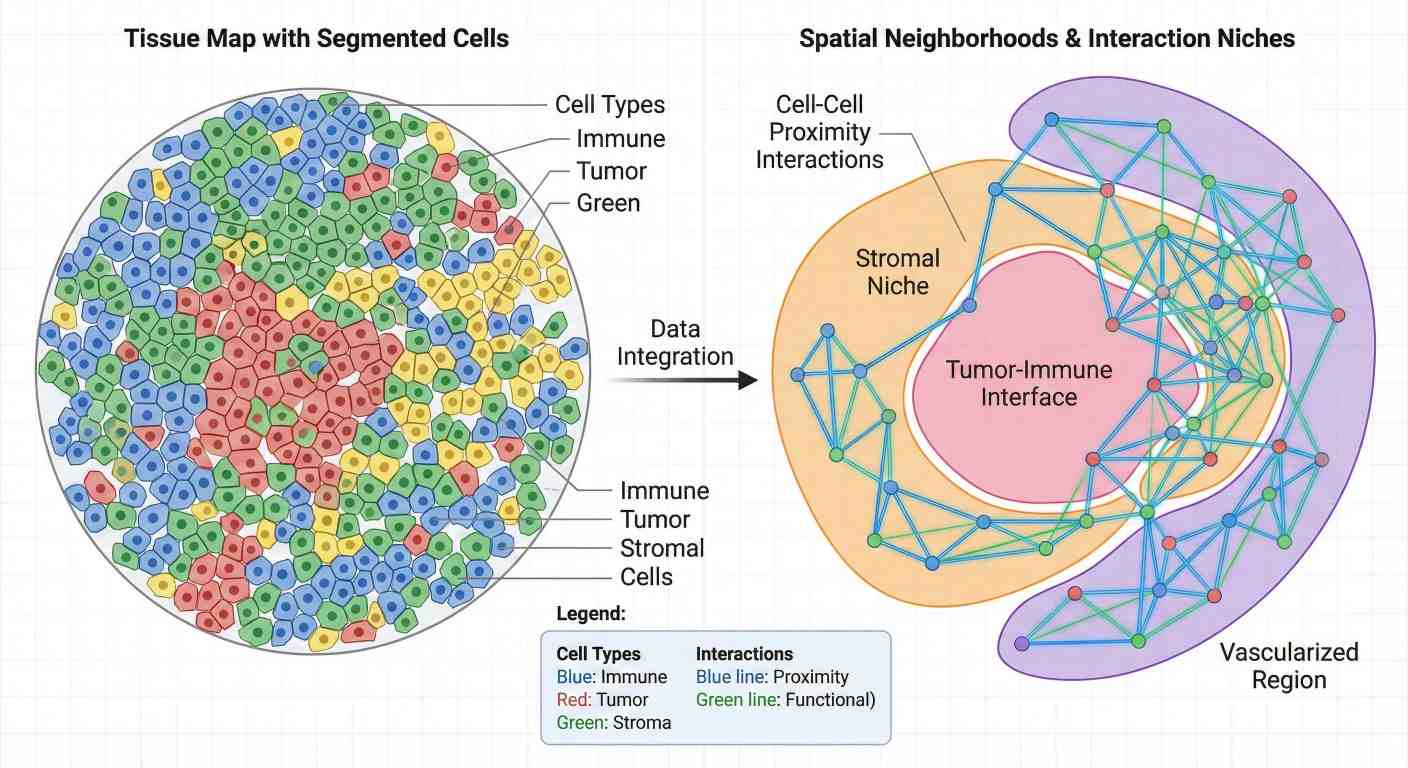
Spatial Neighborhood & Niche Analysis
Spatial neighborhood analysis identifying microenvironmental niches and cell-cell proximity interactions within the tumor microenvironment.
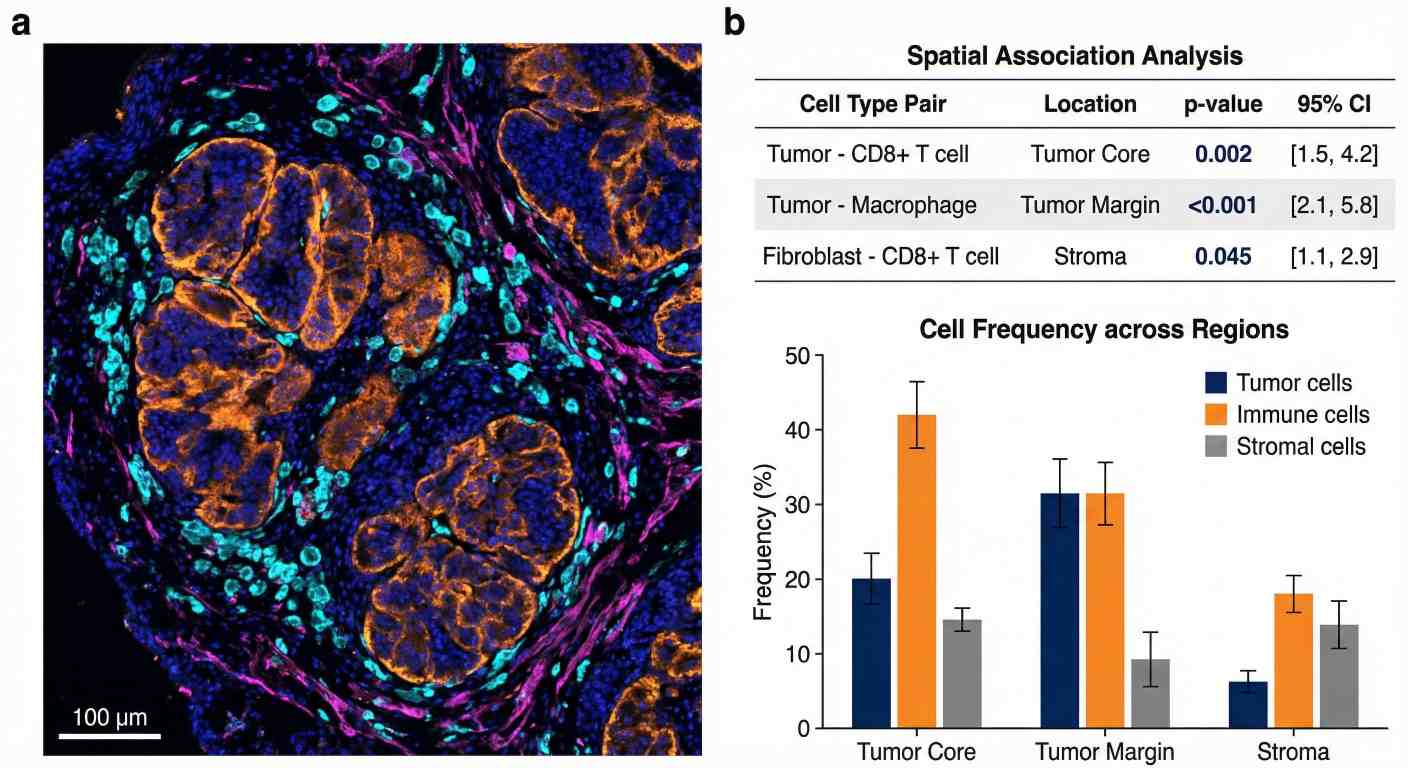
Quantitative Spatial Cohort Analytics
Quantitative spatial analytics combining high-plex imaging with statistical data on cell frequencies and regional associations.
Technical Specifications
Best displayed as a compact table for quick scanning.
| Parameter |
Typical Statement |
| Spatial Resolution |
Up to 0.25 µm pixel size (subcellular-level imaging) |
| Plex Level |
Typical starting point: ~10 markers; capability up to 100+ (feasibility-dependent) |
| Sample Types |
Human / Mouse (project-dependent) |
| Compatible Formats |
FFPE sections / OCT fresh-frozen sections / TMA cores |
| Imaging Coverage |
Whole-slide (preferred for discovery) or multi-ROI (targeted) |
| Example Imaging Area |
Up to ~35 mm × 18 mm scan region (layout-dependent) |
 PhenoCycler-Fusion 2.0 (Fig from Quanterix)
Key Applications: Tumor Microenvironment, Immunotherapy, And Cohort Studies

Tumor Microenvironment (TME) Profiling
Map immune infiltration, stromal architecture, and immune-excluded niches in situ.

Immunotherapy Mechanism & Resistance
Localize checkpoint proteins and quantify immune-suppressive patterns and functional states.

Exploratory Biomarkers
Discover spatial signatures and neighborhood features linked to groups (e.g., pre/post, responder/non-responder).

Large Cohorts / Multi-Site Studies
Standardize outputs with batch-aware processing and audit-friendly QC documentation.

Pathology + AI Enablement
Generate high-dimensional spatial "label layers" for model training, validation, and benchmarking.
Tissue Sample Submission Guidelines for PhenoCycler-Fusion
| Category |
FFPE Sections |
Fresh-Frozen (OCT) Sections |
TMA Cores |
| Recommended Thickness |
5 µm |
8 µm |
Commonly 5 µm |
| Slide Type |
Anti-detachment / adhesive slides preferred |
Anti-detachment / adhesive slides preferred |
Anti-detachment / adhesive slides preferred |
| Must Avoid |
Detachment, major folds, tears, heavy scratches, contamination |
Cracking, frost/ice artifacts, detachment, major folds, contamination |
Core loss, cracking, severe folds, contamination |
| Known Risks (Tell Us) |
Necrosis, calcification, high autofluorescence |
High autofluorescence, fragile morphology |
Low cellularity, mixed regions, high background |
| Required Metadata |
Tissue type, fixation/embedding, thickness, prior stains |
Tissue type, freezing/embedding, thickness, prior stains |
Core map (if available), tissue types, thickness, prior stains |
| Cohort Labels (If Any) |
Timepoints, arms, responder status, key covariates |
Same as FFPE |
Same as FFPE |
| Must-Have Targets |
Required markers + known problematic targets |
Same as FFPE |
Same as FFPE |
| Handling |
Protect slides; clear labeling |
Cold-chain as needed; protect from moisture/damage |
Protect slides; include core map if available |
Case Study
Case 1 — CRC invasive front neighborhoods → antitumor immunity
Spatial cellular neighborhoods at the CRC invasive front organize anti-tumor immunity and stratify risk.
Study snapshot
- Context: colorectal cancer invasive front
- Readout: high-plex spatial protein imaging (CODEX lineage)
- Scale: 35 patients; 140 regions; 56 proteins (reported)
Spatial features extracted
- Cellular neighborhood (microdomain) definitions
- Cell–cell proximity patterns across the margin
- Region-aware immune enrichment signatures
Why it mattered
- Neighborhood structure correlated with clinical risk biology
- PD-1⁺ CD4⁺ T cell enrichment in local niches associated with survival in a high-risk subset
What we can replicate in your project
- Whole-slide or multi-ROI invasive-front profiling
- L3 outputs: neighborhood metrics + proximity feature tables + group comparison (e.g., high vs low risk)
Reference
Schürch CM, et al. Coordinated Cellular Neighborhoods Orchestrate Antitumoral Immunity at the Colorectal Cancer Invasive Front. Cell. 2020. DOI: 10.1016/j.cell.2020.07.005
Learn More
Case 2 — HCC margin interactions: TAM → MAIT dysfunction
Spatial interaction mapping at the HCC tumor–liver interface links TAM states to MAIT dysfunction.
Study snapshot
- Context: hepatocellular carcinoma invasive margin
- Readout: CODEX imaging + scRNA-seq (reported)
- Scale: multi-million single cells (reported)
Spatial features extracted
- Interface niche localization (tumor core → margin → adjacent)
- Co-localization/proximity of TAM states with MAIT cells
- Microenvironment-driven phenotype shifts across regions
Why it mattered
- MAIT dysfunction and reduced cytotoxicity were spatially patterned
- TAM PD-L1 state and co-localization helped explain immune suppression at the interface
What we can replicate in your project
- Margin-to-core gradients and interface niche definition
- L3 outputs: proximity network + compartment-aware enrichment with optional multi-omics alignment
Reference
Ruf B, et al. Tumor-associated macrophages trigger MAIT cell dysfunction at the HCC invasive margin. Cell. 2023. DOI: 10.1016/j.cell.2023.07.026
Learn More
Case 3 — Glioblastoma multi-layer spatial organization
Integrated spatial profiling reveals structured layers in glioblastoma that routine histology can miss.
Study snapshot
- Context: glioblastoma spatial organization
- Readout: integrative spatial analysis (protein + RNA, reported)
- Output: structured vs disorganized regions; layered architecture linked to hypoxia
Spatial features extracted
- Layer-wise spatial state organization
- Region classification beyond classic pathology
- Multi-scale mapping: cell state → tissue architecture
Why it mattered
- Spatial architecture explained heterogeneity not captured by standard pathology
- Provides a framework for interpreting microenvironment constraints
What we can replicate in your project
- Whole-slide mapping + region annotation + niche segmentation
- L3 outputs: spatial domains + enrichment heatmaps + report-ready figures
Reference
Greenwald AC, et al. Integrative spatial analysis reveals a multi-layered organization of glioblastoma. Cell. 2024. DOI: 10.1016/j.cell.2024.03.029
Learn More
Case 4 — Pan-cancer 2D/3D evolution and microenvironment interactions
Multi-modal spatial profiling connects subclonal programs to local microenvironment interactions in 2D and 3D.
Study snapshot
- Context: 6 cancer types; multi-region analysis (reported)
- Readout: spatial transcriptomics + PCF/CODEX-style spatial proteomics + single-cell/nuclei (reported)
- Output: 2D + reconstructed 3D interaction landscapes
Spatial features extracted
- Microregion-specific tumor–immune / tumor–stroma interaction differences
- Regional heterogeneity and niche connectivity across sections
- Spatially resolved pathway activity patterns (reported)
Why it mattered
- Distinguishes primary vs metastatic features at microregion level
- Links evolution and interaction niches in a way dissociated assays cannot
What we can replicate in your project
- Cohort-scale region-aware spatial features for group comparisons
- Optional integration-ready outputs (protein features aligned to external RNA modalities)
Reference
Mo CK, et al. Tumour evolution and microenvironment interactions in 2D and 3D space. Nature. 2024. DOI: 10.1038/s41586-024-08087-4
Learn More
FAQ
Q: What sample types work best for PhenoCycler-Fusion spatial proteomics?
A: FFPE sections are commonly used for cohort consistency, while fresh-frozen can improve some epitopes; suitability depends on tissue autofluorescence, morphology preservation, and whether your targets require specific fixation conditions.
Q: How many markers can I realistically run in a single tissue section?
A: High-plex designs can scale to dozens or 100+ markers, but practical plex depends on tissue background, antigen abundance, antibody performance, and panel engineering to avoid low-signal or high-noise targets.
Q: Can I start from a standard immune panel and expand later?
A: Yes—many projects begin with a core TME/TIL backbone, then add functional modules (checkpoint, proliferation, myeloid states, vasculature) once signal quality and segmentation performance are confirmed on your tissue type.
Q: How do you prevent "pretty images" that can't be analyzed statistically?
A: Require analysis-ready outputs: per-cell quantified expression, coordinates, phenotype labels, and QC flags; without these, downstream neighborhood statistics, cohort comparisons, and AI model training are unreliable.
Q: What is the biggest reason high-plex spatial projects fail?
A: Panel and tissue issues: poorly validated antibodies, strong autofluorescence, low antigen preservation, or uncontrolled background lead to weak separability between cell states and unstable clustering or neighborhood calls.
Q: How is cell segmentation quality verified?
A: Use spot-checks across easy and challenging regions (dense lymphoid, tumor-stroma borders), review boundary errors, and track QC flags so mis-segmented cells can be excluded from sensitive spatial statistics.
Q: Can you compare responders vs non-responders or pre- vs post-treatment groups?
A: Yes, if group labels and covariates are provided; spatial features like neighborhood composition, proximity metrics, and compartment-enrichment can be tested across groups with batch-aware reporting.
Q: Do I need whole-slide imaging, or is ROI enough?
A: ROI is efficient for hypothesis validation, but whole-slide is better for unbiased niche discovery, spatial gradients (margin-to-core), and rare structure capture such as TLS-like regions that ROI selection can miss.
Q: What data formats will I receive for downstream bioinformatics?
A: Expect an image package plus single-cell tables (cell × marker), spatial coordinates, phenotype annotations, and QC metadata; these can be exported for common spatial toolchains and machine-learning pipelines.
Q: Can spatial proteomics be integrated with scRNA-seq or spatial transcriptomics?
A: Yes—protein phenotypes can anchor cell-state interpretation and validate spatial niches; integration typically aligns cell types/states and compares spatial enrichment patterns across modalities.
Q: How do you handle batch effects in multi-site or multi-run cohorts?
A: Capture batch metadata, use consistent panel/controls, and apply normalization strategies appropriate to multiplex imaging so that group differences reflect biology rather than staining or imaging variation.