
Protein abundance is often treated as the primary readout in proteomics. However, cellular function depends not only on abundance, but also on protein localization, timing of translocation, and proximity to functional partners.
A kinase that becomes functionally active upon translocation to the plasma membrane, a transcription factor whose activity depends on nuclear accumulation, or an immune adaptor that relocalizes to mitochondria during antiviral signaling—these are localization-dependent events.
This article summarizes mass spectrometry (MS)-based spatial proteomics strategies for subcellular protein localization, following the logic that many research questions are really protein translocation questions. We'll focus on the two dominant experimental philosophies—profile-based fractionation and proximity labeling—then connect them to differential localization statistics (pRoloc/BANDLE) and instrument choices that decide whether your organelle map is crisp or blurred.
Key Takeaway: In spatial proteomics, small quantitative distortions can create big biological errors. Your sample prep, quantitation method, and computational model have to be designed as a single system.
Subcellular protein localization explains what abundance can't
A cell's functional state depends on both composition and organization. Two conditions can have nearly identical global abundances yet behave very differently because proteins are redistributed across compartments. This is common in:
- Oncogenic signaling, where adaptor proteins and kinases change compartment access rather than expression.
- Metabolic switching, where enzymes re-localize to contact sites, membranes, or organelle lumens.
- Innate immune responses, where complex assembly and trafficking determine which pathways fire.
A common failure mode in standard proteomics occurs when no significant differential expression is observed, even though the phenotype is evident. Spatial proteomics addresses this gap.
Why traditional spatial imaging can't solve this alone
Immunofluorescence and genetically encoded reporters (e.g., GFP fusion proteins) can be powerful, but they have structural limits when the question is global and discovery-driven:
- Low multiplexing: imaging rarely scales to thousands of endogenous proteins in a single experiment.
- Reagent dependency: IF depends on antibody specificity and epitope accessibility; both can fail silently.
- Engineering burden: GFP tagging changes stoichiometry, can disrupt trafficking signals, and doesn't generalize to primary tissues.
- Limited discovery: imaging typically tests known hypotheses; it doesn't map unknown endogenous proteins at proteome scale.
Why MS-based spatial proteomics is the definitive solution
MS-based spatial proteomics addresses those constraints by measuring endogenous proteins across fractionation profiles or proximity-labeled neighborhoods. In practice, it enables:
- Unbiased proteome-wide mapping across organelles.
- Quantitative organelle-resolved profiles that can be compared across conditions.
- Native samples (depending on strategy), including primary cells and tissues.
The rest of this article is a guide to the major MS-based strategies and how to choose between them without compromising quantitative integrity.
Organellar Mapping via Profile-Based Fractionation: The HyperLOPIT Paradigm
A practical way to frame this part of the workflow is to ask: "Can I trust the profile shape?" If the answer is yes, fractionation-based spatial proteomics can give you a global organelle map without genetic engineering.
Profile-based spatial proteomics starts with a simple idea: if you fractionate a cell into a series of biochemical fractions, proteins that share a subcellular location will co-distribute across those fractions.
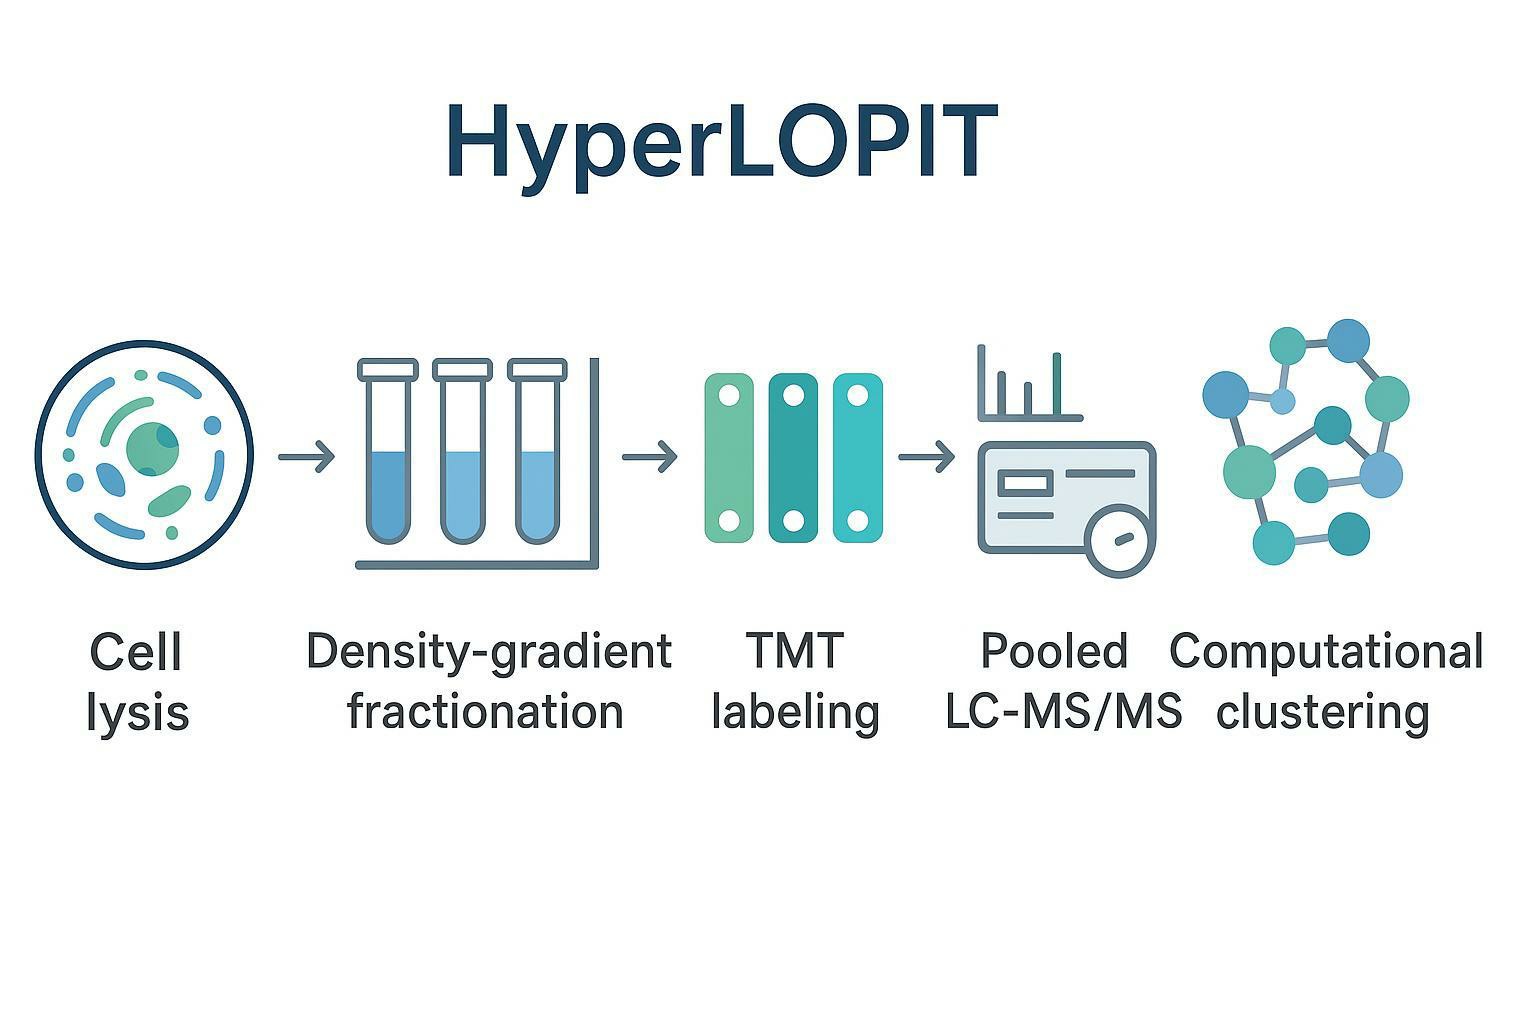
HyperLOPIT (Hyperplexed Localization of Organelle Proteins by Isotope Tagging) operationalizes that idea at scale by combining:
- continuous fractionation (often density gradients),
- multiplexed quantitation across many fractions,
- and supervised machine learning anchored to marker proteins.
Profile-based fractionation: what you're actually measuring
In a typical HyperLOPIT-style experiment, you generate dozens of fractions spanning gradients enriched for membranes and organelles. Each protein becomes a vector: its relative abundance across fractions. The analysis does not rely on a single "mitochondria fraction" or "nuclear pellet." It relies on the shape of a distribution profile.
This is also why fractionation quality matters more than most teams expect. If the upstream separation is sloppy, the downstream model will still classify proteins, but it will classify noise.
If you need to start with robust organelle enrichment or purification workflows before MS, Organelle isolation and protein purification is often the practical prerequisite for building a usable spatial map.
TMT SPS-MS3 multiplexing to eliminate ratio compression
Spatial fractionation experiments are fraction-heavy by design. You might collect 10–30 gradient fractions (or more), and you need to quantify all fractions on a shared scale.
Running each fraction as a separate LC-MS/MS injection sounds straightforward, but it creates a statistical failure mode: run-to-run variation can exceed the subtle profile differences that separate organelles.
That's why multiplexing is not a convenience here—it's structural.
Why MS2 TMT causes ratio compression (and why spatial maps suffer first)
In MS2-based TMT quantification, co-isolated peptides contaminate reporter ion signals, flattening real fold changes into smaller apparent changes. This is ratio compression.
In spatial proteomics, ratio compression has an outsized impact because organelle resolution depends on subtle, fraction-by-fraction differences. When profiles flatten, clusters collapse.
A useful technical framing comes from work on interference and ratio compression in isobaric proteomics, including Measuring and managing ratio compression for accurate iTRAQ/TMT protein quantitation.
Why SPS-MS3 is the clean fix
SPS-MS3 (Synchronous Precursor Selection-MS3) shifts quantification to an MS3 scan built from multiple MS2 fragment ions, which reduces reporter ion contamination from co-isolated peptides. The practical outcome is higher quantitative fidelity across channels, which translates to cleaner organelle clusters.
For method-development context on tribrid SPS-MS3 performance and throughput tradeoffs, see Benchmarking the Orbitrap Tribrid Eclipse for Next Generation Multiplexed Proteomics.
⚠️ Warning: If your spatial map relies on subtle profile differences, MS2-level interference can make organelles look biochemically inseparable even when the fractionation was actually good.
Resolving Overlapping Compartment Boundaries via Machine Learning
Even strong fractionation has physics you can't cheat. Some compartments are biochemically proximate and co-migrate in gradients. A common example is the endoplasmic reticulum (ER) and Golgi, which can overlap depending on lysis conditions, membrane integrity, and gradient design.
The computational solution is to treat spatial proteomics as a supervised classification problem:
- Curate marker proteins with well-validated localization.
- Train classifiers such as Support Vector Machines (SVMs) or Random Forests.
- Predict compartment membership for unassigned proteins.
- Report not only class labels, but localization probabilities (and, ideally, "unclassified" states when evidence is weak).
In practice, marker quality is the fulcrum. If markers are wrong, the model will still perform—just toward the wrong truth.
This is also where experimental design meets biology: if you care specifically about ER vs Golgi resolution, you often need targeted enrichment and validation. For teams who need membrane-focused workflows and ER membrane protein handling, Endoplasmic reticulum isolation and ER membrane protein purification is the kind of upstream capability that can decide whether the overlap is manageable.
If your core question centers on Golgi-associated redistribution or secretory trafficking, Golgi apparatus proteomics services is often a natural internal starting point for sample and fraction design.
Proximity Labeling and Compartment-Targeted Chemoproteomics
Fractionation-based mapping is powerful for global organelle assignment, but it has a known blind spot: many biologically meaningful protein neighborhoods are transient or mechanically fragile.
If your question is "What proteins are near my bait?" or "What's the local proteome at a contact site during signaling?", proximity labeling and chemoproteomics are often the better first tool.
High-Kinetics Enzymatic Labeling Workflows
Proximity labeling uses an enzyme targeted to a subcellular region (or fused to a bait protein) to covalently tag nearby proteins in living cells, allowing enrichment and MS identification.
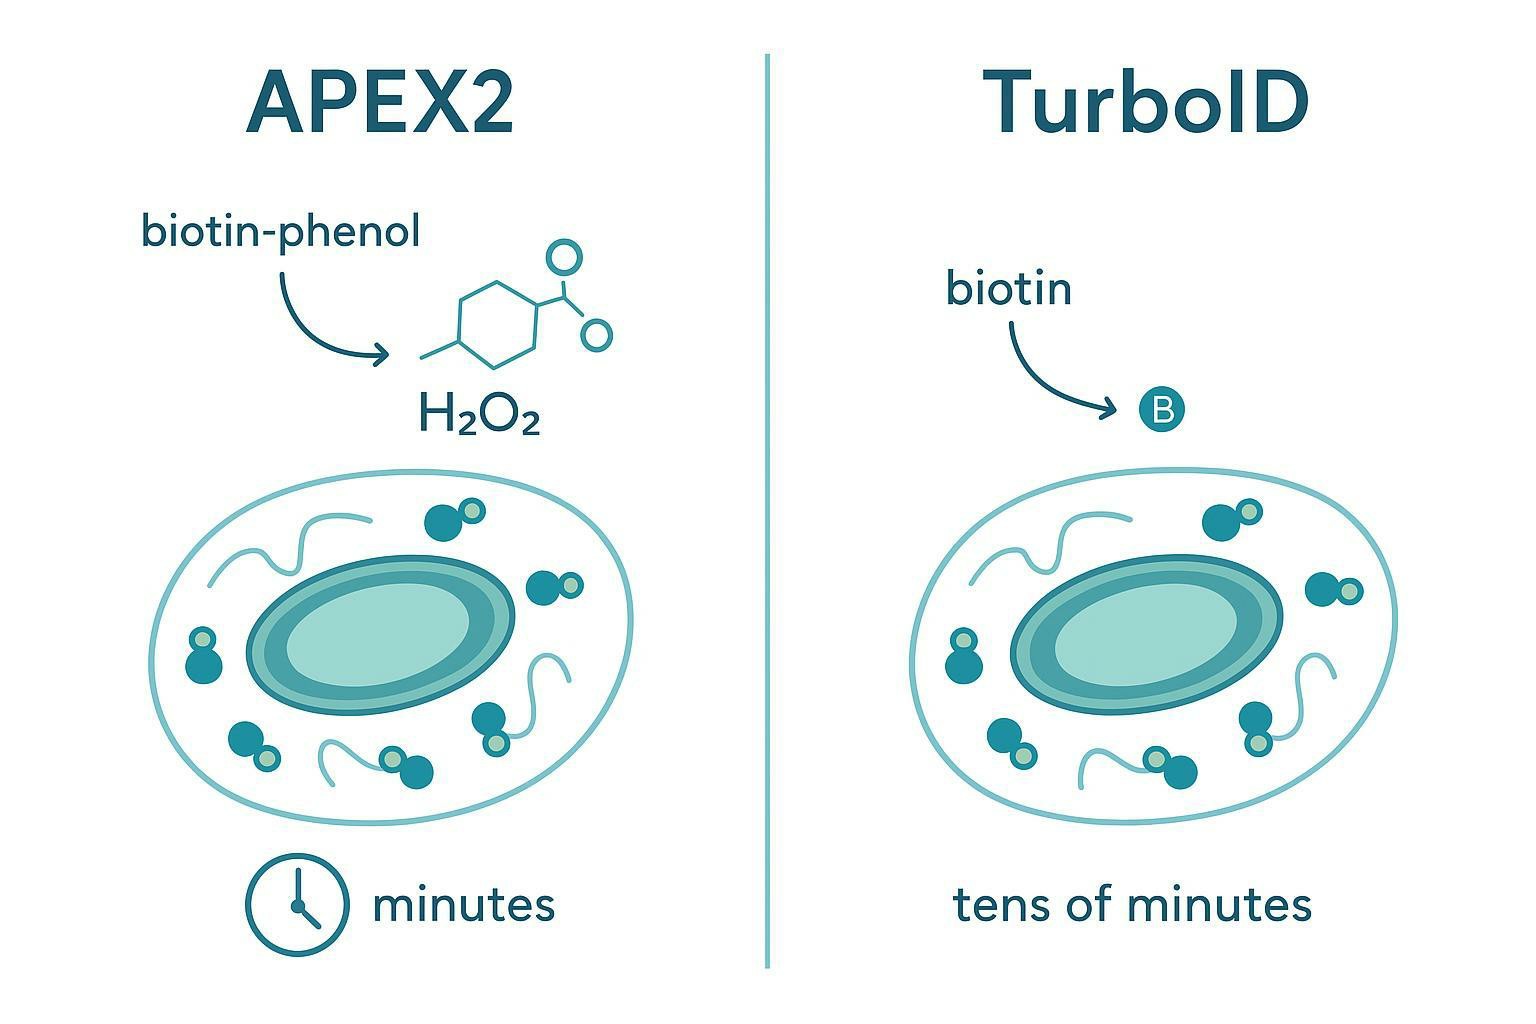
Peroxidase-based systems (APEX2)
APEX2 is an engineered peroxidase that generates short-lived radicals to label nearby proteins upon a brief H2O2 activation step. The reason people use it is simple: time resolution.
- Labeling can occur on the order of a minute.
- It's well suited for fast translocation and signaling events.
- The cost is experimental tightness: H2O2 exposure must be optimized to avoid stress artifacts.
Biotin ligase-based systems (TurboID)
TurboID is an engineered biotin ligase that labels nearby proteins during biotin incubation windows. Compared with APEX2, it typically trades temporal sharpness for operational simplicity.
- Labeling is commonly performed over minutes to tens of minutes.
- It does not require peroxide activation.
- Background and constitutive activity need to be managed by expression level and timing.
Compartment-Targeted Activity-Based Protein Profiling (ABPP)
Spatial questions are not only "where is the protein?" They're often "where is the active protein?" That distinction matters most for enzymes whose abundance is decoupled from activity (e.g., kinases, hydrolases, proteases).
Activity-based protein profiling (ABPP) addresses this by using reactive probes that covalently label enzymes in their active state, enabling enrichment and MS readout.
Compartment targeting can be implemented by combining organelle localization strategies with activity-based probes so you can measure activation shifts within restricted subcellular domains after perturbation (for example, assessing whether a hydrolase family is selectively activated in lysosomal vs cytosolic compartments under drug pressure).
If membrane proteins and hydrophobic enzymes are central to your functional readout, membrane-focused sample workflows become the gating step. Plasma membrane proteomics services is often the relevant internal capability when the biology lives at the interface.
Dynamic Relocalization: Tracking Spatial Translocation Under Perturbation
Static maps answer "where is it usually?" Mechanism studies often need "where did it go after perturbation?"
Dynamic organellar mapping compares spatial proteome profiles across conditions (control vs treated, infected vs uninfected, stressed vs baseline) to identify coordinated relocalization.
Advanced Differential Localization with pRoloc and BANDLE
Once you move to two-condition comparisons, you need statistics that separate real spatial shifts from variance.
pRoloc for baseline spatial assignment and exploration
pRoloc provides an analysis infrastructure for MS-based spatial proteomics: visualization, marker-based classification, and tooling to reason about uncertainty and outliers.
The core reference is Mass-spectrometry-based spatial proteomics data analysis using pRoloc and pRolocdata.
BANDLE for probabilistic differential localization
BANDLE is purpose-built for differential localization. Instead of only assigning a compartment label per condition, it estimates the probability that a protein has differentially localized between conditions.
This matters for perturbation biology because you don't want a binary label change that is driven by noise. You want an uncertainty-aware probability estimate you can rank and validate.
Primary reference: Inferring differential subcellular localisation in comparative spatial proteomics using BANDLE.
Advanced Instrumentation Foundations for Spatial Depth
Spatial proteomics is an instrumentation problem as much as it is a biology problem. You are often asking a mass spectrometer to do at least one of these hard things:
- quantify across many channels with minimal interference,
- identify low-abundance signaling proteins,
- recover hydrophobic transmembrane proteins,
- or profile low-input samples without losing depth.
A useful way to think about it is to match instrument architecture to quantitation strategy.
Orbitrap tribrid architectures for complex SPS-MS3 multiplexing
Orbitrap tribrid platforms are a natural fit when your experiment is built around isobaric multiplexing and you need the quantitation to be stable enough to preserve organelle profile shapes.
SPS-MS3 improves quantitative accuracy, but it adds scan complexity and can reduce throughput. That tradeoff is frequently acceptable in profile-based fractionation workflows where a clean spatial map is more valuable than maximal IDs.
timsTOF PASEF (Parallel Accumulation Serial Fragmentation) systems for high-throughput label-free fraction profiling
timsTOF PASEF combines ion mobility separation (TIMS) with fast sequencing (PASEF), making it well suited for high-throughput label-free workflows and, in many settings, low-input profiling.
A key conceptual point is that orthogonal separation (ion mobility) can help reduce interference in complex samples. For a peer-reviewed example showing TIMS/Q-TOF improving isobaric tag quantification and interference behavior, see Extending the Separation Space with Trapped Ion Mobility Spectrometry Improves the Accuracy of Isobaric Tag-Based Quantitation in Proteomic LC/MS/MS.
A practical decision table: what the instrument choice changes
| Decision point | Orbitrap tribrid + SPS-MS3 (TMT) | timsTOF PASEF (label-free / low-input) |
|---|---|---|
| Best when your priority is | Quantitative fidelity across multiplexed channels | Throughput and rapid sampling; strong IDs at speed |
| Typical spatial strategy fit | HyperLOPIT / fractionation maps with many fractions | Label-free fraction profiling; screening-style designs |
| Interference control | Explicitly reduced via MS3-based quantification | Reduced via ion mobility + acquisition speed (method-dependent) |
| Main tradeoff | Slower duty cycle per peptide | Quantitation across many fractions relies on run-to-run stability |
Building a Defensible Spatial Proteomics Workflow
Successful spatial proteomics projects require alignment of (1) robust biochemical isolation and fraction design, (2) quantitative MS acquisition tuned to the mapping strategy (SPS-MS3 or high-throughput PASEF), and (3) computational modeling capable of expressing uncertainty (pRoloc/BANDLE) rather than forcing overconfident assignments.
Creative Proteomics supports organelle enrichment workflows and targeted subcellular proteomics services—including mitochondrial and membrane-focused approaches—to help translate compartment complexity into mechanistic insights.
Frequently Asked Questions
How do I decide between HyperLOPIT and Proximity Labeling for my localization project?
HyperLOPIT is best when you need an unbiased, proteome-wide organelle map in native samples without genetic engineering. Proximity labeling is best when you need the local neighborhood of a specific bait, sub-organelle region, or transient complex that fractionation is likely to disrupt.
What is the difference between pRoloc and BANDLE in spatial proteomics data analysis?
pRoloc helps you build and interrogate a baseline spatial proteomics map (including marker-based classification and visualization). BANDLE is designed for differential localization, estimating the probability that a protein truly changes compartment association between conditions.
Why is TMT SPS-MS3 preferred over standard MS2 for fractionation-based spatial proteomics?
Fractionation-based spatial proteomics depends on subtle differences in abundance profiles across adjacent fractions. MS2-level interference can compress ratios and blur those profile shapes, which reduces organelle cluster separation. SPS-MS3 reduces co-isolation interference, improving quantitative fidelity for organelle mapping.
How many fractions do I need for MS-based organelle proteome mapping?
You need enough fractions to capture distinct profile shapes for your organelles of interest; too few fractions forces different compartments to look artificially similar. In practice, teams often pilot a smaller fraction set to evaluate separation before committing to a full-resolution design.
How do I validate MS-based subcellular localization results?
Use orthogonal validation for a small set of high-impact candidates: targeted immunoblotting across fractions, microscopy for gross compartment shifts, or targeted proteomics assays. The goal is to validate the direction and compartment of the shift, not to re-measure the entire map.
What are common failure modes in spatial proteomics experiments?
The most common issues are ratio compression or interference in multiplexed quantitation, incomplete separation between biochemically similar organelles (e.g., ER/Golgi), and marker sets that don't match the biology of your system. Planning marker proteins and QC checks before acquisition reduces rework later.
What is the difference between APEX2 and TurboID?
APEX2 provides very fast labeling after a short activation pulse, making it suited for rapid dynamics. TurboID labels over longer incubation windows without peroxide, often making it easier to deploy in living systems where oxidative stress could confound results.
Can spatial proteomics detect protein relocalization after drug treatment or infection?
Yes. Comparative designs can detect coordinated spatial shifts across conditions, especially when paired with differential localization statistics that model uncertainty. The strongest studies pair computational calls with a targeted validation set.
Do I need machine learning to analyze spatial proteomics data?
If your goal is organelle-resolved assignment at proteome scale, supervised learning anchored to marker proteins is the standard approach. It helps separate overlapping fraction profiles and provides confidence scores, which is essential when biology and biochemistry don't separate cleanly.
References
- Global, quantitative and dynamic mapping of protein subcellular localization. eLife. 2016.
- Mass-spectrometry-based spatial proteomics data analysis using pRoloc and pRolocdata. Bioinformatics. 2014.
- Inferring differential subcellular localisation in comparative spatial proteomics using BANDLE. Nature Communications. 2022.
- Directed evolution of APEX2 for electron microscopy and proximity labeling. Nature Methods. 2015.
- Efficient proximity labeling in living cells and organisms with TurboID. Nature Biotechnology. 2018.
- Activity-based protein profiling: from enzyme chemistry to proteomic chemistry. Annual Review of Biochemistry. 2008.
- Measuring and managing ratio compression for accurate iTRAQ/TMT protein quantitation. J Proteome Res. 2013.
- Benchmarking the Orbitrap Tribrid Eclipse for Next Generation Multiplexed Proteomics. Analytical Chemistry. 2020.
- Extending the Separation Space with Trapped Ion Mobility Spectrometry Improves the Accuracy of Isobaric Tag-Based Quantitation in Proteomic LC/MS/MS. Analytical Chemistry. 2020.
* For Research Use Only. Not for use in diagnostic procedures.