
Why use size exclusion chromatography (SEC) for EV isolation
Extracellular vesicles (EVs), including small EVs often referred to as exosomes, carry proteins, lipids, and nucleic acids that reflect cell state and disease biology. That makes them attractive inputs for proteomics, lipidomics, and functional assays, but only if the isolation method preserves vesicle integrity and keeps non-EV background low.
Size exclusion chromatography (SEC) is widely used for EV isolation because it is gentle and chemistry-free. In practice, SEC separates particles by hydrodynamic size: vesicles elute early while many soluble proteins and small molecules elute later. For downstream assays, that “cleaner background” often matters more than raw particle count.
Compared with differential ultracentrifugation workflows, SEC typically applies less mechanical stress, reduces co-pelleting of soluble proteins, and produces fractions that are easier to interpret when you validate them properly. Compared with polymer precipitation, SEC avoids polymer carryover and tends to reduce co-isolated proteins that can confound mass spectrometry and bioactivity readouts.
Who benefits most from SEC/qEV exosome purification approaches? Teams preparing EVs for high-sensitivity downstream readouts where contaminants are expensive:
- EV isolation for proteomics and lipidomics, where abundant proteins or lipoproteins can dominate the signal
- Functional assays where protein aggregates, cytokines, or residual reagents can produce false positives
- Translational groups that need reproducible, reviewable reporting aligned with community standards
If you plan to outsource part of the pipeline, it also helps to keep isolation and downstream goals aligned from the start (for example, pairing purification with Exosome Isolation and Purification Service and a downstream readout-specific analysis plan).
Principles of SEC/qEV for EV purification
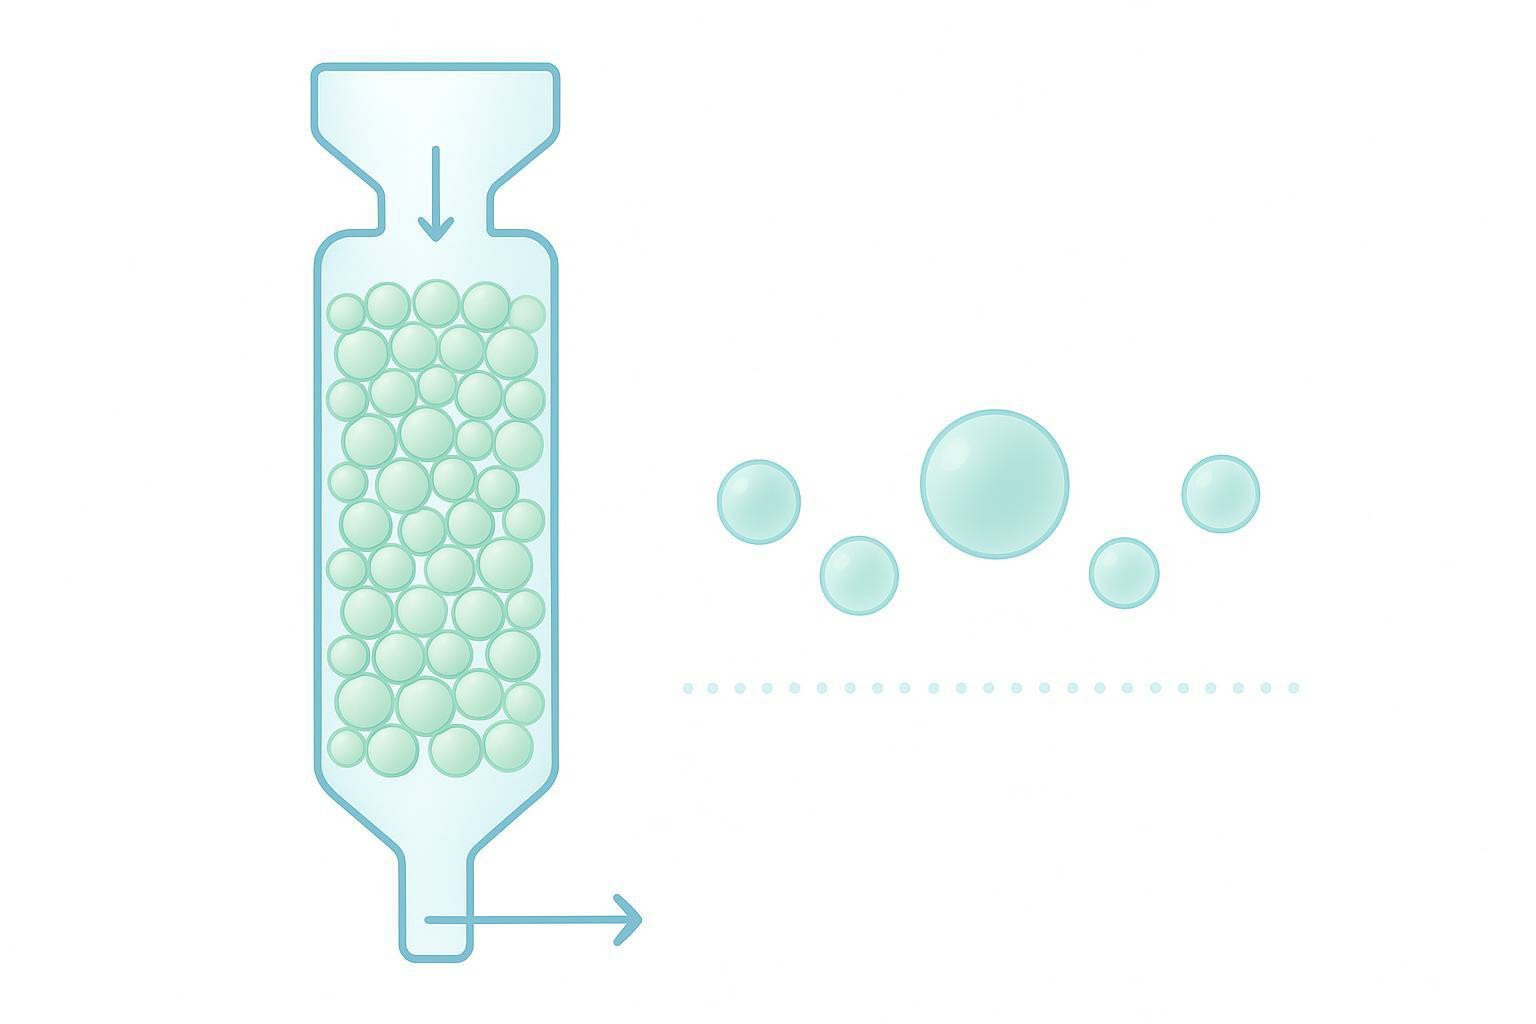
Mechanism: separation based on particle size exclusion from porous resin matrix
SEC columns are packed with porous beads (often agarose-based). Large particles cannot enter the pores and travel a shorter path, so they elute earlier. Smaller proteins and solutes explore more pore volume and elute later.
For EV purification, the practical implication is simple but easy to misuse:
- Early fractions are enriched for vesicles and other large nanoparticles.
- Later fractions are enriched for soluble protein and other small contaminants.
Plasma and serum introduce a specific complication: some lipoproteins overlap in size with EVs, so “early fraction = pure EVs” is not always true. SEC improves purity, but it does not remove every same-size co-isolate. That’s why SEC fractions for exosomes should be selected using orthogonal QC, not intuition.
Key physics: centrifugal force (RCF vs RPM) and calculation methods
Even in SEC-centered workflows, centrifugation steps show up repeatedly (pre-clears, concentration, and sometimes pre-enrichment). Getting the physics right improves reproducibility across labs.
- RPM is the rotational speed.
- RCF (relative centrifugal force, ×g) is what the sample actually experiences.
RCF depends on rotor radius, so the same RPM on two instruments can produce different g-forces. The standard conversion is:
RCF = 1.118 × 10⁻⁵ × r (cm) × (RPM)²
Where r is the rotational radius in centimeters. For protocol reporting, RCF is the more transferable parameter.
Comparison: difference between differential ultracentrifugation and density gradient ultracentrifugation
Both approaches are used to enrich EVs (sometimes before SEC, sometimes as an alternative).
- Differential ultracentrifugation (dUC) separates components by stepwise pelleting at increasing g-force. It is widely used and can process large volumes, but it can co-pellet proteins and other particles and may affect EV integrity depending on conditions.
- Density gradient ultracentrifugation (dgUC) separates particles by buoyant density (for example, in sucrose or iodixanol gradients). It can improve purity relative to dUC, especially for challenging matrices, but it is more complex and lower throughput.
In practice, SEC is often chosen when you need a simpler route to higher-purity EVs for sensitive downstream assays, while dgUC is helpful when density-based separation is specifically required to reduce co-isolates.
SEC/qEV workflow and practical considerations
Sample pre-treatment: removal of debris and larger particles
The goal of pre-treatment is to protect the column, reduce clogging, and avoid dragging large particles into EV-enriched fractions.
Typical pre-treatment logic (adapt to sample type):
- Low-speed spins to remove cells and debris
- Medium-speed clarification to reduce larger vesicles/aggregates
- Filtration when appropriate for your application (recognizing filters can reduce recovery)
For conditioned media, the most common failure mode is not “SEC didn’t work.” It’s that the input wasn’t clarified enough, and the column becomes a high-protein trap.
Step-by-step differential ultracentrifugation procedure: optimizing time, g-force, and rotor type
Even if SEC is the primary purification step, dUC often appears upstream (pre-enrichment) or downstream (concentration). The details below are framed as optimization principles rather than a single universal recipe.
Key variables that affect EV recovery and downstream compatibility:
- g-force and time: higher g and longer time increase pelleting but also increase co-pelleting risk and can increase aggregation.
- Rotor type (fixed-angle vs swinging-bucket): affects pellet geometry and resuspension behavior.
- Temperature control: helps preserve EV integrity and reduces protease activity.
A useful way to make this actionable is to report your parameters and acceptance criteria as a compact table.
| Step purpose | Parameter to report | Why it matters for SEC + downstream assays | Practical “done right” signal |
|---|---|---|---|
| Pre-clear | RCF, time, temperature, rotor | Prevents clogging and reduces carryover of large debris | Supernatant is visibly clearer, fewer aggregates |
| Concentration (optional) | Method (UC/UF/TFF), membrane cutoff if UF | Can bias particle populations and change contaminant profile | EV fraction concentrates without foaming/precipitation |
| Wash (optional) | Buffer and number of washes | Reduces soluble background before SEC or before assays | Lower protein in control fractions |
Loading volume and equilibration: recommended loads, overloading signatures, and flushing practices
SEC performance is highly sensitive to loading volume and column equilibration.
Loading volume
- Under-loading wastes capacity and may produce low signal in downstream assays.
- Over-loading compresses separation: EV fractions become “dirty,” and later protein peaks bleed forward.
Overloading signatures you can actually observe:
- EV markers and soluble proteins appear in the same early fractions.
- Protein-rich fractions elute earlier than expected.
- NTA shows higher particle counts but your marker panel suggests weaker EV enrichment.
Equilibration and flushing
- Equilibrate the column with the same buffer used for elution.
- Use filtered buffers to minimize particulate introduction.
- Flush and store columns as recommended by the manufacturer; inconsistent column conditioning is a common driver of between-run variability.
Optimization tips for key parameters: g-force, centrifugation time, rotor selection, temperature control
For assay-driven workflows, optimization should start from what will break your readout.
- Proteomics: prioritize reduction of abundant soluble proteins and immunoglobulins; avoid detergents and reagents that interfere with LC–MS.
- Lipidomics/metabolomics: minimize lipoprotein carryover and plasticizer contamination; standardize storage materials.
- Functional assays: keep conditions gentle; avoid introducing polymers or harsh buffers that can trigger non-specific cellular responses.
A practical approach is to lock a small QC panel (one EV-enriched marker and one contaminant marker) and use it to justify fraction selection.
Troubleshooting: preventing column clogging, low recovery, and contamination
| Symptom | Most likely cause | What to change first |
|---|---|---|
| Column runs slow or stops | Inadequate pre-clear; particulate load; viscous input | Increase clarification; consider gentle filtration; reduce viscosity |
| Low EV signal in early fractions | Under-loading; EV loss during pre-treatment; overly aggressive filtration | Increase input within capacity; reduce harsh pre-steps; check concentration method |
| High protein background in EV fractions | Overloading; column not equilibrated; fraction window too wide | Reduce load; re-equilibrate; narrow EV fraction window |
| Lipoprotein carryover (plasma/serum) | Size overlap; fraction window too early/too broad | Tighten fraction selection; add orthogonal validation |
SEC/qEV vs other EV isolation methods
| Method | Pros | Cons | Best for |
|---|---|---|---|
| SEC | High purity, gentle, no chemicals | Lower yield, dilution, fraction handling burden | Plasma, serum, cell culture media |
| Ultracentrifugation | High yield, established method | Harsh on EVs, expensive, complex | Large sample volumes, research-focused |
| PEG precipitation | Quick, low-cost | Contamination risks, less purity | High throughput screening |
| TFF | Scalable, high-throughput | High cost, complex setup | Large-volume, clinical-grade samples |
For downstream omics, a recurring mistake is assuming that “more particles” means “more biology.” If the background overwhelms the dynamic range of your assay, higher yield can produce a less interpretable result. SEC/qEV EV purification often trades some yield for a cleaner input.
Optimisation tips: sample types and column selection
Blood-derived samples (plasma/serum): addressing lipoprotein contamination
Plasma and serum are high-value matrices for biomarker discovery, and also the hardest place to claim purity without evidence.
What tends to hold up under review:
- Treat lipoproteins as expected co-isolates, not an edge case.
- Use fraction-window discipline: narrower EV fraction windows can improve purity; broader windows can improve recovery but increase carryover.
- Validate with at least one EV-enriched marker and at least one contaminant marker (a MISEV-style logic, without overcomplicating it).
This matters for compatibility because lipoproteins can distort:
- particle sizing/counting (scatter-based NTA)
- proteomics dynamic range (abundant apolipoproteins)
- lipidomics interpretation (lipoprotein lipids are not EV lipids)
A practical way to document this risk is to state upfront whether your main goal is “highest purity EVs for omics” or “highest recovery EVs for screening,” then show how your fraction window supports that goal.
Cell culture conditioned media: clarification and load volume tips
Conditioned media often fails SEC because of avoidable upstream issues.
- Clarify thoroughly before loading.
- If you need to process large volumes, consider pre-concentration (UF or TFF) before SEC, then use SEC as the final “polish” step.
- Track dilution factors so you can normalize downstream assays to the same starting volume.
Urine and other body fluids: dealing with dilute samples
Urine and other dilute biofluids often require concentration to reach meaningful EV levels.
- Standardize concentration approach and report it (membrane cutoff, recovery checks, and buffer).
- Monitor whether concentration shifts your particle population (it can).
Column selection
Pore size trade-offs: 35 nm vs. 70 nm columns—balancing purity vs. recovery
Pore size changes what your column considers “excluded,” and that changes the purity/recovery trade-off.
- Smaller pore size (e.g., ~35 nm class) often supports stricter separation from smaller contaminants, but may reduce recovery depending on matrix and fraction window.
- Larger pore size (e.g., ~70 nm class) can improve recovery for some EV populations and simplify processing, but may increase overlap with same-size non-EV particles in complex biofluids.
A pragmatic selection framework is to choose based on your downstream failure mode.
| If your main risk is… | Bias toward | Why |
|---|---|---|
| Lipoprotein contamination in plasma EV isolation | Smaller pore size + narrower fraction window | Improves interpretability when lipoproteins overlap in size |
| Underpowered LC–MS due to low recovery | Larger pore size or higher-capacity format | Increases EV mass available for proteomics workflows |
| Functional assays sensitive to buffer/reagents | SEC (either pore size) with gentle handling | Keeps chemistry minimal and supports bioactivity readouts |
Tips for selecting qEV column type and capacity
- Match column capacity to your input volume and expected EV abundance.
- Plan fraction collection so you can test a narrow window first, then broaden only if contaminant markers remain acceptable.
- Treat fraction selection as a documented decision, not a habit.
When you need an end-to-end plan that supports downstream assays, it can help to align purification with the downstream readout early, for example linking purification to Extracellular vesicle protein identification and quantification and Exosomes Metabolomics Service.
Downstream compatibility and EV validation metrics
| Validation method | What it measures | Benefits | Common issues |
|---|---|---|---|
| NTA (Nanoparticle Tracking Analysis) | Size, concentration of EVs | Non-invasive, fast | Size bias, swarming, sensitive to co-isolates |
| TEM (Transmission Electron Microscopy) | EV structure, morphology | High resolution, visual proof | Equipment access, prep artifacts |
| Western blot | EV marker proteins | Reliable, widely used | Marker specificity limits; needs enough material |
Downstream compatibility depends on two questions: “Are these vesicles?” and “Is the background low enough for my assay?” The second question is where SEC fraction selection and reporting make or break interpretability.
A minimal, defensible validation set for SEC fractions often includes:
- Particle sizing/counting (e.g., NTA) with documented dilution
- Imaging (e.g., TEM) for morphology confirmation
- A protein marker panel that includes EV-enriched markers and at least one contaminant marker
If your work is headed to publication or cross-site transfer, align reporting to community standards such as MISEV (including transparent isolation details and a rationale for fraction pooling).
Pro Tip: For downstream proteomics, treat your extracellular vesicle purification workflow like a sample complexity problem. SEC reduces soluble protein, but fraction-window discipline and contaminant-marker checks are what keep apolipoproteins and immunoglobulins from dominating LC–MS signal.
Common challenges and how to troubleshoot
Column clogging: causes and solutions
Most clogging problems are input problems.
- Increase clarification steps before SEC.
- Filter buffers and avoid introducing particulates.
- Reduce viscosity (for example, by diluting high-protein inputs) if the column format supports it.
Low recovery: sample load, fraction selection, and column saturation issues
Low recovery usually traces to one of three issues:
- EV loss upstream (overly aggressive filtration or harsh handling)
- load too low for the column format
- fraction window too narrow for the EV population you care about
A controlled way to diagnose it is to test two fraction windows in parallel (narrow vs slightly broader) and compare EV markers, contaminant markers, and one downstream readout.
Contaminants: preventing co-precipitation
SEC avoids polymer carryover, but co-isolates remain possible.
- For plasma/serum, monitor lipoprotein-associated markers to understand carryover.
- For conditioned media, watch for protein aggregates and serum-derived contaminants (if serum-containing culture).
Practical workflow and reporting
Sample pre-clearing and buffer considerations
Reporting is not paperwork. It is what makes your EV data comparable across batches and labs.
At minimum, report:
- biofluid or media type, starting volume, and handling conditions
- pre-clear steps (RCF, time, temperature, rotor)
- SEC column format and buffer
- loading volume and fraction size
- pooled fractions labeled as “EV fraction,” with a short QC rationale
Concentration and storage: methods for preserving EV integrity
For downstream assays, concentration and storage can change the biology.
- Prefer gentle concentration methods compatible with your readout.
- Avoid repeated freeze–thaw cycles when possible.
- Document storage buffer and handling so functional assay results remain interpretable.
Troubleshooting common artifacts: clogged columns, contamination, and purity loss
A reporting-friendly way to document artifacts is to link each artifact to an observable cue and a corrective action.
| Artifact | What you observe | Likely cause | Corrective action to document |
|---|---|---|---|
| Clogging | Slower flow, uneven fractions | Particulate input | Add clarification; filter buffers |
| Purity loss | Protein rises in early fractions | Overloading or poor equilibration | Reduce load; re-equilibrate |
| Inconsistent fractions | Marker peak shifts | Column variability or handling | Standardize equilibration; track run history |
Conclusion: optimizing SEC/qEV EV purification and reporting best practices
SEC is a strong option when your downstream readout punishes contaminants more than it rewards raw yield. Teams that get consistent results treat SEC/qEV as a system: input preparation, controlled loading, disciplined fraction selection, and validation tied to the downstream assay.
Key practices that improve reproducibility:
- Choose column pore size and format based on your failure mode (purity vs recovery, and matrix-driven co-isolates).
- Standardize pre-clearing and report RCF (not just RPM).
- Treat fraction selection as a QC-supported decision.
- Validate both EV-enriched and contaminant markers and normalize results to starting volume.
Actionable steps for better downstream compatibility:
- For proteomics and PTM studies, prioritize low soluble protein background and document contaminant-marker checks.
- For lipidomics/metabolomics, assume lipoprotein overlap in plasma/serum and narrow fraction windows before you widen them.
- For functional assays, keep chemistry minimal and track storage/handling as part of the experiment.
Reporting checklist (MISEV-aligned):
- Starting material (matrix, volume, collection/handling)
- Pre-clear steps (RCF, time, temperature, rotor)
- SEC details (resin, column format, equilibration buffer, load volume)
- Fractionation (fraction size/number, pooled fraction IDs)
- EV characterization (particle sizing/counting, imaging, marker panel including contaminants)
- Functional readouts (controls, normalization, and behavior of non-EV fractions)
FAQs
How do I pick the right SEC fractions for EVs?
Start with a narrow early fraction window and validate it with one particle measurement plus a marker panel, then widen only if contaminant markers stay low. If you can’t defend fraction selection in one paragraph, reviewers and collaborators won’t be able to reproduce it.
Is SEC better than ultracentrifugation for functional assays?
Often, yes, when your assay is sensitive to harsh processing and soluble background. SEC tends to preserve EV integrity and reduces soluble proteins, but you still need to control for same-size co-isolates and fraction dilution.
Does SEC remove lipoproteins from plasma or serum EV preparations?
No. SEC reduces soluble proteins well, but some lipoproteins overlap in size with EVs and can co-elute. If lipoprotein carryover will distort proteomics or lipidomics, tighten your fraction window and track a lipoprotein-associated marker.
What’s the fastest way to confirm I didn’t overload my SEC column?
Check whether your EV-enriched markers and high-abundance soluble proteins begin to overlap in the early fractions. Early “protein bleed” plus a broader particle peak is a practical overload signature.
Is SEC compatible with LC–MS proteomics and PTM workflows?
Yes, but plan for dilution and recovery. SEC can lower soluble protein carryover, which improves interpretability in LC–MS, while a gentle concentration step (chosen for MS compatibility) helps restore input mass.
What validation metrics should I report to make SEC EV data reusable?
Report starting volume, full pre-clear parameters (RCF, time, temperature, rotor), column format and load volume, fraction size and pooled fraction IDs, and at least two orthogonal characterization methods plus a marker panel that includes contaminants.
How should I store SEC-isolated EVs for functional assays?
Use an assay-compatible buffer, minimize agitation, and limit freeze–thaw. Storage conditions can change apparent bioactivity, so document them as part of the experiment.
References
- Minimal information for studies of extracellular vesicles 2018 (MISEV2018)
- Extracellular vesicle isolation methods: rising impact of size exclusion chromatography
- Comparison of an Optimized Ultracentrifugation Method versus Size Exclusion Chromatography
- Technical challenges of working with extracellular vesicles
- Defining the influence of size-exclusion chromatography fraction window and ultrafiltration column choice on extracellular vesicle recovery
* For Research Use Only. Not for use in diagnostic procedures.