
Plasma is one of the most information-rich—and methodologically unforgiving—matrices for extracellular vesicle (EV) studies. The same features that make plasma attractive for biomarker discovery (high complexity, systemic coverage, clinical relevance) also make EV purification difficult: lipoproteins are extraordinarily abundant and can look "EV-like" by multiple readouts.
If your downstream workflow depends on clean EV proteomics, EV lipidomics, or mechanistic functional assays, lipoprotein carryover is not a minor impurity. It can become the experiment.
Below is a practical, lab-facing guide to understanding why the problem persists, how to detect it with orthogonal QC, and how to choose purification depth that matches your application—without overstating purity.
Why Lipoprotein Contamination Is a Major Problem in Plasma EV Isolation
Why plasma is especially challenging for extracellular vesicle (EV) purification
Plasma contains multiple particle classes spanning a wide dynamic range: EVs, protein complexes, and several lipoprotein subclasses (HDL, LDL, VLDL, and chylomicrons). In this environment, "EV enrichment" usually means shifting relative composition—not isolating a single, clean particle type.
Two factors make plasma uniquely difficult:
- Particle abundance imbalance. Lipoproteins outnumber EVs by orders of magnitude in many settings. Even a small percentage of lipoprotein carryover can dominate what you measure.
- Physical-property overlap. Lipoproteins and EVs overlap in the same properties most workflows use to separate particles—size, density, and biochemical composition—so a single separation axis rarely resolves them.
This co-isolation challenge is not speculative; it's highlighted across methodological papers and EV field discussions that ask a blunt question: are we looking at EVs, lipoproteins, or a mixture that behaves like both?
How HDL, LDL, and VLDL overlap with EVs in size, density, and biochemical composition
The isolation problem becomes clearer when you map lipoprotein subclasses onto common EV isolation axes:
- Size: EVs span roughly ~30–1000 nm (depending on definition and method). HDL is typically smaller than EVs, but VLDL and chylomicrons can overlap EV sizes, which matters for size-based methods.
- Density: EV buoyant densities overlap the HDL density range substantially, so density-based separation cannot "remove HDL" without also risking loss of EV subpopulations.
- Composition: Both EVs and lipoproteins are lipid-rich particles with associated proteins. Lipoproteins carry apolipoproteins (e.g., ApoA1, ApoB-100, ApoE), while EVs carry membrane proteins and cytosolic proteins. In mixed preparations, protein and lipid readouts can be hard to attribute cleanly.
An experimental illustration of this overlap (and co-isolation) is described in Co-isolation of extracellular vesicles and high-density lipoproteins (2014), which explicitly addresses how HDL and EVs can be recovered together in density-based workflows.
Why lipoprotein carryover is a persistent issue across common plasma EV workflows
Lipoprotein carryover persists because common workflows optimize for different constraints:
- Speed and throughput (often at the expense of purity)
- Recovery from small volumes (which can force compromises on cleanup)
- Compatibility with downstream assays (e.g., intact vesicles, low detergent exposure)
Even when a method "works" on one axis, overlap on another axis can reintroduce contamination. Acoustofluidic separation research underscores that EV–lipoprotein separation is fundamentally limited by overlapping physical properties rather than a single easy-to-fix parameter; see Separating extracellular vesicles and lipoproteins via acoustofluidics (2019).
How Lipoprotein Contamination Distorts Downstream EV Analyses
Purity is not an abstract virtue. Lipoprotein contamination distorts specific downstream readouts in predictable ways.
Proteomics
Masking of low-abundance EV proteins
In LC–MS/MS, abundant apolipoproteins and other plasma-associated proteins can dominate spectral counts and reduce the effective depth for EV-associated proteins. The result is a proteome that looks "plasma-like," not vesicle-enriched.
False enrichment of plasma-associated proteins
If your workflow enriches lipoproteins alongside EVs, you may see apparent enrichment of proteins that are biologically real in plasma but not informative for EV biology.
Reduced confidence in EV-specific protein interpretation
Interpretation becomes fragile when the same preparation shows strong EV markers and strong apolipoproteins. In that scenario, a "hit list" may reflect co-isolation rather than vesicle biology.
If your end goal is EV proteomics, it's often safer to adopt a workflow designed for omics-grade purity (typically multi-step). For service-aligned options, see Exosome Proteomics Services, which is positioned around multi-omics workflows where upstream purification quality directly affects interpretation.
Lipidomics
Inflation of cholesteryl esters and other lipoprotein-associated lipids
Lipoproteins are lipid transport particles. If they co-isolate, they can inflate cholesteryl esters and other lipid classes that are not specific to EV membranes.
Difficulty distinguishing EV membrane lipids from plasma lipoprotein background
EV lipidomics often aims to characterize membrane lipid composition, remodeling, or disease-associated shifts. Lipoprotein carryover makes it difficult to attribute lipid changes to EVs rather than plasma lipid transport biology.
A practical implication: if you observe a lipidomics profile consistent with HDL/LDL patterns, interpret the result as "particle mixture lipidomics" unless impurity markers were quantified and convincingly low.
Functional assays
Residual lipoproteins influencing uptake, signaling, or inflammatory readouts
Functional assays are especially sensitive to contaminants because biological systems respond to what they "see," not what we intended to purify. Lipoproteins can influence uptake and signaling pathways; the risk is strongest when the assay readout is immune or coagulation-adjacent.
A recent example of how lipoprotein depletion changes functional interpretation is discussed in Density-based lipoprotein depletion improves extracellular vesicle thromboinflammatory analysis (2024).
Risk of attributing biological effects to EVs when contaminants contribute to the phenotype
If the preparation contains both EVs and lipoproteins, then the phenotype might be:
- EV-driven
- lipoprotein-driven
- or due to EV–lipoprotein complexes
In that setting, the most defensible claim is not "EVs cause X," but "EV-enriched plasma particles cause X under these purity metrics."
How to Detect Lipoprotein Carryover in Plasma EV Preparations
Detection should be designed as a QC system, not a single "marker check." The goal is to triangulate identity and impurity using orthogonal methods.
Marker panels for EVs and lipoproteins
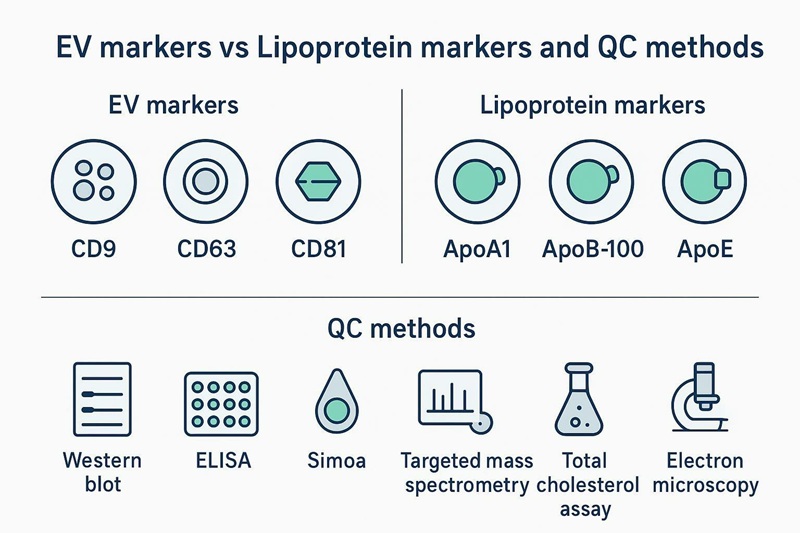
A practical marker approach is to evaluate EV-positive markers alongside impurity markers.
- EV-associated markers: CD9, CD63, CD81 are widely used surface markers for small EVs.
- Lipoprotein-associated markers: ApoA1 (HDL-associated), ApoB-100 (LDL/VLDL-associated), ApoE (often lipoprotein-associated and sometimes EV-associated).
The point is not that any single marker is perfect. The point is that a panel makes it harder for contamination to masquerade as purity.
Analytical methods for contamination assessment
Your assay choice should match how quantitative and scalable you need the QC to be:
- Western blot: useful for presence/absence patterns (CD9/CD63/CD81 vs ApoA1/ApoB), but semi-quantitative.
- ELISA / Simoa: useful when you need quantitative apolipoprotein readouts across many samples or fractions.
- Targeted mass spectrometry: supports multiplexed, quantitative protein panels when you need high specificity.
- Total cholesterol (and related lipid measurements): a fast proxy for lipoprotein carryover; interpret carefully because EV membranes also contain cholesterol.
When the goal is method optimization or fraction selection, quantitative readouts are usually more informative than qualitative checks because they let you compare workflows and tune cutoffs.
Orthogonal particle and membrane-level checks
Marker assays alone can be misleading if particle identity is mixed. Add orthogonal checks that interrogate particles and membranes directly:
- NTA (or imaging NTA): provides particle concentration and size distribution; does not distinguish EVs from lipoproteins.
- Electron microscopy (EM): supports morphology review; useful for spotting lipoprotein-like particles and heterogeneous populations.
- Detergent sensitivity / membrane disruption controls: in some designs, controlled membrane disruption can help test whether the biological effect depends on intact vesicles.
Pro Tip: Treat NTA as a counting tool, not an identity tool. Use it to track recovery across steps, then use marker panels + EM to interpret what those particles likely are.
Which Plasma EV Purification Strategies Reduce Lipoprotein Contamination
No single method is universally best. The most useful question is: which method reduces which lipoprotein subclass enough for your downstream assay?
Density-based approaches
Iodixanol density gradients and fraction targeting
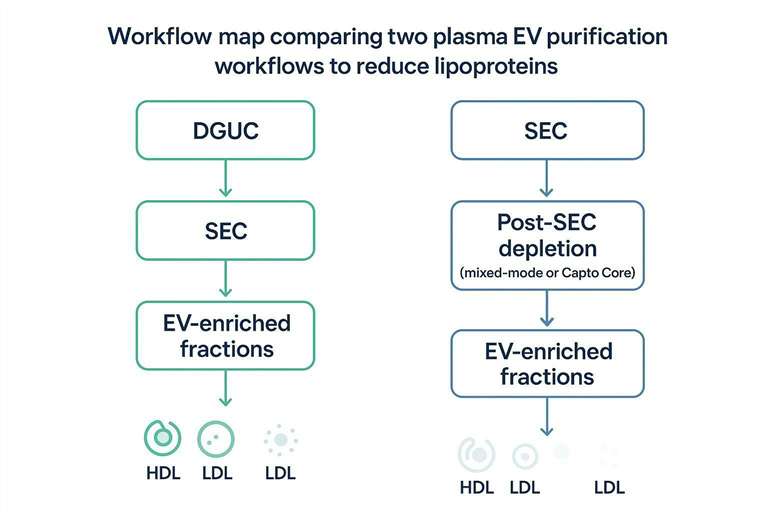
Density gradient ultracentrifugation (DGUC) using iodixanol (or iohexol) separates particles by buoyant density. It can reduce some lipoprotein carryover, especially when you deliberately target EV-enriched fractions and avoid low-density fractions.
A key limitation is that HDL density overlaps EV density, so DGUC cannot simply "remove HDL" without also risking loss of EV recovery.
When density separation is useful for HDL-rich backgrounds
DGUC becomes most valuable when you need to separate out the most buoyant contaminants first and then further refine with a second axis (e.g., SEC). In practice, you often use DGUC to reduce lipoproteins, then use SEC to clean up remaining protein/lipoprotein carryover.
Trade-offs between purity, labor, and recovery
- Higher purity often comes with lower recovery.
- DGUC is labor-intensive and equipment-dependent.
- Fractionation increases opportunities for variability.
If you need a standardized, documented approach for blood-derived EV purification with attention to impurity reduction, a service description like Exosome Isolation and Purification Service can be a relevant internal reference point for how multi-method workflows are commonly structured.
SEC-based approaches
Why size exclusion chromatography helps but does not fully eliminate lipoproteins
SEC separates by hydrodynamic size and is widely used to reduce soluble protein contamination. However, SEC does not guarantee lipoprotein removal because:
- VLDL/chylomicrons can overlap EV size and co-elute.
- LDL can partially overlap EV sizes depending on column and fraction windows.
- HDL is smaller and can be delayed, but "tailing" and complex formation can still cause carryover.
This "helps but does not fully solve it" theme is central to many method comparisons; see A comparison of methods for EV isolation and separation (2020).
Resin choice and early-fraction collection windows
SEC performance depends on resin pore size, column geometry, and how you define "EV fractions." Small changes in fraction windows can swing your purity-versus-recovery balance.
How fraction selection changes purity versus recovery
Practically:
- Earlier fractions can be more EV-enriched but may still contain large lipoproteins.
- Later fractions can reduce large particles but risk increasing soluble protein background.
The most defensible approach is to set fraction windows based on measured ApoA1/ApoB and EV-marker signal across fractions—then report that window selection logic.
Post-SEC cleanup and hybrid workflows
Mixed-mode and cation-exchange approaches
Post-SEC cleanup can reduce residual apolipoproteins and other co-eluting components by adding an orthogonal interaction step (charge, hydrophobicity, or mixed-mode binding).
Capto Core or similar post-SEC depletion strategies
These approaches can be useful when SEC fractions still show ApoA1/ApoB signal and your downstream assay is contamination-sensitive (omics and mechanistic biology are typical examples).
When multi-step workflows are justified for high-purity applications
If your readout is highly sensitive (e.g., deep proteomics, membrane lipidomics, subtle functional phenotypes), a multi-step workflow is usually justified—even if it reduces yield—because interpretability is the limiting factor.
How to Choose a Workflow by Application and Practical Constraints
You can make the workflow decision more reproducible by explicitly matching the purification depth to the downstream application.
Purity-first workflows for proteomics and lipidomics
Proteomics and lipidomics are purity-amplifiers: whatever contaminant is present gets measured and can dominate interpretation. That's why multi-step purification is common in omics-grade plasma EV workflows.
A practical decision rule:
- If your proteomics goal is low-abundance EV cargo or differential protein signatures, use a workflow designed to reduce lipoprotein and plasma protein background as much as feasible.
- If your lipidomics goal is EV membrane composition, prioritize workflows that reduce lipoproteins because lipoprotein lipid cargo can overwhelm EV membrane lipid signals.
For downstream characterization support and assay selection context, Exosome Analysis Services is a relevant internal resource that aligns with the idea that isolation quality and validation plan should be built together.
Faster workflows for functional assays or limited plasma volume
Functional assays can be time-sensitive and sample-limited. A simplified SEC-based workflow may be acceptable when:
- the effect size is expected to be large,
- you include robust QC for ApoA1/ApoB and EV markers,
- and you interpret results as EV-enriched rather than EV-pure.
The key is that faster workflows increase the burden of validation. If you reduce purification depth, you must increase QC rigor.
Balancing throughput, equipment, and EV recovery
Extra cleanup steps reduce recovery and increase handling variability. You can formalize trade-offs using a simple decision table.
| Downstream use | Tolerance for lipoproteins | Recommended approach | Non-negotiable QC |
|---|---|---|---|
| Discovery proteomics | Low | DGUC + SEC, or SEC + post-SEC depletion | ApoA1/ApoB + CD9/CD63/CD81; EM on representative prep |
| EV lipidomics | Low | Multi-step (DGUC + SEC; consider additional depletion) | ApoA1/ApoB + cholesterol + EV markers |
| Strong-effect functional assay | Medium | SEC with careful fraction window | ApoA1/ApoB quant + EV markers; interpret conservatively |
| Limited volume / high throughput | Medium–High | Simplified SEC with strict reporting | Report what you measured; do not imply purity |
If you want the analysis to directly feed proteomics interpretation, a focused link to Extracellular Vesicles Proteomics Services can be placed where readers are thinking about omics-grade workflows.
Sample Handling Variables That Influence Lipoprotein Contamination
Purification isn't the only determinant of lipoprotein carryover. Pre-analytical variables can shift the starting lipoprotein landscape and change how well a given workflow performs.
Fasting status, anticoagulant choice, and plasma preparation
- Fasting status can change circulating lipoprotein composition and abundance.
- Anticoagulant choice can affect downstream detection and particle behavior.
Effects of platelet depletion and pre-clearing steps
Pre-clearing and platelet depletion reduce large debris and some non-EV particles, but they do not remove lipoproteins. Still, they improve reproducibility and reduce confounding cellular contaminants.
Why pre-analytical consistency matters for cross-study comparability
If pre-analytics vary across cohorts, isolation artifacts can look like biology. Consistent handling plus transparent reporting is often the difference between a publishable EV dataset and one that cannot be reproduced.
How to Interpret Purity Without Overstating It
Purity statements should be tied to measured evidence, not implied by method names.
Why "EV-enriched" does not always mean "lipoprotein-free"
Because EVs and lipoproteins share separation axes, enrichment does not imply exclusivity. It's often more accurate to say "EV-enriched fractions with quantified low ApoB/ApoA1 signals" than "pure EVs."
How to combine EV-positive markers with impurity markers in data interpretation
A robust interpretation pattern is:
- Show EV-positive markers (e.g., CD9/CD63/CD81) in the same figure as ApoA1/ApoB.
- Report quantitative ApoA1/ApoB (or targeted-MS abundance) per fraction.
- Interpret downstream omics/functional results proportional to those impurity metrics.
Practical thresholds and context-dependent judgement for acceptable purity
There is no universal cutoff that guarantees "no lipoproteins." Instead:
- Define what level of ApoA1/ApoB is acceptable for your assay.
- Justify it by showing how your readout changes across fractions with different impurity marker levels.
- Avoid absolute labels unless impurity markers are convincingly low across orthogonal methods.
What to Report for Transparent and Reproducible Plasma EV Studies
Good reporting turns an isolation method into a reproducible workflow.
Minimal reporting elements
Report what readers need to reproduce the result and interpret purity:
- Plasma collection and processing (anticoagulant, centrifugation steps, storage)
- Isolation workflow with critical parameters (rotor type, g-force, gradient media, column type)
- Fraction selection rationale and recovery information
Quantitative purity reporting
Quantitative purity makes cross-study comparison possible.
- EV-to-ApoB or EV-to-ApoA1 ratios (e.g., CD9/ApoB; CD81/ApoA1)
- Particle-to-protein ratio (interpret cautiously in plasma)
- Cholesterol or other lipoprotein-related metrics as supporting evidence
A useful reporting pattern is to show a small table that includes both EV-positive and impurity markers.
| Fraction / prep | EV markers measured | Impurity markers measured | Key interpretation |
|---|---|---|---|
| EV-enriched fraction(s) used | CD9/CD63/CD81 (and/or TSG101/ALIX) | ApoA1, ApoB-100 (± ApoE), cholesterol | "EV-enriched with quantified lipoprotein carryover" |
Figure and table reporting practices
- Present EV markers together with impurity markers in the same figure panel when possible.
- Explain why selected fractions were used (not just "these are EV fractions").
- Make downstream compatibility claims consistent with purity data.
Warning: If ApoA1/ApoB are not reported, readers (and reviewers) cannot judge whether proteomics or lipidomics reflect EV biology or plasma lipoprotein biology.
Best-Practice Takeaways for Reducing Lipoprotein Contamination in Plasma EV Workflows
- Detect contamination with both EV and lipoprotein markers.
- Match purification depth to the downstream application.
- Use multi-step workflows when purity is critical.
- Report purity metrics and workflow details clearly for reproducibility.
FAQs
How do you know if your plasma EV prep is contaminated with HDL or LDL?
Measure lipoprotein markers directly: ApoA1 for HDL-associated particles and ApoB-100 for LDL/VLDL-associated particles, alongside EV-positive markers (CD9/CD63/CD81). If apolipoproteins remain high in the same fractions used for downstream assays, interpret the sample as EV-enriched rather than EV-pure.
Is size exclusion chromatography enough to remove lipoproteins from plasma exosomes?
Not reliably. SEC reduces soluble proteins and can shift HDL/LDL away from EV-rich fractions, but larger lipoproteins (VLDL/chylomicrons) and co-eluting complexes can still overlap with EV fractions. For purity-critical applications, multi-step approaches are commonly used; see A comparison of methods for EV isolation and separation (2020).
Which marker panel is most practical for routine EV purity QC in plasma?
A minimal, practical panel is CD9/CD63/CD81 for EV enrichment plus ApoA1 and ApoB-100 for lipoproteins. If you only run EV-positive markers, you can confirm enrichment but not exclude lipoprotein carryover.
How can iodixanol (or iohexol) density gradients help with lipoprotein depletion?
Density gradients separate particles by buoyant density and can reduce some lipoprotein carryover before a second cleanup step, but HDL overlaps EV density and can co-isolate.
What's the most common mistake when claiming "high-purity" plasma EVs?
Using a method label (e.g., "SEC-isolated EVs") as a purity claim without reporting impurity markers (ApoA1/ApoB) and orthogonal checks (EM or other particle-level validation). If lipoprotein markers are missing, your downstream readout may be dominated by lipoproteins.
How should SEC fractions be chosen to minimize lipoprotein carryover?
Choose fraction windows empirically by measuring CD9/CD63/CD81 and ApoA1/ApoB across fractions, then selecting the window that meets your assay's purity tolerance. Report the fraction-selection rationale instead of using a default window.
Can lipoproteins affect EV functional assays even if EV markers look good?
Yes. Biological systems respond to all particles present, not just EVs, so lipoprotein carryover can contribute to uptake and inflammatory/thromboinflammatory phenotypes.
What should you report to make plasma EV studies reproducible and review-proof?
Report plasma handling (including anticoagulant and pre-clearing), isolation steps with critical parameters, fraction-selection logic, EV-positive markers, and lipoprotein impurity markers with quantitative readouts when possible.
Does ApoE always indicate contamination?
Not always. ApoE can be lipoprotein-associated and may also appear associated with EVs in certain contexts, so it's best interpreted as part of a panel (ApoA1/ApoB plus EV markers) rather than as a single-pass "contaminant flag."
How do you phrase purity claims so they're accurate but still useful?
State what you did and what you measured: "EV-enriched fractions with quantified ApoA1/ApoB levels and EM-confirmed vesicle-like particles," rather than "lipoprotein-free EVs." Tie downstream conclusions to those metrics.
References
- Co-isolation of extracellular vesicles and high-density lipoproteins (2014)
- What Are We Looking At? Extracellular Vesicles, Lipoproteins, or Both? (2017)
- A comparison of methods for the isolation and separation of extracellular vesicles (2020)
- Separating extracellular vesicles and lipoproteins via acoustofluidics (2019)
- Improved isolation of extracellular vesicles by removal of both lipoproteins and free proteins (2023)
- Density-based lipoprotein depletion improves extracellular vesicle thromboinflammatory analysis (2024)
* For Research Use Only. Not for use in diagnostic procedures.