
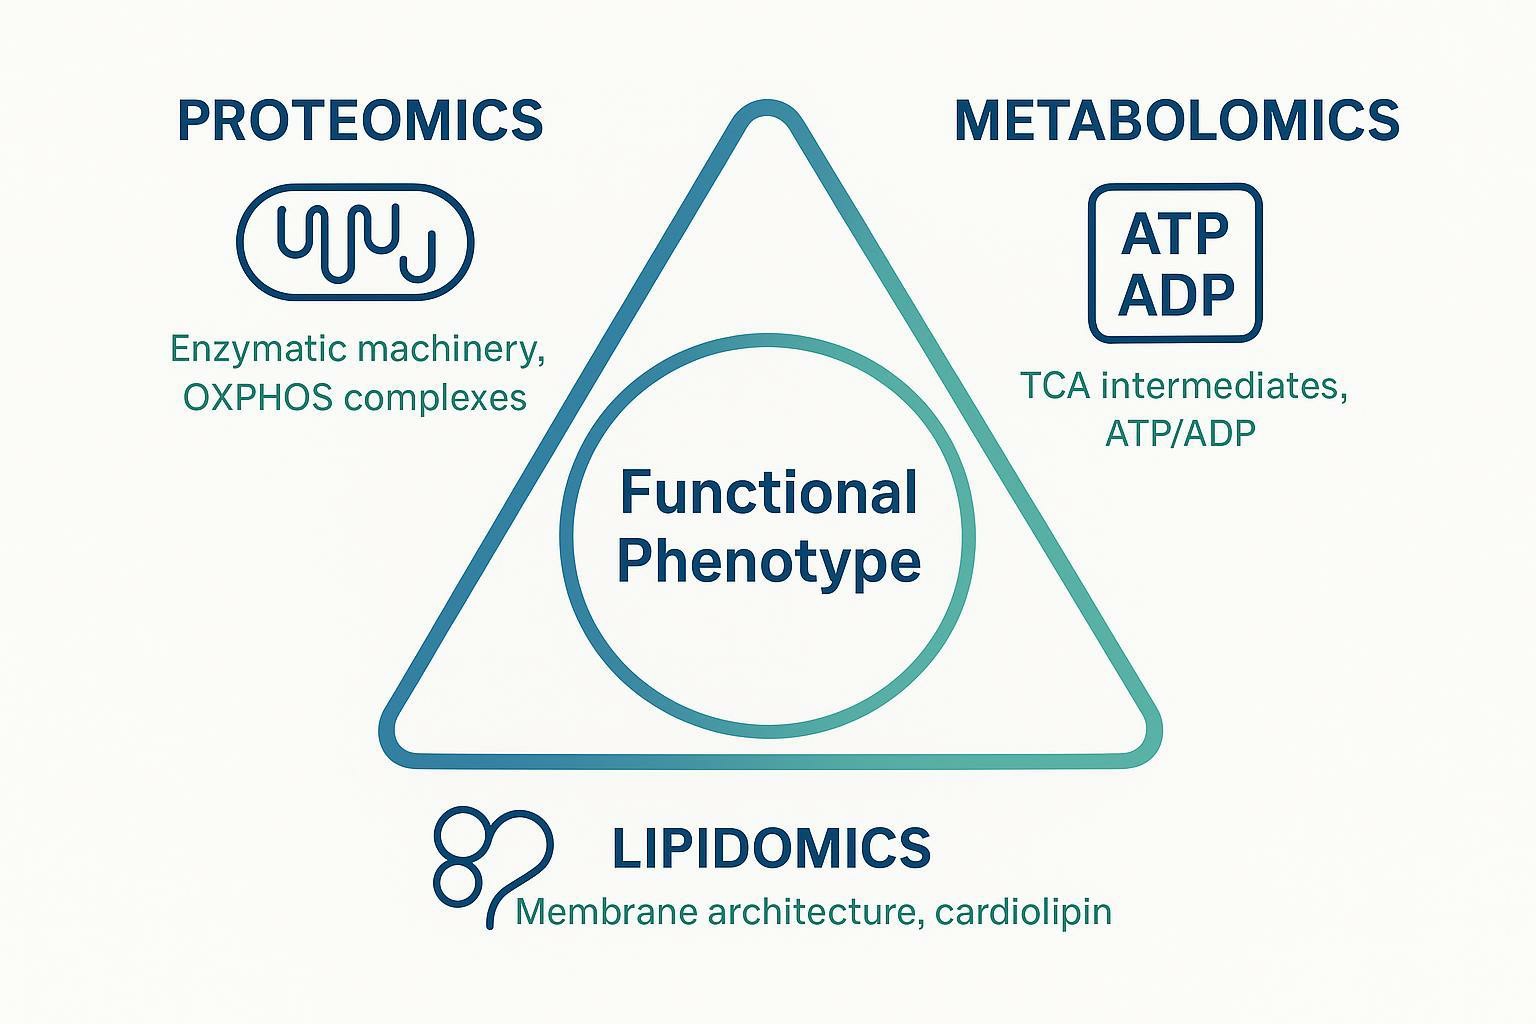
Mitochondria are not a single pathway; they are tightly coupled systems in which enzyme abundance, substrate availability, membrane architecture, and redox balance jointly determine phenotype. This is why mitochondrial multi-omics experimental design is increasingly important for mechanistic studies. Proteomics can define the molecular machinery, metabolomics can capture energetic consequences, and lipidomics can reveal membrane remodeling that affects OXPHOS efficiency and respiratory complex stability.
When designed well, multi-omics is not simply three datasets generated in parallel. It is a coordinated strategy in which each omics layer is chosen to test hypotheses from the others, using matched material, shared perturbation conditions, and pre-planned normalization and integration.
Key Takeaway: The highest-value mitochondrial multi-omics studies are designed around a functional phenotype first (respiration, ROS, calcium handling), then use proteomics/metabolomics/lipidomics to explain why that phenotype changed.
The Systems Biology Approach to Mitochondrial Dysfunction
Single-omics studies are increasingly vulnerable to a predictable reviewer comment: "How do you know these molecular changes are functionally meaningful?" In mitochondria, that criticism is fair. Bioenergetics is an emergent property; it depends on coupling between:
- the enzymatic machinery (what's expressed, assembled, and modified),
- the metabolic state (what substrates are available and what redox/energy ratios look like), and
- the membrane architecture (where complexes sit, how cristae are shaped, and whether key lipids stabilize supercomplexes).
In practice, the mitochondrion behaves like a constrained engineering system. A defect at one layer often propagates to others:
- Proteomics: can reveal remodeling of OXPHOS complex subunits, assembly factors, transporters, and stress proteins. For example, changes in proteins that support respiratory chain supercomplexes can shift coupling efficiency.
- Metabolomics: reports the functional output in real time: TCA intermediates, NADH/NAD(^+)-linked redox state proxies, and energy balance (e.g., ATP/ADP patterns) that reflect respiration and substrate flux.
- Lipidomics: defines the "hardware substrate" mitochondria run on. Membrane lipid composition impacts curvature, cristae organization, and the stability of key complexes. Cardiolipin is a central example: cardiolipin deficiency has been linked to destabilized respiratory chain supercomplexes in Barth syndrome contexts (McKenzie et al., 2006).
What matters for experimental design is the relationship between these layers.A strong multi-omics design functions as a biological cross-validation strategy:
- If proteomics suggests increased expression of TCA enzymes, isotope tracing should show increased carbon flow through the corresponding nodes.
- If metabolomics shows succinate accumulation, proteomics should identify whether the bottleneck is enzyme abundance, PTM regulation, or complex assembly.
- If lipidomics shows cardiolipin remodeling, proteomics and functional assays should test whether complex IV/respirasome stability or respiration capacity shifts accordingly.
Strategic Omics Pairing and Advanced Methodologies
Not every project needs full tri-omics on day one. The goal is to pick the smallest set of omics layers that can prove your mechanistic claim.
The table below gives a practical starting framework.
| Research phenotype / question | Best starting pairing | Why it works | Typical "proof" outcome |
|---|---|---|---|
| Hypoxia response, Warburg-like rewiring, nutrient stress | Proteomics + Metabolomics | Enzyme capacity + pathway output/flux | Concordant enzyme changes + metabolite shifts/labeling patterns |
| Neurodegeneration, membrane remodeling, apoptosis priming | Proteomics + Lipidomics | Enzyme/PTM control + membrane architecture | Lipid remodeling explained by enzyme abundance/PTM + functional consequence |
| Unclear phenotype, drug MoA, genetic perturbation with mixed effects | Proteomics + Metabolomics + Lipidomics | Captures enzymatic, functional, and structural layers | Mechanistic model tied to functional assay readouts |
Proteomics + Metabolomics: Deciphering Metabolic Flux via Isotope Tracing
This pairing is ideal when your phenotype is fundamentally energetic: oncology metabolic reprogramming, hypoxia adaptation, immune activation, or mitochondrial substrate preference shifts.
A common failure mode is to interpret metabolite abundance as flux. A pool size snapshot can be misleading: a metabolite can stay constant while flux changes dramatically, or it can accumulate because downstream usage is blocked.
The highest-leverage design is:
- DIA proteomics to quantify enzyme and transporter abundance with high completeness across samples (reducing missing-value artifacts).
- Stable isotope tracing metabolomics (e.g., (^{13})C or (^{15})N tracing) to demonstrate how labeled atoms move through metabolic nodes over time.
Mechanistically, these layers answer different questions:
- Proteomics: "Do I have more of the machinery that should catalyze this step?"
- Isotope tracing: "Is carbon (or nitrogen) actually flowing through that step in the perturbed condition?"
For functional mitochondrial studies, this combination can convert a plausible interpretation into a testable mechanistic model.
Where this becomes powerful is in mapping enzyme shifts to label propagation logic. For example:
- If DIA proteomics shows upregulation of enzymes supporting anaplerosis, tracing should show increased label incorporation into downstream TCA intermediates.
- If proteomics indicates decreased complex I subunits or assembly factors, tracing may show altered NADH-linked input handling and a shift toward alternative substrate oxidation.
If you're designing a mitochondria-centric study and want to keep omics readouts anchored to the organelle (rather than diluted by whole-cell background), it helps to plan enrichment/QC and platform choices as one workflow. For readers who need a reference point for service-ready execution, Creative Proteomics' mitochondrial metabolomics analysis services and mitochondrial proteomics services are relevant starting points.
Proteomics + Lipidomics: Membrane Dynamics and PTMs
This pairing is ideal when membrane structure is the phenotype driver: neurodegeneration, mitochondrial fusion/fission dynamics, mitophagy, apoptosis susceptibility, or stress-linked cristae remodeling.
The value of this pairing is that it supports causal plausibility, not just correlation.
- Lipidomics can show remodeling of cardiolipin species, phosphatidylethanolamine/phosphatidylcholine balance, or other membrane lipids that influence curvature and protein complex microenvironments.
- Proteomics can identify whether the enzymes that remodel or traffic those lipids are changed in abundance.
A frequent gap in "proteomics + lipidomics" designs is regulation. Many mitochondrial and lipid metabolism enzymes are heavily controlled by PTMs.
For mitochondrial functional interpretation, PTM-aware proteomics matters when:
- you suspect rewiring is regulation-driven (not just expression-driven),
- enzyme complexes change without dramatic abundance shifts, or
- perturbations (e.g., acetyl-CoA levels) are likely to change acetylation states.
Mitochondrial protein acetylation is a relevant example because acetylation can modulate enzyme activity and intersect with lipid metabolism and energy handling. In workflow terms, this is where an integrated page like Creative Proteomics' mitochondrial analysis services—which explicitly includes mitochondrial lipidomics and PTM analysis—can act as a practical navigation point when you're scoping a unified study.
Overcoming the Analytical Bottleneck: Co-Extraction and Normalization
Multi-omics bottlenecks rarely show up in the abstract. They show up on the bench and in data processing:
- pre-analytics with incompatible requirements (purity vs speed), and
- scaling/normalization across omics layers so the integration is biologically meaningful.
Resolving the Purity vs. Speed Paradox
The central paradox is real:
- Proteomics often benefits from ultra-pure mitochondria to reduce background and improve protein assignment confidence (for example, via density gradients).
- Metabolomics often demands instantaneous quenching to prevent post-isolation turnover of labile metabolites.
In other words, the very steps that improve proteomic specificity can distort metabolite truth.
A practical way to plan around this is to decide which errors are most dangerous for your specific hypothesis.
| Your priority | Biggest risk if you get it wrong | Design choice that usually helps |
|---|---|---|
| Clean mitochondrial proteome (complex assembly, low-abundance proteins) | Cytosolic/ER contamination confounds interpretation | Higher-purity isolation + marker-based contamination assessment |
| True metabolic state (ATP, redox-linked pools, fast turnover metabolites) | Turnover during isolation produces false differences | Faster isolation/quench; minimize handling time; run matched blanks |
| Limited sample amount | Aliquot-to-aliquot variability dominates | Single-sample co-extraction so layers are perfectly matched |
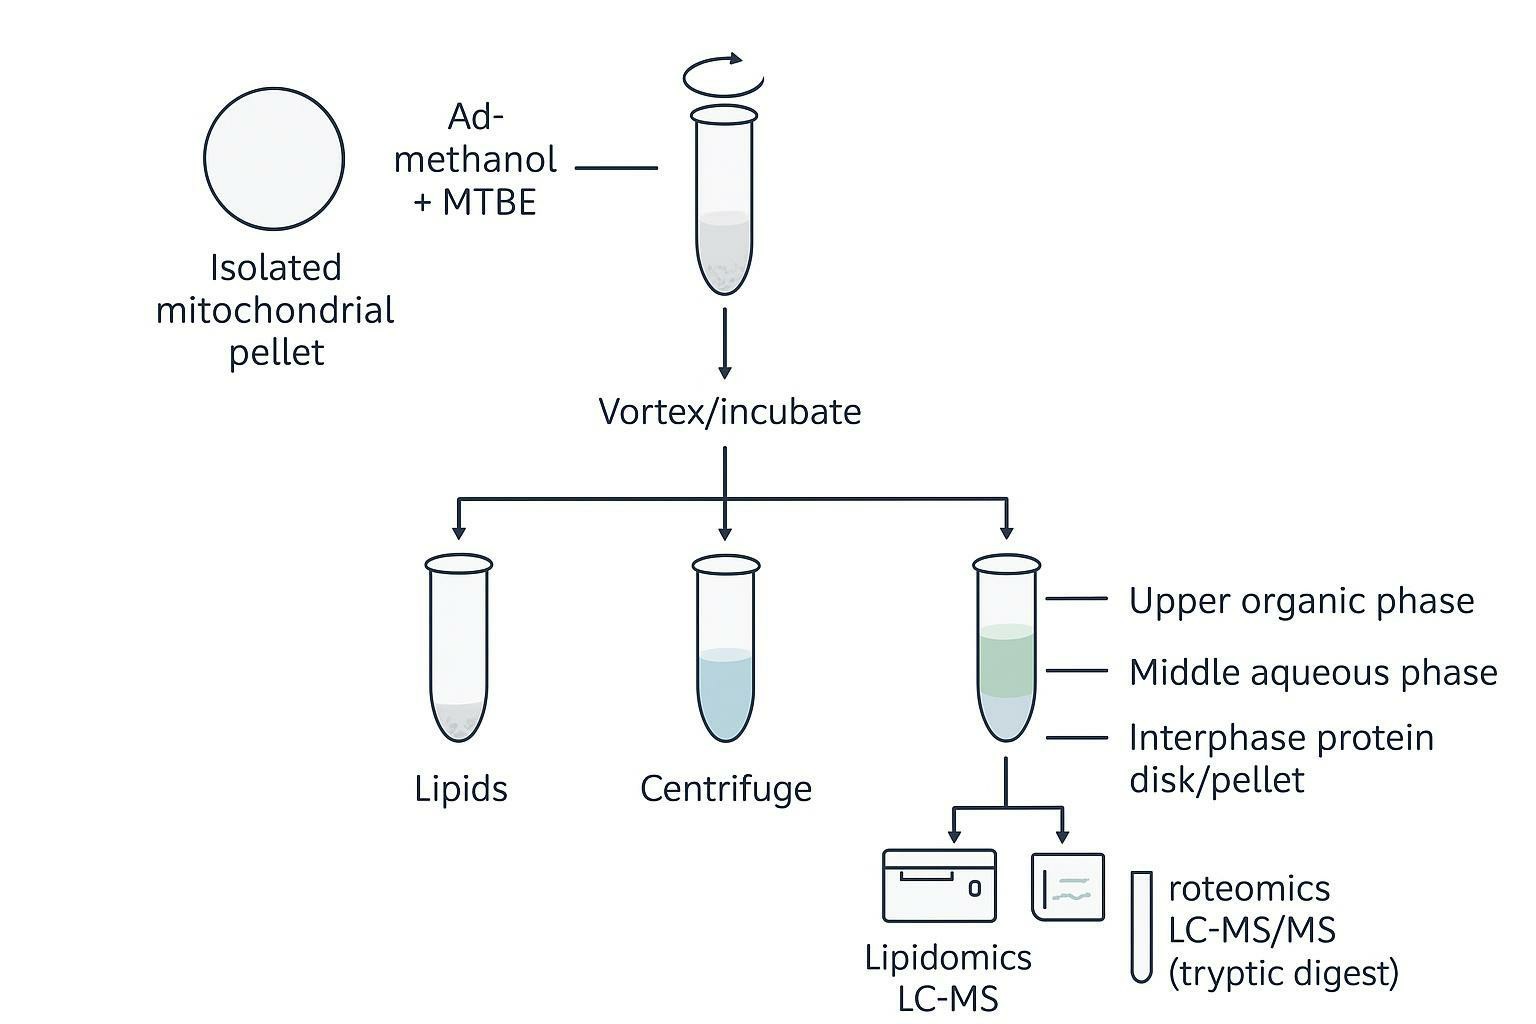
One method that directly addresses limited material and inter-aliquot variability is biphasic co-extraction.
The MTBE-based approach (often associated with Matyash-style extraction) supports a single-pellet workflow where polar metabolites and lipids are separated into different solvent phases, while proteins precipitate at the interphase/pellet.
In the original MTBE extraction description, the low density of MTBE drives the lipid-containing phase to the top, simplifying collection (Matyash et al., 2008). A later simultaneous extraction workflow formalized the idea of generating matched metabolite/lipid/protein fractions from one sample (Coman et al., 2016).
Why this matters for multi-omics: If you split mitochondria into three tubes and run three different extractions, the integration step has to contend with biological variance introduced by splitting, pellet heterogeneity, and differential losses. Co-extraction makes your "integration" step more honest because the input material is shared.
Mitochondrial-Specific Data Normalization
A frequent analytical error in mitochondrial multi-omics is assuming that sample input is comparable when mitochondrial isolation yield differs across conditions.
If one condition yields fewer mitochondria (because the perturbation changes mitochondrial mass, fragility, or isolation efficiency), you can create an illusion of "metabolic downregulation" that is really just "less mitochondria per tube."
A robust normalization plan usually includes two layers:
- Technical normalization (platform-specific): internal standards, QC pools, drift correction.
- Biological normalization (mitochondria-specific): normalization to mitochondrial content markers.
In mitochondrial metabolomics methods literature, normalization to mitochondrial protein content is a common approach, alongside internal standards and run-level QC (Go et al., 2014). For multi-omics functional studies, you often need a mitochondria-specific anchor that reflects mitochondrial content across samples.
Common anchors include:
- Citrate synthase activity (a widely used proxy for mitochondrial content)
- VDAC abundance (protein-level proxy; aligns well with proteomics quantification)
The choice should be aligned to your question:
| Normalization anchor | Corrects for | Best when | Caveat to state in methods |
|---|---|---|---|
| Total mitochondrial protein | loading differences | single-omics metabolomics within same prep | can blur "composition vs mass" changes |
| Citrate synthase activity | mitochondrial content/yield | cross-condition comparisons where mass may differ | enzyme activity can itself change in some perturbations |
| VDAC or TOMM20 abundance | mitochondrial abundance in proteomics context | multi-omics integration (ties to proteomics layer) | protein abundance can change under stress/mitophagy |
| Multiple anchors (recommended) | robustness check | publication-facing multi-omics | requires pre-registration of decision logic |
⚠️ Practical caution: If metabolomics is normalized to total protein while proteomics is normalized to total peptide intensity, the integration step may combine measurements with different biological meanings. Define the biological anchor first, then align each platform's normalization strategy to it.
Correlating Multi-Omics with Functional Phenotypes
Omics tells you what is altered. Functional assays tell you whether those alterations matter in the phenotype you claim.
For mitochondria, the most persuasive designs treat functional readouts as a first-class data layer, not an afterthought.
Key examples include:
- High-resolution respirometry and Seahorse XF analysis (oxygen consumption rate, ATP-linked respiration, maximal capacity, spare respiratory capacity)
- ROS production assays (mitochondrial ROS is often the mechanistic bridge between redox changes and downstream signaling)
- Calcium handling measurements (mitochondrial Ca(^{2+}) uptake can drive both metabolism and cell fate)
A practical integration approach is to define a small set of phenotype metrics up front, then use multi-omics to explain those metrics.
For example:
- If OCR decreases, do you see decreased abundance of complex I/III/IV subunits (proteomics), depletion of TCA intermediates (metabolomics), and cardiolipin remodeling (lipidomics) that would destabilize complex assembly?
- If maximal respiratory capacity drops but baseline OCR is preserved, do you see an altered spare capacity phenotype that correlates with enzyme abundance shifts rather than metabolite pool depletion?
If you want to keep readers inside a mitochondrial-functional workflow rather than a generic omics narrative, placing a contextual internal link to mitochondrial phenotype analysis using high-content imaging can help them connect molecular layers to orthogonal functional phenotyping.
Data Integration: Advanced Bioinformatics Frameworks
Multi-omics integration is where a project either becomes mechanistically coherent or remains a collection of disconnected datasets.
Move beyond Venn diagrams. Your goal is to connect high-dimensional measurements into a single model where:
- shared variation corresponds to biology, not batch,
- modality-specific variation is interpretable (not discarded), and
- pathway-level conclusions are anchored to functional phenotypes.
MOFA+ and DIABLO Algorithms
Two widely used frameworks illustrate complementary philosophies.
- MOFA+ is an unsupervised latent factor model that learns a small number of factors explaining shared and modality-specific variance. It's well suited when you want to discover structure (subtypes, trajectories, major variance drivers) across modalities without forcing the analysis to follow predefined labels (Argelaguet et al., 2020).
- DIABLO (in mixOmics) is supervised: it identifies correlated components across omics layers that discriminate predefined groups (e.g., control vs treated, responder vs non-responder). It's a good fit when you have a clear outcome label and want a minimal cross-omics signature (Singh et al., 2019).
A design implication: MOFA+ tolerates exploratory studies well, but it rewards well-controlled batches; DIABLO can overfit if class sizes are small or confounded by batch. In both cases, planning your normalization and QC strategy before data generation is what makes the integrative model credible.
Knowledge-Driven Biological Pathway Mapping
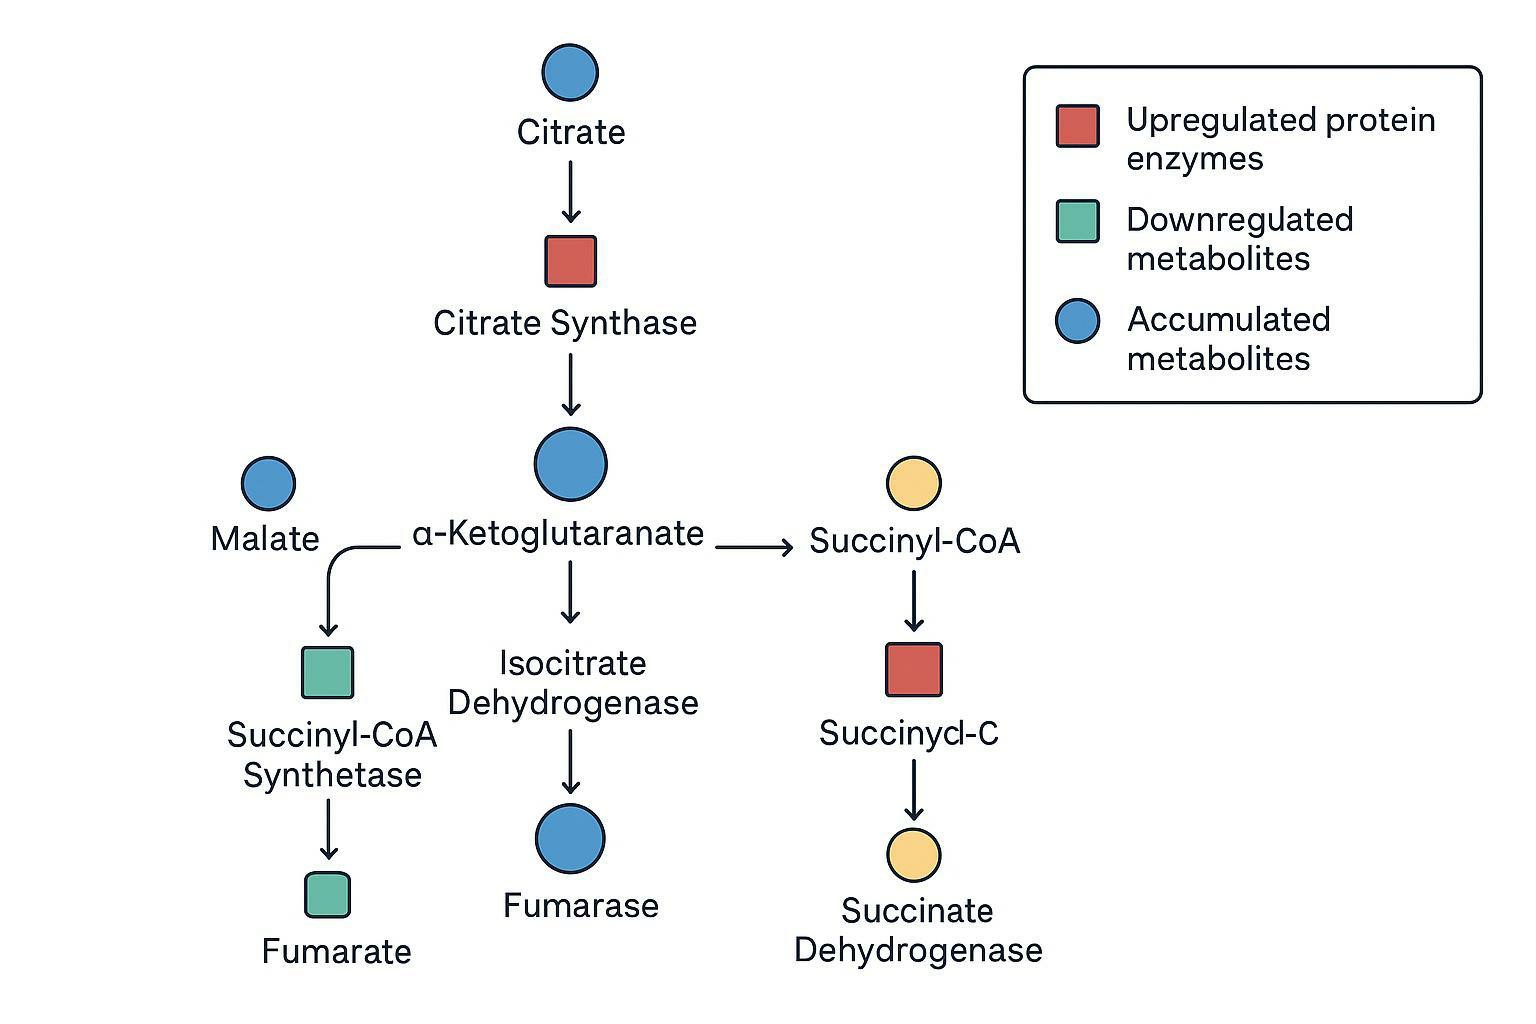
Statistical integration becomes biologically actionable when you can map quantitative changes to canonical mitochondrial pathways.
A concrete, high-value deliverable is a pathway overlay where:
- proteomics provides enzyme abundance changes, and
- metabolomics provides substrate/product shifts,
then both are projected onto a curated map (e.g., a KEGG TCA cycle map) to identify bottlenecks.
Example interpretation pattern:
- Proteomics shows decreased abundance of a specific enzyme node.
- Metabolomics shows accumulation upstream and depletion downstream.
- Isotope tracing confirms reduced label propagation across that node.
That convergence is what turns "association" into "likely mechanism."
Designing a mitochondrial multi-omics study requires more than instrument time. It requires experimental planning that accounts for the purity–speed tradeoff, extraction compatibility, mitochondria-specific normalization, and integration logic before samples are generated. For teams planning studies that combine mitochondrial isolation, LC–MS/MS-based proteomics, metabolomics, lipidomics, and orthogonal functional readouts, Creative Proteomics can support early study design alignment so the final deliverables connect molecular changes to a unified mechanistic model.
Frequently Asked Questions
Can you run proteomics, metabolomics, and lipidomics on the exact same mitochondrial prep?
Yes—when you plan extraction to generate matched fractions from one sample. Biphasic co-extraction can separate a single mitochondrial pellet into polar metabolite, lipid, and protein fractions so the datasets share the same biological starting point.
What's the difference between mitochondrial metabolite abundance and mitochondrial metabolic flux?
Abundance is a concentration snapshot; flux is the rate of label movement through a pathway. Flux can change without large pool-size shifts, so stable isotope tracing is often needed when your claim is "pathway activity changed."
Is DIA better than DDA for mitochondrial proteomics?
Often, yes for cohort-scale quantification. DIA tends to reduce missing values and improves comparability across batches, which matters when you're correlating enzyme abundance with metabolite and lipid changes.
How pure do mitochondria need to be for multi-omics studies?
Pure enough that contamination won't dominate the layer you care about most. Metabolomics and lipidomics are especially sensitive to carryover from media and other organelles, so a marker-based purity check (plus blanks/QC pools) is usually part of a publishable workflow.
Can I use frozen tissue to isolate mitochondria for metabolomics?
It's generally difficult for functional mitochondrial metabolomics because freezing can disrupt membranes and redistribute labile metabolites. If frozen tissue is unavoidable, consider designing around whole-tissue or whole-cell metabolomics for the metabolic layer and using proteomics/lipidomics to maintain mechanistic depth.
How should I normalize mitochondrial multi-omics data across conditions?
Use technical normalization within each platform (internal standards, drift correction) and at least one mitochondria-specific biological anchor (e.g., citrate synthase activity or a mitochondrial marker protein) so apparent changes aren't just differences in mitochondrial yield.
How do I combine Seahorse XF results with omics without over-interpreting correlations?
Integrate at the pathway/module level rather than chasing single-feature correlations. Treat OCR-derived phenotypes as constraints, then ask whether coherent modules (ETC subunits, TCA enzymes, cardiolipin remodeling) jointly explain the functional shifts across replicates.
What's the most common mistake in mitochondrial multi-omics experimental design?
Designing each omics layer independently. The fix is to pre-specify cross-validation logic (enzyme changes should align with tracing patterns; lipid remodeling should align with complex stability/respiration phenotypes) and to build normalization and batch controls around that integration goal.
References
- Lipid extraction by methyl-tert-butyl ether for high-throughput lipidomics
- Simultaneous Metabolite, Protein, Lipid Extraction (SIMPLEX)
- Mitochondrial Metabolomics Using High-Resolution Fourier-Transform Mass Spectrometry
- MOFA+: a statistical framework for comprehensive integration of multi-modal single-cell data
- DIABLO: an integrative approach for identifying key molecular drivers from multi-omics assays
- Mitochondrial respiratory chain supercomplexes are destabilized in Barth Syndrome
* For Research Use Only. Not for use in diagnostic procedures.