
Exosome data can look "clean" on paper and still fail the moment you try to reproduce it, compare cohorts, or defend it in peer review. The fix is rarely a single assay; it's choosing the right exosome characterization techniques and being explicit about what each readout can prove.
That's why modern EV papers increasingly treat characterization as a workflow, not a checkbox. When the goal is MISEV 2023 EV characterization, the most defensible approach is to combine complementary techniques rather than over-interpret any one output.
You size and count. You validate markers and depletion of contaminants. You look at morphology. And when the biology demands it, you move from bulk averages to single-particle phenotyping.
MISEV 2023 Guidelines: Navigating Standardized EV Characterization
The most important shift in EV standards isn't a new instrument. It's the expectation that you can justify what you're calling "EVs," show what else is present in your isolate, and report enough experimental detail for other labs to get the same answer.
Quick Start: Minimal MISEV-Aligned Characterization Sets
If you only remember one thing from MISEV 2023, make it this: characterization is a claim-and-evidence package. Pick the smallest set of assays that can defend your claim, then add single-particle tools only when subpopulation biology matters.
| Goal or sample context | Recommended minimal set | What it can support | What it cannot support |
|---|---|---|---|
| Routine EV QC after isolation (cell culture media, relatively clean background) | NTA + WB + TEM | Particle yield/size trend, EV-associated marker enrichment + contaminant depletion, membrane-bound morphology present | Does not resolve marker-defined subpopulations; cannot prove all counted particles are EVs |
| Complex biofluids (plasma/serum/urine) with high non-vesicular background | NTA + WB (strong negatives) + TEM | Same as above, with stronger defensibility around co-isolates when negative markers are reported | Still cannot distinguish lipoproteins/aggregates by NTA alone; "exosome count" claims remain risky without orthogonal support |
| Biomarker work where subtype claims matter (e.g., tumor-associated EVs, TF-positive EVs) | NTA + WB + TEM + SP-IRIS | Adds single-vesicle surface phenotyping and relative subpopulation abundance on a defined capture panel | SP-IRIS reflects capture bias (panel defines what you see); totals are not directly comparable to NTA |
| Engineered/modified EVs where surface display is a key claim | TEM (or cryo-EM) + WB + SP-IRIS (add NTA for yield tracking) | Morphology confirmation + engineered marker expression + single-particle marker co-localization | Does not automatically establish functional activity; requires separate functional assays |
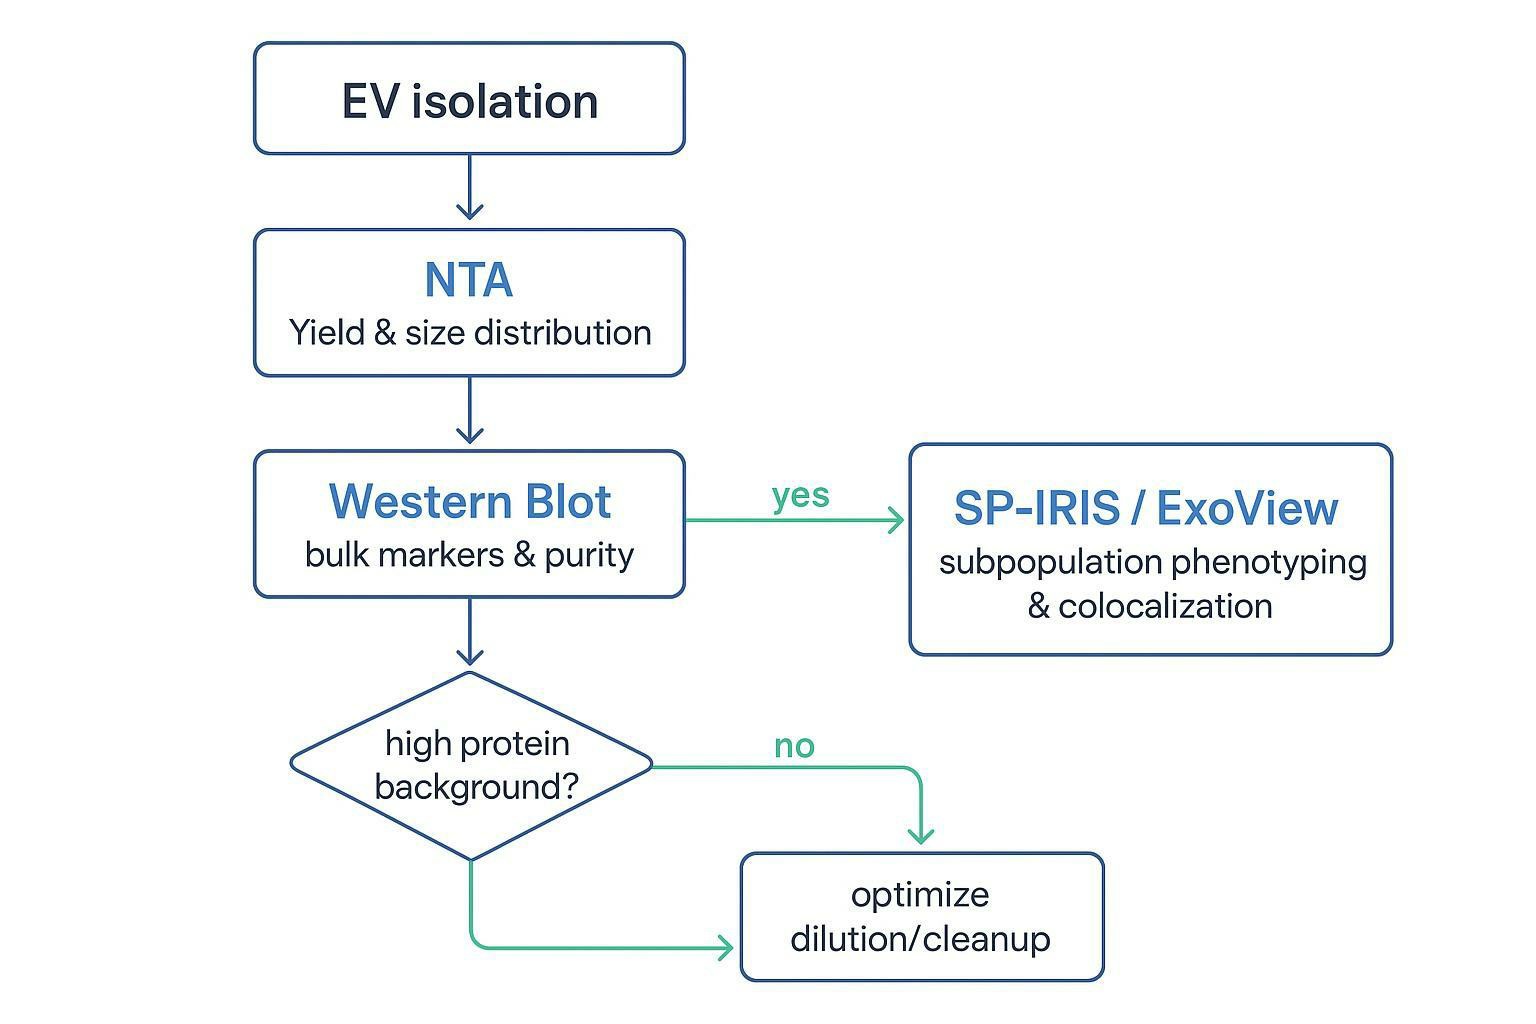
Think of NTA + WB + TEM as the baseline "identity + purity + morphology" triad. Add SP-IRIS when you need to defend statements about which EVs are changing—not just how many particles you have.
The "Quadruple Check" Standard
MISEV-aligned characterization is fundamentally multi-modal. The reasoning is simple: every technique has a blind spot.
- Physical sizing and concentration metrics can't prove vesicles are present. They only prove particles are present.
- Bulk protein assays can show enrichment of canonical EV markers, but they don't show whether particles are intact or whether a small contaminant drives the signal.
- Microscopy can verify membrane-bound structures, but it's not a high-throughput quantitative method.
- Single-particle platforms can reveal subpopulations, but they often depend on capture antibodies or labeling chemistry.
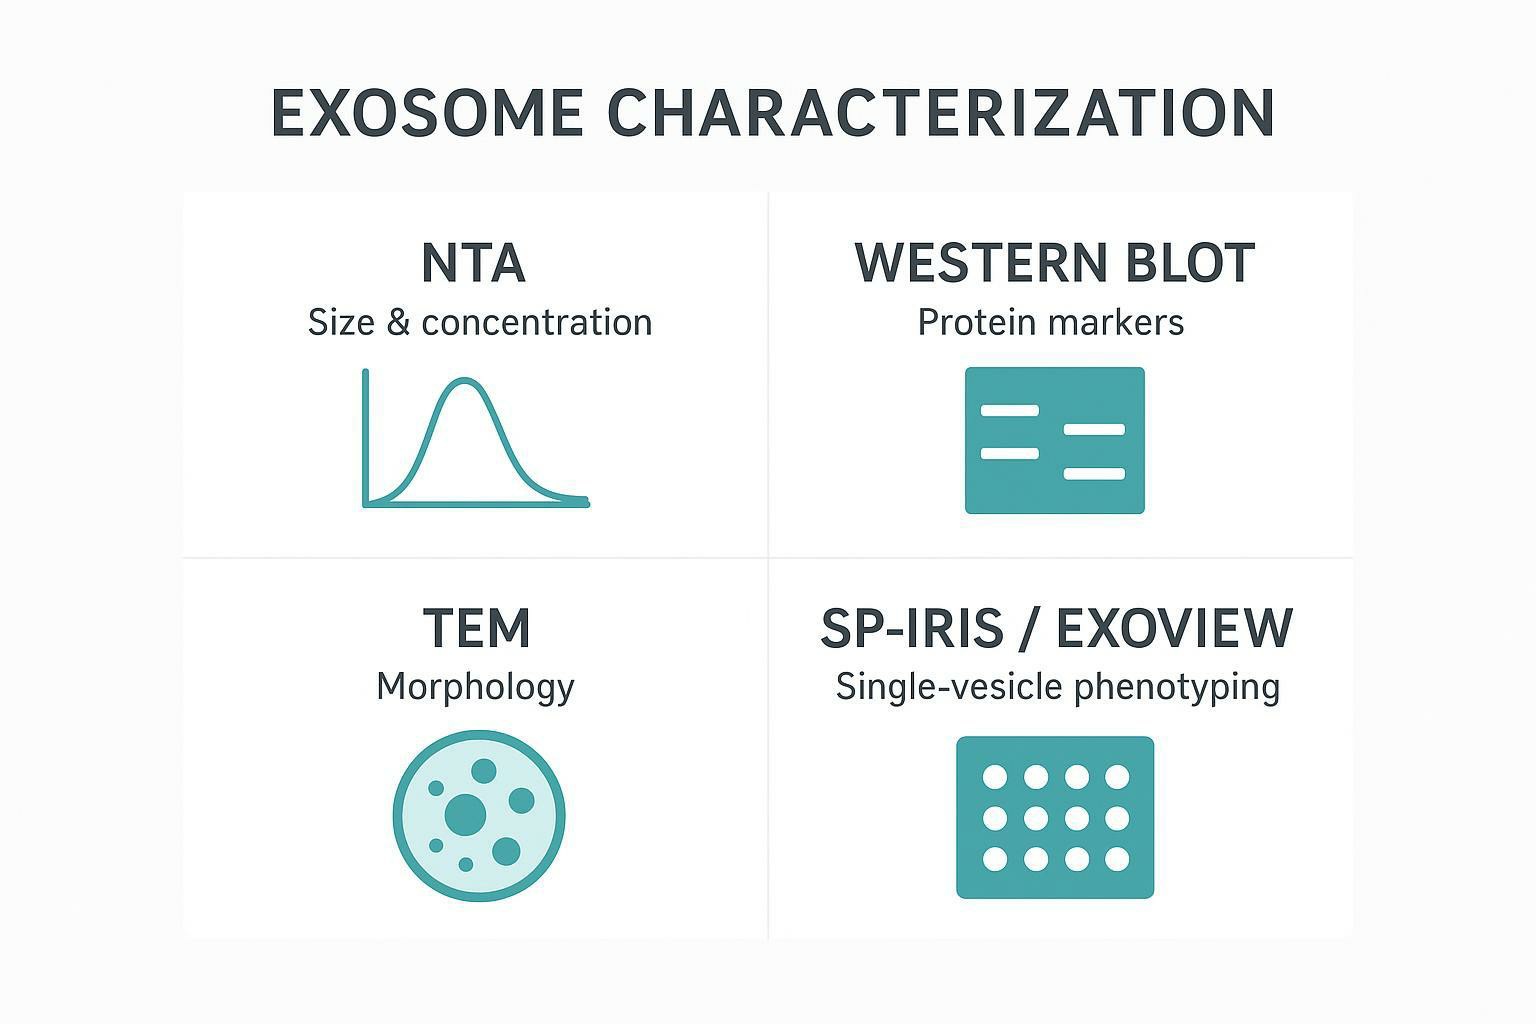
In practice, MISEV 2023 pushes you toward an orthogonal "quadruple check": (1) physical sizing/counting, (2) biochemical marker profiling with both positive and negative markers, (3) direct visualization, and (4) single-particle phenotyping when subpopulation claims matter. The ISEV guideline document, Minimal information for studies of extracellular vesicles (MISEV2023), is the best starting point if you need to align your methods section and QC story with current expectations.
The Push for Reproducibility
Reproducibility in EV studies breaks down in predictable places: pre-analytical variables (serum vs plasma, freeze-thaw history), isolation trade-offs (yield vs purity), and incomplete reporting (camera settings for NTA, antibody clone info for WB, grid prep for TEM).
MISEV 2023 doesn't mandate a single "correct" method. It does make you accountable for the choices you make and the controls you ran. For many teams, that isn't just about publication. It's also about generating a characterization package that can survive internal QC gates and, for translational programs, the documentation expectations that come with regulated development.
Nanoparticle Tracking Analysis (NTA): Hydrodynamic Sizing and Particle Quantification
NTA remains a workhorse because it answers two questions quickly in most exosome characterization techniques packages: "How many particles do I have?" and "What's the bulk size distribution in suspension?" Used well, it's a reliable yield and batch-consistency readout. Used casually, it's a fast way to overcount lipoproteins and convince yourself you've made more EVs than you actually did.
Principle
NTA tracks the Brownian motion of individual light-scattering particles and uses the Stokes–Einstein relationship to infer a hydrodynamic diameter. Hydrodynamic sizing matters: it reflects how a particle behaves in solution, including surface-associated proteins and hydration layers, not just the "hard" core diameter you might estimate from dry imaging.
Data Readouts
A typical NTA report gives you:
- Total particle concentration (particles/mL)
- Size distribution (often as mean, mode, and percentiles such as D10/D50/D90)
- Polydispersity/heterogeneity cues (broad vs narrow peaks; presence of multiple modes)
For EV work, the most useful habit is to treat NTA as a trend tool (batch-to-batch comparability, enrichment checks, dilution linearity), then anchor the biological interpretation with orthogonal assays.
If you're setting up an NTA characterization package as a service deliverable, it's useful to see what a standardized output can look like. The Nanoparticle Tracking Analysis for Exosome Characterization page provides a good example of the common deliverables teams expect (size distribution plots, concentration, and optional fluorescence marker-positive subpopulation readouts).
Error Sources & Solutions
The hardest NTA problems usually come from the sample, not the instrument.
1) Multiple scattering and coincidence at high concentration
When particle counts per field of view get too high, tracks overlap and scattering events interfere. That can distort both size and concentration. The practical fix is boring but effective: run a short dilution series and pick the range where concentration scales linearly with dilution.
Pro Tip: Don't treat "recommended dilution" as a single number. Document the dilution range where your size mode is stable and concentration is linear. That becomes a reproducible QC checkpoint.
2) Complex biofluids and non-vesicular particles
In serum or plasma, light-scattering lipoproteins and protein aggregates can sit in the same apparent size range as small EVs. NTA can't intrinsically tell you what a particle is. It's one reason many labs interpret NTA as "particle count," not "exosome count," unless the isolation and orthogonal validation support that claim.
3) Dynamic range limits for very small particles
For many NTA setups, resolving peaks below ~60 nm can be unreliable compared with TEM or SP-IRIS. In a head-to-head comparison across platforms, Bachurski and colleagues showed that NTA devices differed meaningfully by hardware/software, and that both NTA instruments struggled to report an EV peak diameter below ~60 nm compared with TEM and SP-IRIS (Extracellular vesicle measurements with nanoparticle tracking analysis (Bachurski et al., 2019)). That doesn't make NTA "wrong," but it does define how far you can push it when your biological claim depends on the small end of the distribution.
Reporting Checklist: What to Document for Reproducible NTA
If you want another lab (or your future self) to reproduce your NTA distribution and concentration, report these items explicitly:
- Sample matrix and handling (e.g., serum vs plasma vs media; freeze–thaw history; storage time/temperature)
- Dilution series and the linearity range used for reporting concentration
- Instrument model and software version
- Temperature control during acquisition
- Camera level / sensitivity and detection threshold (or equivalent analysis parameters)
- Capture scheme (number of videos, seconds per capture, number of replicates)
- Size binning and how you report size (mode/mean, D10/D50/D90)
- QC notes (background level, acceptance criteria, and whether tracks were excluded)
These details don't change the biology, but they dramatically change whether reviewers trust the numbers.
Western Blotting: Immunoblot Profiling for Canonical Markers and Purity
Western blotting is still one of the most defensible ways to show you enriched EV-associated proteins and depleted obvious contaminants, especially when reviewers ask for Western blot exosome markers such as CD9, CD63, CD81, ALIX, and TSG101 alongside negative controls. It's also where many EV characterization packages quietly fail: a single positive marker, no negatives, and loading that doesn't allow any real comparison across samples.
MISEV-Required Markers
A good WB panel is not "three positives because that's what everyone does." It's a logic chain: you show EV-enriched proteins that are expected to travel with vesicles, and you show depletion of proteins that should stay behind if your isolation was clean.
Positive markers (enrichment evidence)
Tetraspanins (CD9, CD63, CD81) are commonly used surface markers, and cytosolic proteins such as ALIX (PDCD6IP) and TSG101 are frequently used as internal EV-associated markers. MISEV 2023 emphasizes using marker categories and being explicit about what each marker is intended to demonstrate (presence of EV-associated material vs presence of co-isolates).
Negative markers (purity evidence)
Negative markers aren't optional. They're how you show you didn't simply concentrate everything. Depending on your starting material, useful negatives can include ER proteins (e.g., calnexin) or biofluid contaminants (e.g., albumin and lipoprotein-associated proteins).
If you need a practical template for how WB is packaged as a characterization deliverable, the WB-based exosome verification page lists common EV markers and how teams typically frame WB as part of a broader verification workflow.
Troubleshooting Non-Specific Binding
When WB results are messy, the failure mode is often antibody behavior rather than biology.
- Prefer antibodies that have been tested on EV-enriched fractions, not only whole-cell lysates.
- Treat "validated" as a method, not a label: include appropriate positive/negative controls, and check whether the band appears in your EV-depleted fraction.
- Use a loading strategy that you can defend. In EV work, "equal total protein" and "equal starting volume equivalents" answer different questions. If you only pick one, note what it implies.
Reducing versus non-reducing conditions can also matter for some membrane proteins and complexes. The most defensible approach is to follow antibody datasheets and run a small pilot for your specific marker panel rather than assuming one condition fits everything.
Reporting Checklist: What to Document for Reproducible EV Western Blots
For WB to function as evidence (not just a picture), readers need enough detail to interpret specificity and comparability:
- Marker panel rationale: which are positive EV-enriched markers vs which are negative/contaminant markers
- Antibody details: vendor, catalog number, clone, host species, and dilution
- Sample input definition: equal total protein vs equal starting-volume equivalents (and why)
- Controls: EV-depleted fraction / supernatant, lysis blank, and (if available) a positive control EV prep
- Gel and transfer conditions: gel %, reducing vs non-reducing, transfer method/time
- Blocking and wash conditions (common source of non-specific background)
- Detection: exposure range (avoid overexposure) and how band intensity was quantified/normalized
If you can't report all of these, prioritize clone/cat#, loading strategy, and the EV-depleted control—those three answer most reviewer questions.
Transmission Electron Microscopy (TEM): High-Resolution Morphological Validation
TEM is the fastest way to answer a simple question in exosome characterization techniques workflows that NTA and WB can't settle: are there intact, membrane-bound vesicles in this preparation, or are you looking at non-vesicular particles that happen to share size and protein signatures?
The Imaging Requirement
Direct visualization matters because EV isolates are rarely pure. Even a "beautiful" NTA distribution can come from a mixture of vesicles, lipoproteins, and protein aggregates. TEM gives you a way to confirm membrane-delimited structures and to assess heterogeneity (including obvious debris, clumps, or stain artifacts).
Image quality, however, is not guaranteed. In a study explicitly focused on EV TEM image quality, Rikkert and colleagues showed that TEM outcomes are strongly operator- and protocol-dependent, and that selection bias is a real risk if imaging is not standardized (Quality of extracellular vesicle images by transmission electron microscopy (Rikkert et al., 2019)).
Classic Morphology
Negative staining is widely used because it's accessible and contrast-rich. It also explains the "classic cup shape" many papers show: dehydration and staining can deform vesicles, producing a concave appearance that is useful as a familiar signature but not a claim about native morphology.
The practical takeaway is to interpret negative stain TEM as a structural validation tool (membrane-bound vesicles present; gross contaminants visible), not as an exact morphometry tool.
Cryo-EM (Optional Upgrade)
Cryo-EM addresses the biggest conceptual weakness of TEM negative staining cup-shaped exosomes: dehydration artifacts. By vitrifying samples in a near-native hydrated state, cryo-EM preserves spherical vesicle integrity and can reveal internal structures without heavy-metal staining. Not every project needs cryo-EM, but it becomes valuable when you're characterizing engineered EVs, comparing subtle morphology changes, or building a higher-confidence dataset for translational work.
For a service-level example of how TEM (including cryo-EM options) is positioned in an EV characterization package, see TEM-based exosome identification.
Reporting Checklist: What to Document for Reproducible TEM Imaging
TEM can confirm vesicles are present, but it's also where selection bias quietly enters. To make imaging defensible, report:
- Grid type and coating (e.g., carbon/formvar; glow discharge yes/no)
- Staining protocol (stain type, concentration, staining time, wash/dry steps)
- Sample input (concentration range loaded; volume applied; incubation time on grid)
- Microscope model, accelerating voltage, and camera system
- Imaging settings: magnification range and pixel size (or scale calibration)
- Field selection rule: random/ systematic fields vs "representative" selection, and how many fields were captured
- Number of independent preparations (technical replicates) and how many images per prep
A simple rule that reviewers respect: define the field-selection rule before you look for ‘nice' vesicles.
SP-IRIS (ExoView): Advanced Single-Vesicle Phenotyping and Co-localization
If NTA tells you how many particles you have and TEM tells you what they look like, SP-IRIS ExoView exosome phenotyping answers a different question: which markers sit on the surface of individual vesicles, and how many vesicles are in each phenotypic subpopulation.
That shift matters anytime you're working with heterogeneous EV populations (which is most of the time) or when the story hinges on a specific subtype (tumor-associated EVs, tissue factor–positive EVs, engineered EVs with a defined surface display).
Platform Insight
SP-IRIS (single-particle interferometric reflectance imaging sensor) uses an interferometric chip to detect nanoparticles captured on a surface. In practical terms, it gives you digital, single-particle counting and sizing in a defined detection range, then overlays immunofluorescence readouts for phenotyping.
For a protocol-oriented overview, the 2022 SP-IRIS methods paper on PMC is a useful reference: Single-particle interferometric reflectance imaging (SP-IRIS) for extracellular vesicle analysis (2022).
Capture-Based Analysis
SP-IRIS platforms such as ExoView typically use antibody-functionalized chips. That capture step can be a strength when you need to work in complex matrices (plasma, serum, urine) and you want to interrogate specific surface-marker-defined EV subsets.
It also introduces a key interpretive constraint: what you count depends on what you capture. You're not measuring "all EVs." You're measuring "EVs that bind this capture panel under these conditions." Good reporting makes that explicit.
Reporting Checklist: What to Document for SP-IRIS
Because SP-IRIS is capture-based, the panel and thresholds are part of the measurement. For reproducibility, report:
- Chip type/vendor and capture antibody panel (spot identities, clone/cat# if available)
- Sample matrix and any pre-cleanup steps (especially for plasma/serum)
- Incubation conditions (time, temperature, mixing, wash stringency)
- Fluorescence labeling: antibodies/dyes used, concentrations, and incubation times
- Thresholding rules for calling fluorescence-positive events and how background was defined
- Size/sensitivity window used for analysis and any calibration beads/standards
- Batch details: chip lot numbers and reagent lots when comparing cohorts
- Controls: isotype/negative control spots, blank runs, and (if available) a reference EV prep
When publishing, a one-sentence reminder helps avoid misinterpretation: SP-IRIS counts are conditional on the capture panel and cannot be compared 1:1 with NTA totals.
For readers looking for a practical service implementation of this approach, the ExoView Exosome / EV Profiling Service page describes immunocapture-based analysis and the typical deliverables (subpopulation counts and fluorescence-based phenotyping).
Multiplexed Co-localization
A major reason SP-IRIS has become popular in biomarker work is co-localization: you can probe multiple markers on the same captured vesicle and estimate how frequently markers co-occur.
In practice, that enables claims like "CD9+/CD63+ double-positive vesicles increase in condition X," provided you also report capture chemistry, antibody clones, and the controls used to interpret fluorescent positives.
SP-IRIS vs. nanoFCM
Both SP-IRIS and nano-flow cytometry aim at single-particle EV analysis, but they work very differently.
| Dimension | SP-IRIS (ExoView) | nanoFCM |
|---|---|---|
| Core concept | Surface capture on antibody spots + interferometric imaging | Flow-based single-particle detection in suspension |
| Works directly in complex biofluids | Often yes, because capture can enrich target subsets | Often requires careful cleanup to reduce background and coincidence |
| Readout strength | Phenotyping and co-localization on captured vesicles | High-throughput per-particle fluorescence and scatter in flow |
| Major limitation to plan for | Capture bias (panel defines what you measure) | Sensitivity/calibration challenges, especially for small/low-scatter EVs |
The right choice depends on whether your priority is multiplex immunocapture phenotyping in messy matrices (SP-IRIS advantage) or high-throughput suspension-based counting with fluorescence panels (nanoFCM advantage).
Orthogonal Validation: Establishing a Multi-Modal Characterization Workflow
The moment you try to publish or compare datasets, you run into the same core truth: one technique answers one narrow question, and EV samples fail in multiple ways.
Orthogonal validation means you deliberately combine methods so that the weakness of one technique is covered by the strength of another. It also means you decide, up front, what each readout is allowed to claim.
Why One Technique is Never Enough
- NTA is excellent for yield tracking and batch consistency, but it cannot prove particle identity.
- WB shows EV-associated proteins and depletion of some contaminants, but it collapses heterogeneity into a bulk average.
- TEM confirms membrane-bound structures and flags gross impurities, but it is low throughput and protocol-sensitive.
- SP-IRIS can resolve phenotypic subpopulations, but capture chemistry defines what you see.
The point isn't to run more assays for the sake of it. It's to create a characterization package where each result supports a specific claim you'll later make.
Data Integration & Standardization
If you want a workflow that scales across experiments, build standardization into your characterization, not just into your downstream omics.
A practical integration checklist looks like this:
| Workflow step | What it answers | What to standardize | What to watch for |
|---|---|---|---|
| NTA | Yield and size distribution in suspension | Dilution linearity range, camera settings, number of captures | High background in biofluids; multiple scattering |
| WB | Enrichment of EV markers and depletion of contaminants | Marker panel logic, antibody clone reporting, loading strategy | Single-marker overinterpretation; non-specific bands |
| TEM | Presence of membrane-bound vesicles; gross purity | Grid prep, staining time, imaging fields | Cup-shape artifact; selection bias |
| SP-IRIS | Single-vesicle phenotypes and co-localization | Capture panel, incubation conditions, fluorescence thresholds | Capture bias; lot-to-lot reagent variability |
Creative Proteomics: End-to-End Solutions for EV Analytics
A common practical constraint in EV work is sample scarcity. When you have limited clinical volume or rare cell models, splitting the sample across multiple facilities increases variability and makes it harder to align QC.
A one-stop characterization package can reduce that fragmentation by applying a standardized method set (NTA + WB + TEM imaging + SP-IRIS) under one reporting framework.
If you're building a MISEV-aware characterization dataset and need integrated deliverables, the Exosome analysis services hub is a starting point for coordinating NTA, immunoblot verification, electron microscopy imaging, and ExoView-based single-particle phenotyping.
FAQs
What's the minimum characterization set reviewers expect for exosomes or small EVs?
A common baseline is a physical sizing/counting method (often NTA), protein marker profiling with both positive and negative markers (often Western blot), and an imaging method (often TEM). MISEV 2023 frames this as a multi-modal requirement because no single readout can establish EV identity and purity on its own.
Why does my NTA particle concentration look high but my Western blot markers look weak?
This often indicates that many counted particles are not marker-positive EVs (for example, lipoproteins or protein aggregates), or that EV markers are low-abundance relative to total protein. Check dilution linearity, review EV-depleted fractions as controls, and use TEM or a single-particle assay to confirm membrane-bound vesicles.
Why do exosomes look cup-shaped on TEM?
Negative staining and drying can deform vesicles, producing the classic cup-shaped appearance. Use this as evidence that membrane-bound particles are present, but avoid treating it as a claim about native vesicle geometry; cryo-EM is better suited for near-native morphology.
How do I choose negative markers for purity in EV Western blots?
Choose negatives that match your contamination risk: ER proteins (for example, calnexin) help flag cellular debris, while albumin and lipoprotein-associated proteins are important for plasma/serum isolates. The goal is to show enrichment of EV-associated positives alongside depletion of likely co-isolates, not to chase a universal marker list.
What does SP-IRIS (ExoView) tell me that NTA can't?
SP-IRIS can quantify marker-defined subpopulations and estimate single vesicle co-localization after capture on an antibody chip. NTA reports bulk particle sizing and counting in suspension without intrinsic marker specificity.
Can I compare particle counts from NTA and SP-IRIS directly?
Not directly. NTA counts all detectable scatterers in suspension, while SP-IRIS counts only particles that bind the capture panel and meet platform thresholds, typically within a defined size sensitivity window. Compare them by defining the question (total particles vs marker-positive subsets) and reporting capture and analysis settings.
What's the fastest way to make EV characterization reproducible across projects?
Standardize the QC checkpoints that drive each readout: pre-analytical handling (matrix, freeze-thaw), NTA dilution linearity, a consistent WB marker panel with negatives, fixed TEM grid/stain imaging rules, and a defined SP-IRIS capture panel. Then report those parameters every time so other labs (and future you) can interpret the data the same way.
References
- Minimal information for studies of extracellular vesicles (MISEV2023)
- Extracellular vesicle measurements with nanoparticle tracking analysis: an accuracy and precision comparison of NanoSight NS300 and ZetaView
- Quality of extracellular vesicle images by transmission electron microscopy is operator and protocol dependent
- Single-Particle Interferometric Reflectance Imaging Sensor (SP-IRIS) for extracellular vesicle analysis
* For Research Use Only. Not for use in diagnostic procedures.