
Why EV Purity Assessment Is Critical
Extracellular vesicles (EVs)—including small EVs often referred to as exosomes—are attractive readouts for biomarker discovery and mechanistic biology because they package proteins, lipids, and metabolites that can reflect cellular state. The catch is that most biological matrices are crowded. Plasma and serum contain abundant lipoproteins and soluble proteins; urine is dilute but still protein-rich relative to EV mass; conditioned media can carry serum supplements, secreted proteins, and cell debris. As a result, many "EV preparations" are mixtures of vesicles plus non-vesicular extracellular particles (NVEPs), lipoproteins, protein aggregates, and organelle fragments.
Purity is not a vanity metric. It changes what your downstream assays "see." In proteomics or lipidomics, high-abundance contaminants can dominate signal and obscure EV-associated features. In functional assays, co-isolated cytokines, polymer carryover, protein aggregates, or apoptotic material can produce false positives—making it look like EVs are bioactive when the effect actually comes from something else.
Most importantly, EV purity is hard to infer from a single number. Robust assessment typically relies on three complementary pillars:
- Protein‑to‑particle ratio to estimate enrichment (with clear caveats)
- Negative markers to demonstrate depletion of common non‑EV components
- Co‑isolated contaminant criteria to identify major confounders such as lipoproteins, aggregates/NVEPs, and apoptotic bodies
When these criteria are paired with multiple validation techniques (orthogonal evidence), you can make defensible, manuscript‑ready claims about what is—and isn't—in your EV fraction.
Key Takeaway: EV "purity" is best treated as a multi-metric evidence package, not a single pass/fail threshold.
MISEV2023 Essentials for EV Purity Assessment
The International Society for Extracellular Vesicles (ISEV) updated community guidance in 2023. The MISEV2023 consensus statement (Welsh et al., 2024) makes a consistent point: EV studies should report evidence for EV-associated features and evaluate contamination risks in a way that is transparent and reproducible.
Overview of MISEV2023 guidelines for EV purity standards
MISEV2023 frames purity assessment as a structured evaluation of what is enriched and what is depleted. In practical terms, that means reporting:
- How EVs were enriched (separation method, matrix, key parameters)
- How EVs were identified (EV‑associated markers and/or single‑particle evidence)
- How non‑EV components were assessed (negative markers and contaminant measures)
Key reporting expectations: protein‑to‑particle ratio, negative markers, contaminants
MISEV2023 does not treat protein-to-particle ratio as "the" EV metric. It can be helpful, but it must be interpreted alongside marker and contaminant information.
A publication‑ready purity report typically includes:
- Particle concentration and size distribution (with method stated)
- Total protein concentration (with assay stated)
- A minimal marker panel that includes EV‑enriched markers and negative markers
- A contaminant‑specific readout for the dominant risk in your matrix (often lipoproteins in blood-derived samples)
Orthogonal evidence: using multiple validation techniques to assess EV purity
Orthogonal evidence means your purity claim is supported by multiple independent measurement classes. A common, practical evidence stack is:
- Particle enumeration: NTA or TRPS (or other single-particle methods)
- Protein markers: Western blot or targeted MS for EV-enriched and negative markers
- Imaging: TEM/cryo‑EM to confirm morphology and detect debris/aggregates
- Omics-level context (when relevant): proteomics to evaluate enrichment/depletion patterns
If you need a standardized workflow for WB and EM readouts, standardized Western blot and TEM checkpoints can help—especially when your downstream study depends on clean purity documentation.
Common NVEPs and addressing them in purity evaluation
NVEPs span a wide range of non‑membrane or non‑EV particles that can co-isolate with EVs depending on the separation method and matrix. Practical examples include:
- Protein aggregates and ribonucleoprotein complexes
- Lipoproteins and lipid-protein particles
- Non‑vesicular nanoparticles formed during sample processing
The workable approach is not to "prove they don't exist." It's to identify the dominant NVEP risks for your matrix, then show (i) depletion via negative markers or fraction selection, and (ii) consistency across orthogonal methods.
Protein‑to‑Particle Ratio in EV Purity Assessment
Protein-to-particle ratio (often expressed as particles per microgram protein or the inverse) is commonly used as a quick estimate of enrichment. The foundational idea was introduced by Webber & Clayton (2013): if your isolation method removes soluble protein better than it removes nanoparticles, the particle/protein ratio tends to increase.
That said, the ratio is only meaningful when you understand what your "particles" and "protein" measurements actually capture.
Measurement workflow: how to measure protein and particle counts accurately
A defensible workflow documents both measurement methods and their limitations.
Particle counting (NTA/TRPS)
- NTA tracks Brownian motion to estimate particle size and concentration.
- Strength: fast, widely used.
- Caveat: counts any light‑scattering nanoparticles, including lipoproteins and aggregates.
- TRPS measures particle‑by‑particle blockade events through a nanopore.
- Strength: single‑particle measurement with different bias profile.
- Caveat: requires calibration and can be sensitive to pore condition and sample viscosity.
Protein measurement (BCA/microBCA)
- BCA is robust for many buffers.
- microBCA can help when sample mass is limited.
Common protein assay pitfalls include detergent interference, reducing agents, and protein introduced during sample handling (e.g., serum proteins in conditioned media). In EV workflows, the protein fraction you care about is not "total protein in the tube," but "protein that remains after your separation and cleanup choices." That's why documenting sample preparation is part of purity reporting.
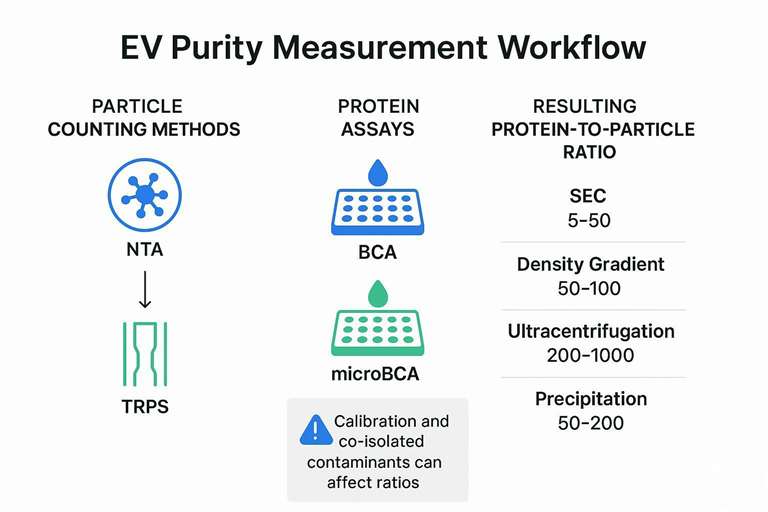
Benchmarks and caveats: ideal ratio ranges for different EV isolation methods
Many teams ask for a single "good" ratio threshold. In practice, protein‑to‑particle ratio is method‑ and matrix‑dependent, and it is also shaped by how aggressively you remove non‑EV particles.
A more useful approach is to treat the ratio as a trend you interpret alongside negative markers and contaminant assays.
| Isolation approach (typical) | What the ratio often reflects | Common failure mode that inflates "particle counts" | What to pair it with |
|---|---|---|---|
| SEC | Removal of soluble protein; partial separation by size | Lipoprotein co‑elution in plasma/serum | ApoA1/ApoB readout + EV marker panel |
| Density gradients | Separation by buoyant density; can reduce certain contaminants | Sample dilution and low recovery; still method-dependent overlap | TEM/cryo‑EM + marker depletion pattern |
| Ultracentrifugation | Pellet enrichment; can concentrate EVs but also co‑pellet proteins | Protein aggregates and co‑pelleting of non‑EV proteins | Negative markers + EM for aggregate/debris |
| Polymer precipitation | High apparent "yield" but often high co‑isolate burden | Polymer carryover and abundant protein co‑precipitation | Strong negative marker panel + cleanup step documentation |
If you are working with plasma, treat any ratio as suspect until you have directly evaluated lipoproteins. If you are working with conditioned media, treat any ratio as suspect until you confirm the impact of serum supplements and the effectiveness of pre‑clearing.
Troubleshooting low ratios: what to do when the ratio is low and how it impacts purity
A low particle/protein ratio can mean "too much protein" or "too few real EV particles"—and these are very different problems.
A practical troubleshooting map:
| Symptom | Likely cause | What to test next | What to change |
|---|---|---|---|
| High protein, modest particles | Incomplete removal of soluble protein; co‑precipitation; insufficient fraction selection | Add negative markers for abundant contaminants (albumin/IgG; Apo markers in plasma) | Improve cleanup (e.g., adjust SEC fraction window; add density step; reduce overload) |
| High particles, low EV markers | Particle count inflated by NVEPs/lipoproteins | Compare NTA with TRPS; check ApoA1/ApoB | Add contaminant discrimination step; do not "optimize" based on NTA alone |
| Low particles and low protein | Over‑stringent cleanup or loss during concentration | TEM to check if vesicles are present; recovery control spike-in if feasible | Reduce handling steps; standardize concentration method; prevent adsorption losses |
Downstream impact is predictable:
- In proteomics, excess soluble protein or lipoproteins can swamp MS signal, reduce depth of EV-associated proteins, and complicate interpretation.
- In functional assays, protein aggregates, cytokines, and apoptotic material can generate activity not attributable to EVs.
Negative Markers in EV Purity Assessment
Negative markers answer a simple question: "What should not be abundant in a clean EV preparation from this matrix?" The goal is not to find a perfect universal panel. It's to choose a panel that reflects your matrix risks and your isolation method's known biases.
Plasma proteins: common contaminants like albumin, IgG, ApoA1/ApoB
In blood-derived EV preparations, the dominant contaminants are often:
- Albumin (high abundance soluble protein)
- Immunoglobulins (IgG) (can co-isolate depending on method)
- Apolipoproteins such as ApoA1 (HDL-associated) and ApoB (LDL/VLDL-associated)
A practical interpretation rule:
- If ApoA1/ApoB signals remain high in your EV fraction, many "particles" may be lipoproteins rather than EVs.
- If albumin/IgG remains high, your prep may be dominated by soluble protein carryover.
Western blot panels are commonly used for this purpose, and a structured verification workflow can help standardize interpretation across projects (for example, WB‑Based Exosome Verification).
Organelle markers: identifying co-isolated organelles
Organelle-associated markers help detect cell breakage, insufficient pre‑clearing, or harsh processing.
Common examples include:
- Calnexin (ER)
- GM130 (Golgi)
- VDAC (mitochondria)
- Histones (nucleus; also common in apoptotic material)
Interpreting these markers is context-sensitive:
- A strong organelle marker signal can indicate co-isolated organle fragments or apoptotic bodies.
- Some nuclear proteins can appear in multiple contexts; combine marker signals with imaging (TEM) and size distribution evidence rather than treating a single band as definitive.
Quantitative depletion targets: how to evaluate depletion of unwanted proteins and contaminants
MISEV2023's spirit is not "show one negative marker band is absent." It's "show that the dominant confounders are controlled." That pushes you toward more quantitative thinking.
Three practical ways to report depletion without overpromising:
- Fraction-based enrichment/depletion trend: show how EV markers peak in earlier fractions while negative markers peak later (common with SEC).
- Relative abundance ratios: compare EV-enriched marker intensity to contaminant marker intensity in the same preparation.
- Proteomics-based enrichment patterns: if you run unbiased proteomics, report enrichment of EV-associated proteins alongside depletion of abundant plasma proteins and apolipoproteins.
If your study includes organle preparations or you need a broader "purity verification" posture across subcellular fractions, an organle-focused verification approach (e.g., Organelle Protein Purity Verification Service) can be conceptually useful for selecting negative marker categories—even when your target is EVs.
Co‑Isolated Contaminants in EV Preparations
Beyond protein carryover, three contaminant classes routinely distort EV purity interpretations: lipoproteins, protein aggregates/NVEPs, and apoptotic bodies.
Lipoproteins: how to detect and separate lipoproteins (ApoA1, ApoB) from EVs
Lipoproteins are the most common confounder in plasma/serum EV work because they are (i) abundant, (ii) nanoscale, and (iii) partially overlapping with EVs in size and density. A particle count alone cannot distinguish them.
The most actionable step is to measure them directly using Apo markers:
- ApoA1 as an HDL-associated indicator
- ApoB as an LDL/VLDL-associated indicator
Then, pair Apo readouts with orthogonal evidence:
- If Apo markers track with particle counts but EV-enriched markers do not, your "EV" fraction likely contains substantial lipoprotein carryover.
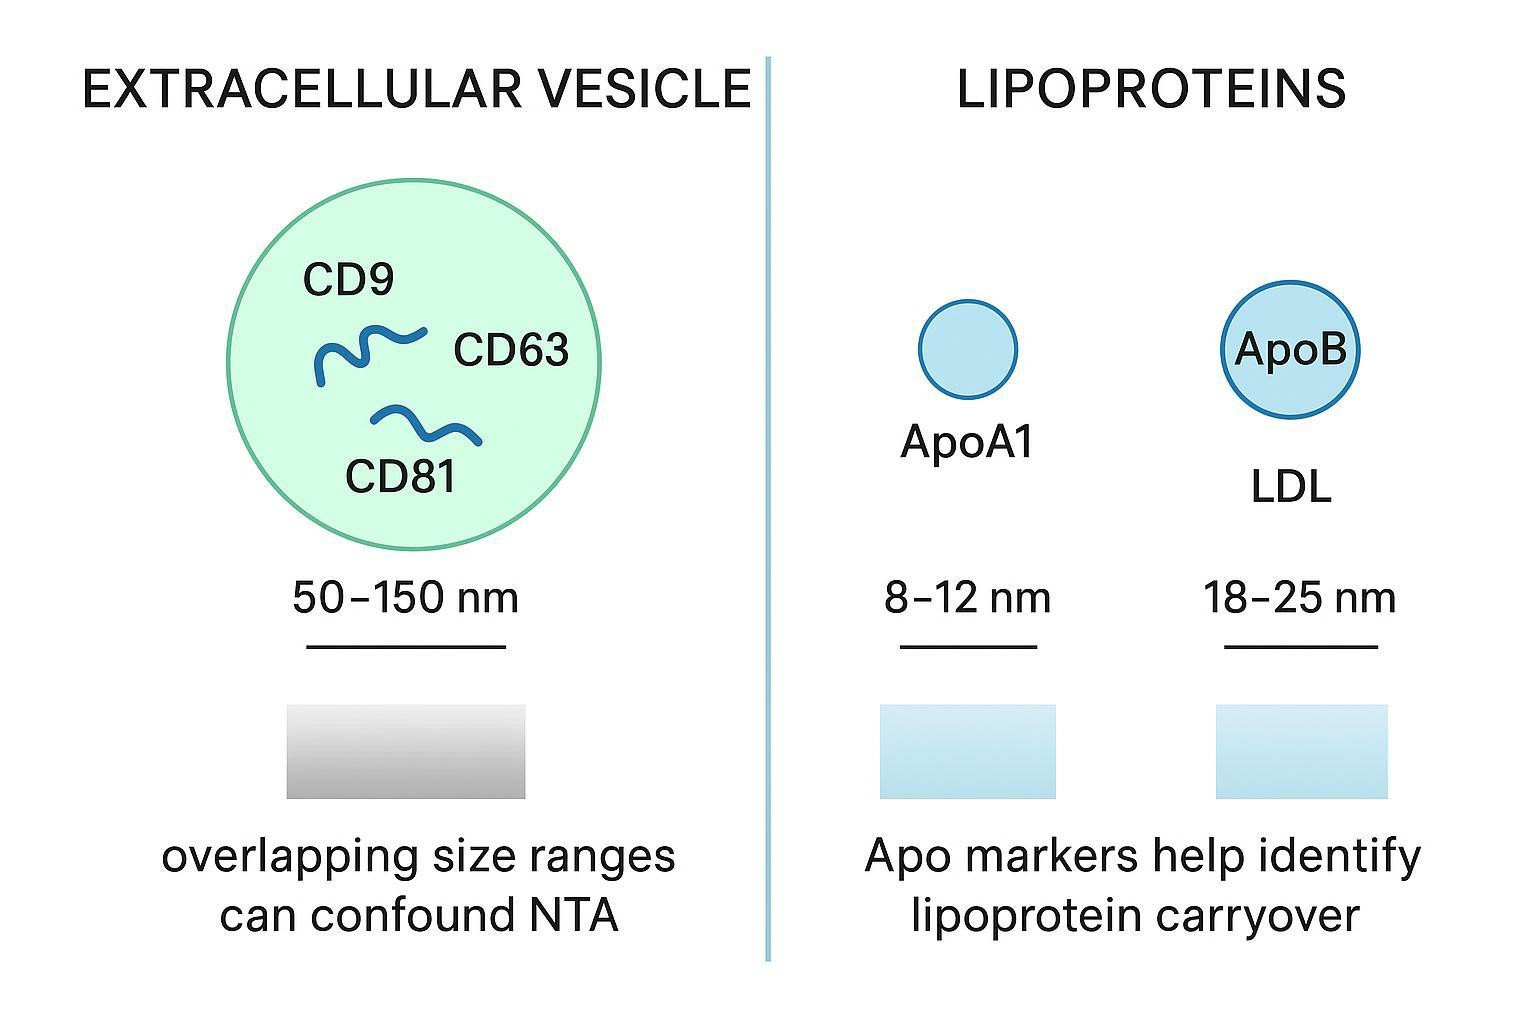
⚠️ Warning: In plasma/serum, overlapping particle size ranges mean NTA can overestimate EV concentration by counting lipoproteins.
Separation strategies vary by lab constraints, but commonly used concepts include:
- Combining size-based separation with a density-oriented step (useful when the matrix is particularly lipoprotein-rich)
- Using fraction selection rules that explicitly penalize ApoA1/ApoB carryover
For example, a SEC + density approach has been used to interrogate the plasma EV proteome with reduced contamination (Karimi et al., 2018).
Protein aggregates and NVEPs: identifying aggregates and non‑EV particles
Aggregates can form during handling (freeze–thaw cycles, over‑concentration, harsh pelleting) or can be present in the original sample. These particles may look "EV-like" to particle counters.
Ways to recognize aggregate/NVEP risk:
- Particle counts rise while EV marker signal does not
- TEM shows irregular dense particles, clumps, or non-membranous material
- Size distribution shifts abruptly after a concentration step
Mitigation is often procedural:
- Avoid harsh concentration steps when possible
- Standardize temperature and handling n- Add an imaging checkpoint (TEM) to confirm morphology when purity is mission-critical
Apoptotic bodies: how to recognize and separate apoptotic bodies
Apoptotic bodies (and related apoptotic material) are larger and can carry nuclear proteins and phosphatidylserine-rich membranes. They can contaminate EV fractions when cell death is high or pre‑clearing is insufficient.
Practical indicators include:
- Elevated histones and other nuclear proteins
- Strong Annexin V binding patterns (context-dependent; not exclusive)
- TEM evidence of larger, heterogeneous vesicular material
A good rule is to treat unexpectedly strong nuclear/ER/mitochondrial markers as a prompt to revisit:
- cell viability and culture conditions (for conditioned media)
- pre‑clear stringency
- whether the isolation method is selecting for heterogeneous vesicle populations
Workflows for EV Purity Assessment
A useful purity workflow is one you can defend in a methods section and reproduce in a core facility SOP. The workflow should match the matrix, isolate class, and downstream assay sensitivity.
Method‑by‑matrix picks: choosing the right purity assessment workflow based on sample type
| Sample matrix | Dominant purity risk | Minimum recommended checks | Extra check when stakes are high |
|---|---|---|---|
| Plasma/serum | Lipoproteins + abundant proteins | NTA/TRPS + EV markers + ApoA1/ApoB + albumin/IgG | TEM + proteomics-based enrichment/depletion pattern |
| Urine | Dilution + variable protein background | Particle count + EV markers + protein assay with buffer controls | TEM for morphology; concentration-loss controls |
| Conditioned media | Serum proteins, debris, apoptosis | Particle count + EV markers + negative organle markers (calnexin/GM130) | TEM; viability documentation; proteomics check |
The logic is simple: purity assessment should explicitly target the most likely confounder for the matrix.
Reporting template: how to report EV purity, including metrics, LOD/LoQ, and controls
Below is a report-friendly template you can adapt. It avoids overclaiming and forces transparency.
| Category | What to report | Example of a defensible statement |
|---|---|---|
| Sample | Matrix, collection/handling, freeze–thaw cycles | "Plasma EVs were isolated from single-thaw aliquots; handling steps were standardized." |
| Particle method | NTA or TRPS model, settings, calibration | "Particle concentration measured by NTA with instrument settings reported; calibration performed per SOP." |
| Protein method | BCA/microBCA and buffer compatibility | "Total protein measured by BCA with buffer controls to assess interference." |
| Ratio | Particle/protein ratio with units | "Reported as particles/µg protein and interpreted alongside negative marker depletion." |
| EV markers | At least one membrane + one cytosolic EV-associated marker | "EV-enriched markers detected in EV fraction with expected enrichment pattern." |
| Negative markers | Matrix-specific contaminants + organle markers as relevant | "ApoA1/ApoB and albumin were evaluated to assess carryover in blood-derived samples." |
| Imaging | TEM/cryo-EM conditions and representative images | "TEM confirmed vesicular morphology and assessed debris/aggregate presence." |
| Controls | Blank, EV-depleted fraction, or process controls | "EV-depleted fractions used as negative controls in functional assays." |
If your downstream work is multi-omics, it's often more efficient to unify these checks into a single validation package rather than treating them as separate ad hoc experiments.
Multi‑omics validation: ensuring EV purity for proteomics, lipidomics, and other analyses
Multi‑omics increases the value of EV studies—but it also increases the cost of contamination.
- Proteomics: abundant plasma proteins and apolipoproteins can dominate signal; marker-based and proteome-wide depletion patterns matter.
- Lipidomics: lipoproteins can strongly bias lipid profiles; Apo marker checks are essential in blood-derived samples.
- Functional assays: co-isolated cytokines, aggregates, or apoptotic material can drive activity; EV-depleted controls and orthogonal purity evidence reduce false positives.
For research teams that want a standardized validation package, Creative Proteomics can support EV-focused downstream profiling and verification (for example, pairing isolation/purification choices with TEM‑Based Exosome Identification and a multi‑omics plan).
Creative Proteomics for advanced EV multi‑omics validation
When you need publishable evidence that connects EV isolation quality to omics readouts, a practical approach is to treat purity assessment as part of the study design rather than a last-minute checkbox.
Depending on your matrix and question, this can include:
- Orthogonal EV identity and purity verification (WB + TEM)
- Method-aware contaminant checks (especially Apo markers for plasma/serum)
- Downstream omics that are interpreted in light of purity metrics
If you're designing a purification strategy for sensitive downstream applications, Exosomes for siRNA Delivery provides a useful overview of isolation and purification options (e.g., size exclusion and affinity approaches) that can be mapped to the purity evidence stack described above.
FAQs
What is a good protein‑to‑particle ratio for extracellular vesicles?
A "good" ratio is one that improves as your preparation becomes more enriched and that is consistent with negative marker depletion in your matrix. Treat the ratio as a comparative metric across methods and batches—not a standalone purity certificate—because particle counting can include lipoproteins/NVEPs and protein assays can be influenced by buffer and carryover.
How do you calculate the protein‑to‑particle ratio for EV purity?
Measure particle concentration (e.g., by NTA or TRPS) and total protein (e.g., by BCA/microBCA) on the same preparation, then report the ratio with clear units (particles/µg protein or µg protein/particle). Always report the measurement methods and instrument/assay conditions so others can interpret comparability.
Which negative markers should I use to assess EV purity?
Use markers that reflect your matrix's dominant confounders: in plasma/serum, include albumin/IgG and ApoA1/ApoB; in conditioned media, include organle-associated markers such as calnexin (ER) or GM130 (Golgi) to detect cell debris and breakage. Pair negative markers with at least one EV-enriched membrane marker and one EV-enriched cytosolic marker so depletion is interpreted in context.
How can I tell whether my "EVs" are actually lipoproteins?
If ApoA1/ApoB signals are high in the same fraction where particle counts peak, lipoprotein carryover is likely, especially in plasma/serum. Confirm with orthogonal methods such as TEM (morphology) and a marker panel; do not rely on NTA particle counts alone when blood-derived samples are involved.
Why do my NTA particle counts look high but EV markers are weak?
This pattern often indicates that your particle counter is detecting non-EV nanoparticles (commonly lipoproteins in plasma/serum or aggregates after concentration). The next step is to add contaminant-specific checks (Apo markers, albumin/IgG) and confirm morphology by TEM; optimization based solely on NTA can move you in the wrong direction.
What is the minimum set of orthogonal methods to report EV purity under MISEV2023?
A practical minimum is one particle enumeration method (NTA/TRPS), one protein-marker method (WB or targeted MS including EV-enriched and negative markers), and one imaging method (TEM/cryo‑EM) to confirm morphology and assess debris/aggregates. Add a contaminant-specific assay when your matrix has a known dominant confounder (e.g., Apo markers for plasma/serum).
References
- Minimal information for studies of extracellular vesicles (MISEV2023): From basic to advanced approaches
- How pure are your vesicles?
- Detailed analysis of the plasma extracellular vesicle proteome after combining size-exclusion chromatography with a density-based separation step
- Density-based lipoprotein depletion improves extracellular vesicle isolation from human plasma
- Comparison of extracellular vesicle isolation processes: evaluating purity and yield
* For Research Use Only. Not for use in diagnostic procedures.