Get Your Custom Quote

Online Inquiry

Ubiquitination Analysis Service

Proteome-wide identification and quantification of ubiquitination sites by diGLY antibody immunoprecipitation and high-resolution LC-MS/MS — mapping thousands of K-ε-GG modified lysines to characterize UPS substrate dynamics, E3 ligase specificity, and PROTAC/molecular glue degrader-induced ubiquitination events at site resolution.

Research Use Only (RUO) Notice: All services and data provided are strictly for non-clinical research purposes. Our analytical results are not intended for clinical diagnosis, patient management, or therapeutic decision-making.

Services Applications Technologies Demo Case Study FAQ Related Services

CORE SERVICE

Global Ubiquitinome Profiling — Site-Level Identification and Quantification of Protein Ubiquitination

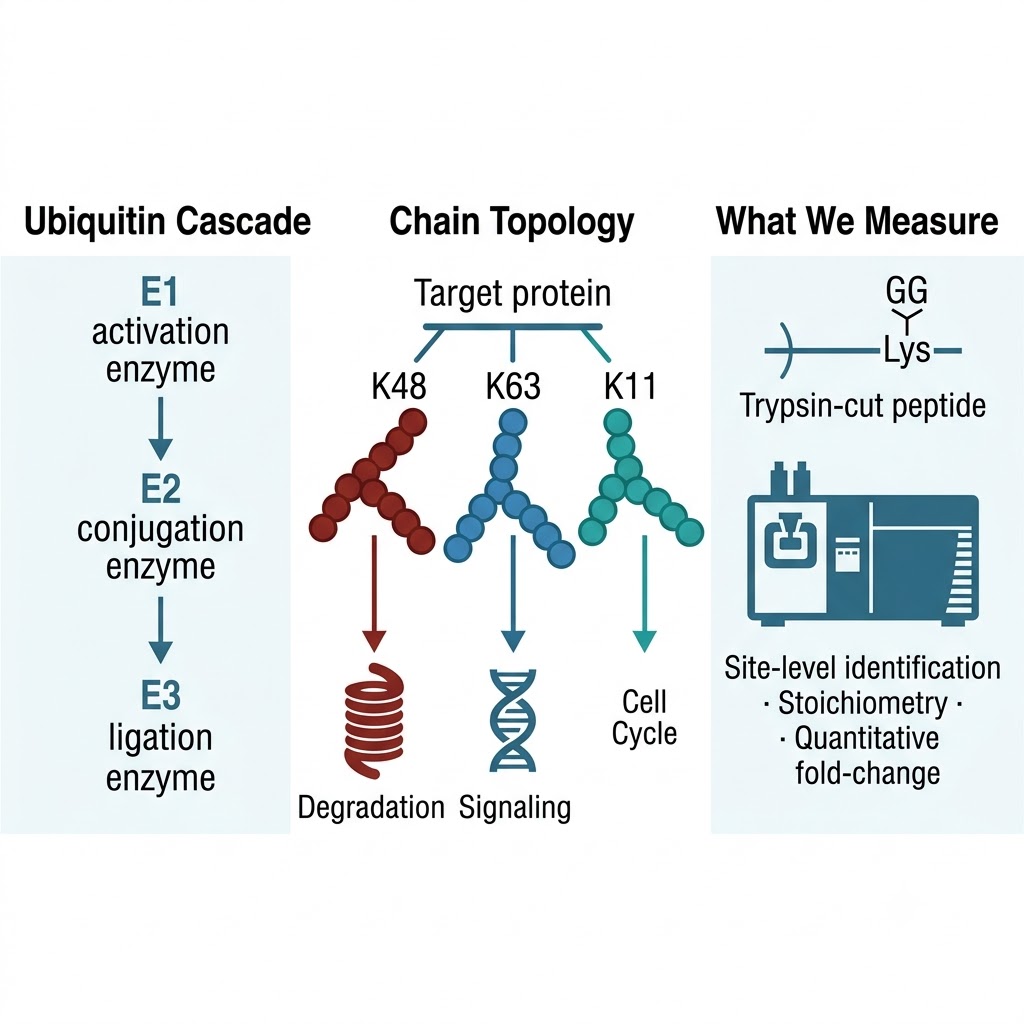
Protein ubiquitination is the master regulatory PTM of the ubiquitin-proteasome system (UPS) — controlling protein half-life, signal transduction, DNA repair, immune response, and virtually every other major cellular process. Unlike phosphorylation, which can be studied with generic kinase inhibitors, ubiquitination is mediated by a three-enzyme cascade (E1 → E2 → E3 ligase) in which the E3 confers substrate specificity. Identifying which proteins are ubiquitinated, on which specific lysine residues, at what stoichiometry, and how these events change in response to perturbations — drugs, gene knockouts, disease states — requires mass spectrometry-based ubiquitinome profiling at proteome scale.

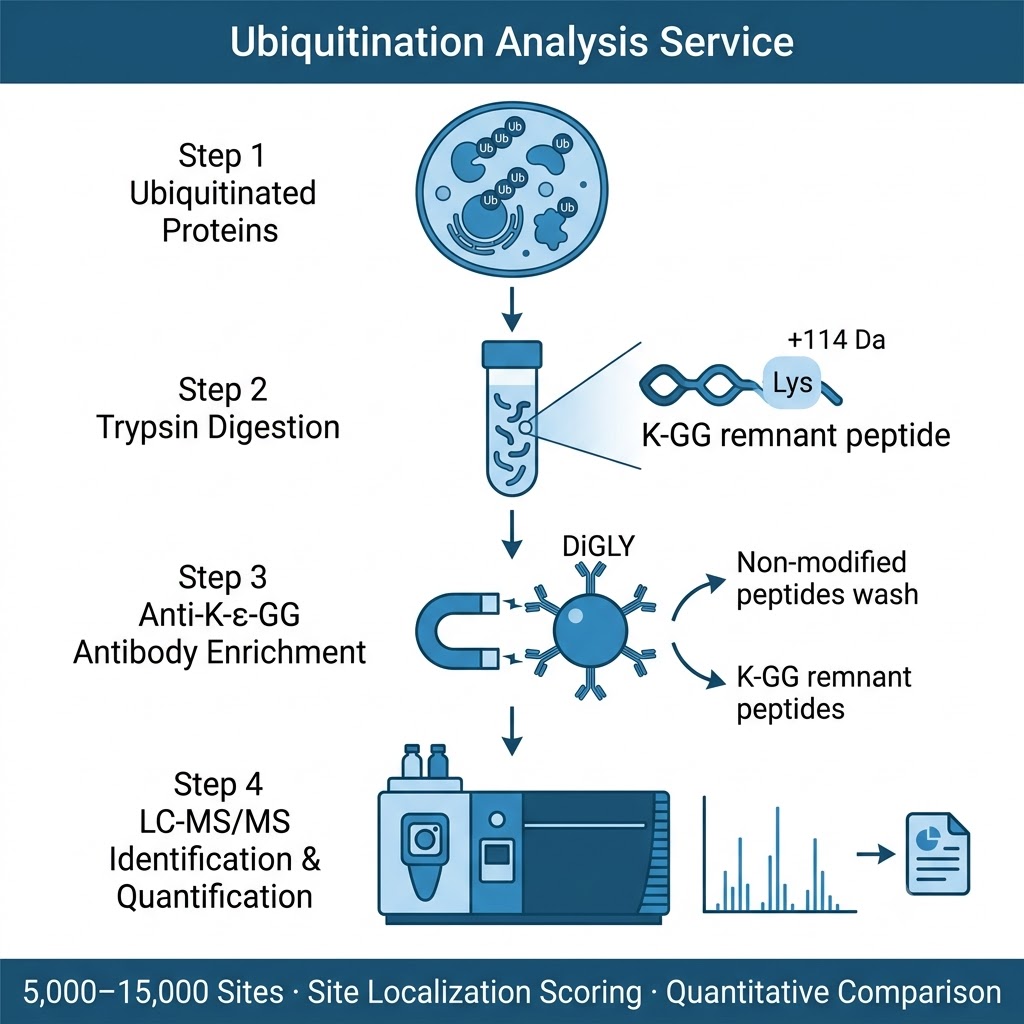
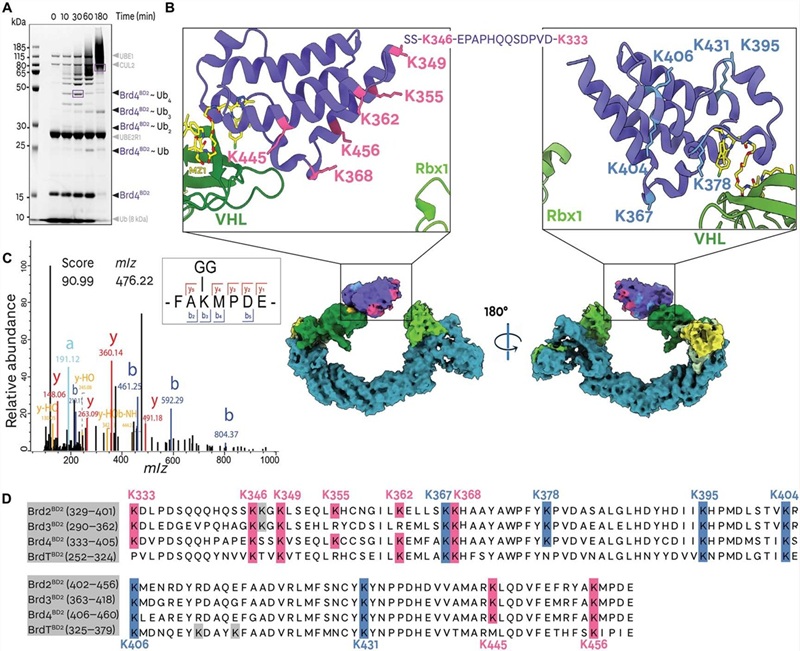
Our Ubiquitination Analysis Service uses the diGLY antibody immunoaffinity enrichment approach: after trypsin digestion, ubiquitinated proteins generate characteristic K-ε-Gly-Gly (diGLY) remnant-modified peptides that are specifically captured by a validated anti-diGLY monoclonal antibody (PTMScan K-ε-GG kit, Cell Signaling Technology), then analyzed by high-resolution LC-MS/MS. This approach identifies endogenous ubiquitination events without requiring expression of tagged ubiquitin, covers the full ubiquitinome in a single experiment, and can be coupled with quantitative strategies — SILAC, label-free, or TMT — to deliver fold-change and statistical significance data for every regulated site between conditions.

  • Deep ubiquitinome coverage: Starting from ≥10 mg total protein per sample, our standard workflow identifies 5,000–15,000 unique ubiquitination sites across 2,000–5,000 proteins per experiment, with site localization probability scores ≥0.75 reported for all confident assignments. For PROTAC/degrader studies requiring focused analysis of a single target protein, lower input and shorter timelines are available.
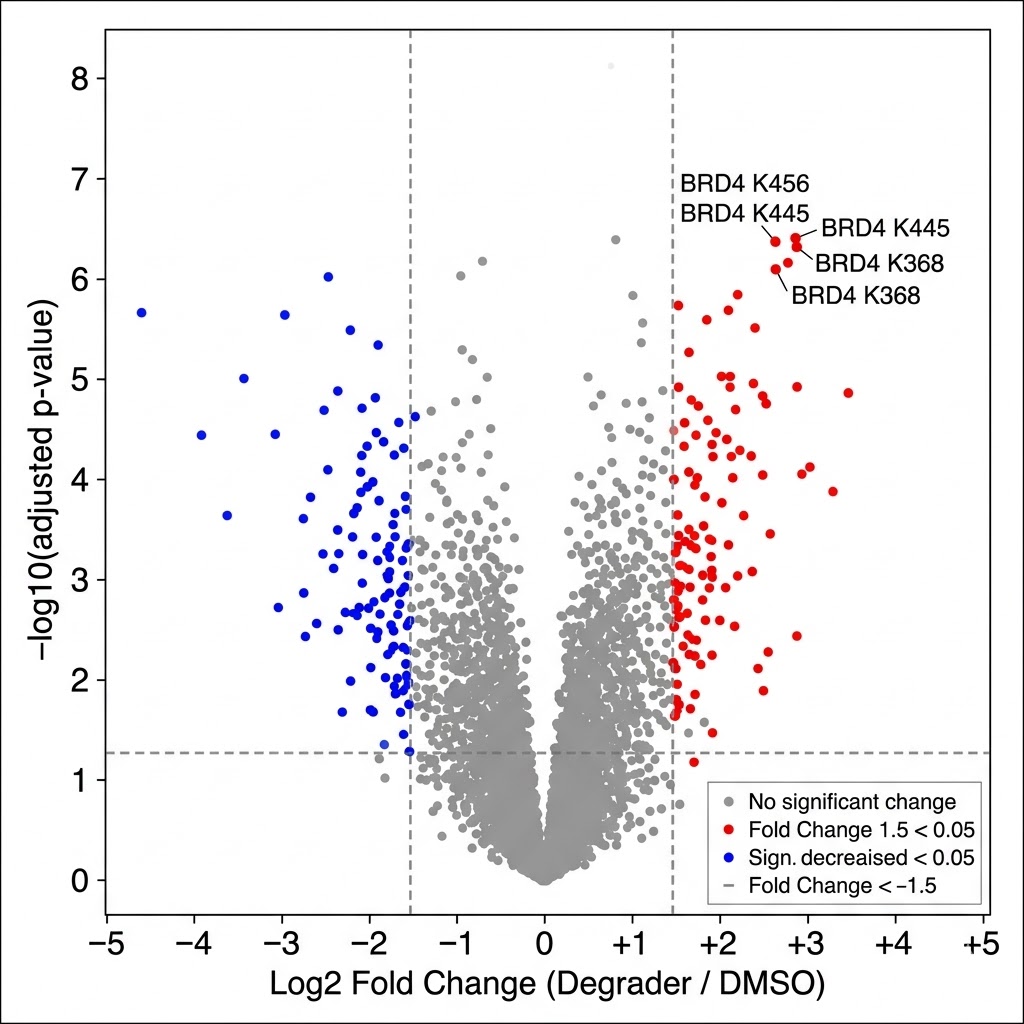
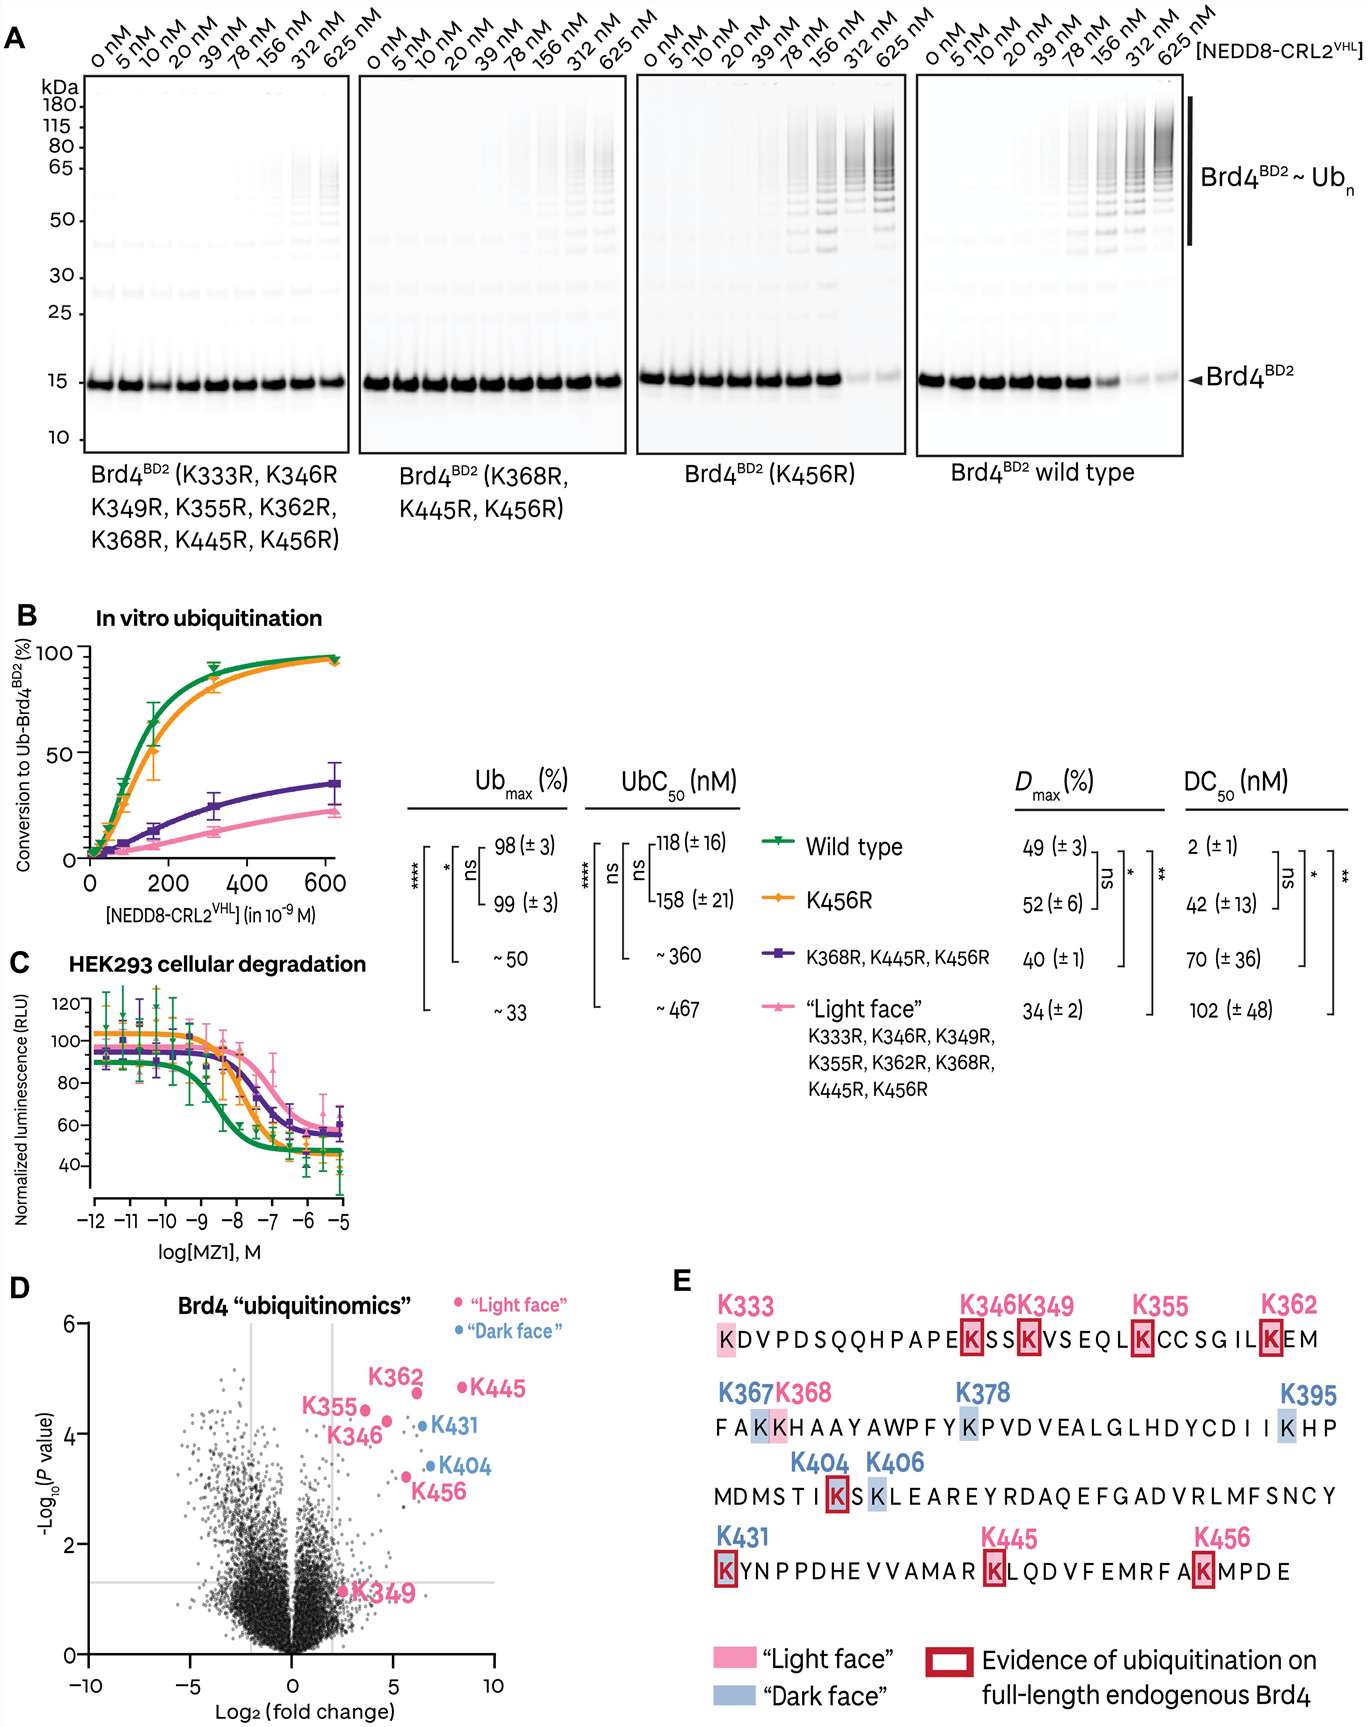
  • Quantitative comparison across conditions: We apply SILAC pulse-labeling, label-free (MaxLFQ), or TMT multiplexing to generate site-level fold-change data between treated and control cells — identifying which ubiquitination events are gained, lost, or unchanged in response to proteasome inhibition, E3 ligase modulation, or small-molecule degrader treatment.
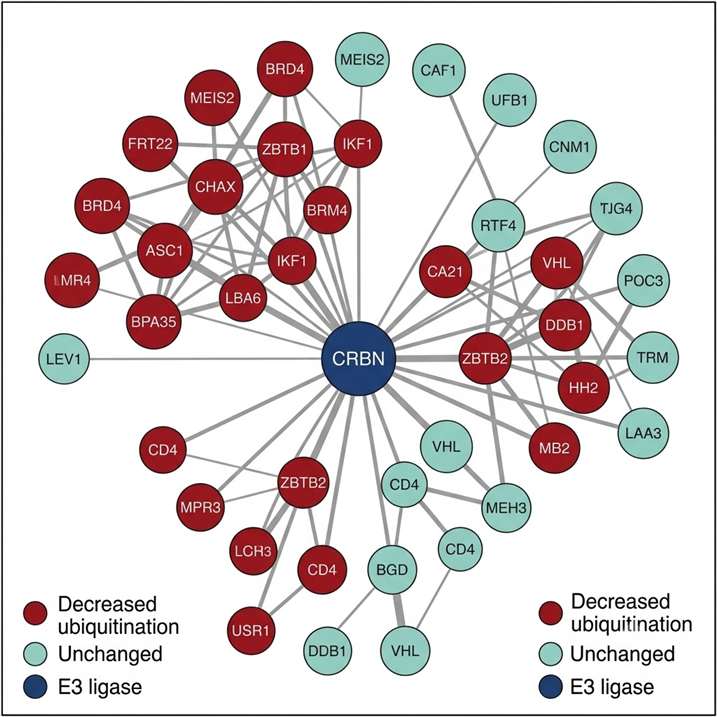
  • Integrated UPS pathway annotation: Identified and regulated sites are cross-referenced against PhosphoSitePlus, UbiNet, and human protein interaction databases to annotate known E3 ligase-substrate relationships, ubiquitin chain topology (K48 vs. K63 linkage context), and downstream pathway connections — converting a site list into an interpretable UPS regulatory map.
Ubiquitination analysis service overview — diGLY antibody enrichment workflow for proteome-wide ubiquitinome profiling by LC-MS/MS

diGLY remnant enrichment + high-resolution MS/MS: the gold standard for proteome-wide ubiquitination site mapping

Ubiquitination Biology and the Case for Proteome-Wide Site Mapping

Ubiquitin is a 76-amino-acid protein conjugated via an isopeptide bond to the ε-amino group of target lysine residues through an E1-E2-E3 enzyme cascade. The outcome of ubiquitination depends entirely on chain topology: K48-linked polyubiquitin chains route substrates to the 26S proteasome for degradation; K63-linked chains coordinate DNA damage signaling, endosomal sorting, and NF-κB activation; monoubiquitination regulates histone function, receptor internalization, and protein-protein interactions. A single protein can carry multiple ubiquitin chains of different linkages on different lysines simultaneously, creating a combinatorial "ubiquitin code" that directs that protein to specific fates. Decoding this code at the proteome level requires mass spectrometry — no antibody panel, no IP-western, no reporter assay can capture the full scope of ubiquitination across thousands of substrates in a single experiment.

The diGLY remnant approach exploits a biochemical signature unique to ubiquitinated proteins: trypsin cleaves ubiquitin at its C-terminal Arg-Gly-Gly sequence, leaving a two-glycine (diGLY) tag covalently attached to the modified lysine of the substrate peptide. This 114.04 Da mass addition is detectable by MS/MS and, critically, immunoprecipitable by a monoclonal antibody that recognizes the K-ε-GG epitope with high specificity. The approach is now the standard for global ubiquitinome profiling in academic and industry drug discovery settings, having been used to identify over 20,000 distinct ubiquitination sites in human cells and to map substrate dynamics for individual E3 ligases, PROTAC degraders, and molecular glues.

Key Research Applications

Our Ubiquitination Analysis Service supports the following research use cases — each requiring a different experimental design; contact us to discuss which configuration best fits your project.

Ubiquitin-proteasome system UPS pathway — E1 E2 E3 cascade K48 K63 chain topology substrate degradation

PROTAC & Molecular Glue Degrader Characterization

Targeted protein degradation (TPD) compounds — PROTACs, molecular glues, and bifunctional degraders — work by hijacking an E3 ligase to ubiquitinate a neo-substrate protein of interest (POI), routing it to the proteasome. Ubiquitinome profiling by diGLY proteomics is the most direct way to confirm that your degrader is inducing ubiquitination of the intended target, to map the exact lysine residues that carry ubiquitin (the "ubiquitination zone"), to distinguish on-target from off-target ubiquitination events at proteome scale, and to compare degrader-induced site patterns across structural analogs. Our Targeted Protein Degradation Proteomics Service builds diGLY profiling into a complete degrader characterization workflow, combining total proteomics with ubiquitinomics in the same matched sample set.

E3 Ligase Substrate Discovery

Identifying the physiological substrates of a specific E3 ligase — or determining which E3 ligase is responsible for ubiquitinating a protein of interest — is one of the most challenging questions in ubiquitin biology. We support E3 substrate discovery using genetic perturbation-coupled diGLY proteomics: cells with inducible knockdown, knockout, or overexpression of the E3 of interest are processed for ubiquitinome profiling, and regulated sites are ranked by fold-change as candidate direct substrates. This approach scales to both dominant E3 ligases (CRBN, VHL, MDM2, TRIM21) and understudied E3s, providing a systems-level substrate landscape rather than testing one candidate at a time. Results integrate with protein interaction data (co-IP, BioID) to prioritize direct from indirect substrate effects.

Proteasome Inhibitor & UPS Perturbation Studies

Treatment with proteasome inhibitors (MG-132, bortezomib, carfilzomib) or deubiquitinase (DUB) inhibitors causes rapid, proteome-wide changes in ubiquitination site occupancy that can be quantified by diGLY proteomics with high temporal resolution. These data reveal which proteins are constitutive proteasome substrates, how quickly the ubiquitinome re-equilibrates after proteasome re-activation, and which DUBs control basal ubiquitination at specific sites. For drug mechanism studies, comparing ubiquitinomes before and at multiple time points after drug treatment provides a dynamic picture of UPS activity that total proteomics cannot capture because protein levels change more slowly than ubiquitination status.

Disease Proteome & Cancer Biology

Dysregulation of ubiquitination machinery is a hallmark of cancer, neurodegeneration, and inflammatory disease. Comparative ubiquitinomics between disease and normal cell states, or between drug-sensitive and drug-resistant cell lines, identifies pathologically altered ubiquitination patterns — substrates with gained or lost ubiquitination that correlate with disease phenotypes. These datasets nominate E3 ligases and DUBs as potential therapeutic targets and provide mechanistic context for altered protein stability observed in total proteomics experiments. Projects integrating ubiquitinomics with phosphoproteomics or TMT quantitative proteomics in matched samples provide a systems-level view of pathway dysregulation.

Phosphodegron & PTM Crosstalk Analysis

Many proteins are ubiquitinated only after prior phosphorylation at a nearby phosphodegron sequence — a serine or threonine residue whose phosphorylation creates a recognition motif for an E3 ligase substrate receptor (e.g., β-TrCP, Fbxw7). Integrating diGLY ubiquitinomics with phosphoproteomics from the same sample set — our Meta-PTMomics Analysis Service — identifies proteins with co-regulated ubiquitination and phosphorylation, pinpointing candidate phosphodegron-driven degradation events. This analysis is particularly relevant for studying CDK-dependent degradation, DNA damage response pathways, and cell cycle checkpoint signaling.

Histone Ubiquitination & Chromatin Regulation

Monoubiquitination of histone H2A (H2AK119ub1, mediated by PRC1) and H2B (H2BK120ub1, mediated by RNF20/RNF40) are key epigenetic marks regulating gene silencing and transcriptional elongation. diGLY proteomics detects these marks at the peptide level when combined with acid extraction of histones and dedicated short-gradient LC methods optimized for histone peptides. Quantitative histone ubiquitination profiling across conditions — differentiation, drug treatment, developmental stages — provides direct evidence of epigenetic regulatory changes without requiring ChIP-based approaches.

Technology Platform & Workflow

diGLY Antibody Immunoaffinity Enrichment

The K-ε-GG diGLY remnant is generated specifically from ubiquitinated proteins (not NEDD8 or ISG15, which share the C-terminal GG but have different flanking sequences detectable in MS/MS spectra). We use the validated PTMScan Ubiquitin Remnant Motif (K-ε-GG) antibody conjugate (Cell Signaling Technology, cat. #5562) at the peptide level, after trypsin digestion and C18 desalting, following the optimized protocol with protein-A agarose pre-clearing to minimize non-specific binding. Enrichment efficiency is monitored by spike-in of a synthetic K-GG peptide standard, and enrichment specificity (percentage of diGLY-modified peptides in the eluate) is reported as a QC metric. Starting input: typically 10–20 mg total protein per sample for deep global ubiquitinomics; 1–5 mg for focused target protein analysis in PROTAC/degrader projects.

LC-MS/MS Acquisition & Site Localization

Enriched diGLY peptides are analyzed by nanoflow UHPLC (75 μm × 50 cm C18, 90 min gradient) coupled to Thermo Orbitrap Fusion Lumos or Q Exactive HF-X operating in data-dependent acquisition (DDA) mode. MS1 resolution: 60,000–120,000 FWHM; MS2 resolution: 30,000–60,000 FWHM; HCD fragmentation at 27–30% NCE. The 114.04 Da diGLY mass addition on lysine residues is specified as a variable modification in the database search. Site localization is scored using ptmRS or phosphoRS algorithms within Proteome Discoverer; sites with localization probability ≥0.75 are reported as confidently assigned. For projects requiring high peptide coverage of a specific target protein (e.g., a PROTAC neo-substrate), EThcD fragmentation is available for improved peptide backbone coverage on large or missed-cleavage diGLY peptides.

Quantification Strategies

We apply three quantification strategies depending on experimental design and sample constraints. SILAC (stable isotope labeling by amino acids in cell culture) is our gold standard for head-to-head comparisons in dividing cells — heavy/light peptide pairs are quantified with very low ratio noise in the same MS1 scan. Label-free quantification (MaxLFQ intensity) is used for primary cells, patient-derived samples, or any sample where metabolic labeling is not feasible — with up to 12 samples per project; we recommend ≥3 biological replicates per condition. TMT multiplexing (up to 16-plex) enables high-throughput multi-condition comparisons in a single LC-MS/MS run, reducing batch effects when comparing multiple time points or drug concentrations. All quantification strategies deliver site-level log2 fold-change values, standard error, and adjusted p-values (Benjamini-Hochberg) for every detected diGLY site.

Standard Ubiquitination Analysis Workflow

Step 1 — Cell Lysis & Protein Extraction: Cells are lysed under denaturing conditions (8 M urea lysis buffer) supplemented with 20 mM N-ethylmaleimide (NEM) to alkylate free cysteines and irreversibly block deubiquitinase (DUB) activity, preserving in vivo ubiquitination status at the moment of lysis. Protease inhibitors (PMSF + protease inhibitor cocktail) are included. Protein concentration is measured by BCA; samples with inter-replicate CV >10% in protein yield are flagged before proceeding.

Step 2 — Reduction, Alkylation & Trypsin Digestion: Proteins are reduced with DTT (10 mM, 30 min, 37 °C) and alkylated with chloroacetamide (25 mM, 30 min, RT, dark) to cap free cysteines. Urea concentration is diluted to ≤2 M before addition of sequencing-grade trypsin (1:50 enzyme:protein ratio, 18 h, 37 °C). Digestion completeness is assessed by measuring missed cleavage rate; samples with >20% missed cleavages are re-processed.

Step 3 — C18 Desalting & Optional TMT Labeling: Digested peptides are acidified (1% TFA), desalted over SepPak C18 cartridges, and lyophilized. For TMT projects, labeling is performed at this stage (TMT10/16 reagent, 1:4 peptide:TMT ratio, 1 h, RT), followed by quenching, pooling of labeled samples, and a second C18 desalting step before immunoprecipitation. For SILAC projects, heavy and light cell lysates are mixed at 1:1 ratio by protein mass before digestion.

Step 4 — diGLY Immunoaffinity Enrichment: Lyophilized peptides are reconstituted in IAP buffer (50 mM MOPS pH 7.2, 10 mM sodium phosphate, 50 mM NaCl) and incubated with anti-K-ε-GG antibody beads at 4 °C for 2 h with end-over-end mixing. Non-specifically bound peptides are removed by three IAP washes and two PBS washes. Enriched diGLY peptides are eluted with 0.15% TFA, desalted over stage tips (C18 StageTips), and dried under vacuum for LC-MS/MS analysis. A pre-enrichment aliquot (2%) is retained for total proteome analysis.

Step 5 — LC-MS/MS Acquisition & Data Analysis: Dried peptides are reconstituted in 0.1% formic acid / 2% acetonitrile and analyzed by nanoflow LC-MS/MS. Database searches are performed against species-specific UniProt databases with trypsin specificity, diGLY (+114.04 Da, Lys) and carbamidomethyl (Cys) as modifications, FDR ≤1% at peptide and protein level. Quantitative analysis in MaxQuant or Proteome Discoverer generates a site-level intensity matrix. Statistical analysis (t-test or limma), volcano plots, and UPS pathway annotation are delivered as part of the standard report package.

Sample Requirements

Sample Type Recommended Protein Input Critical Pre-Processing Requirements
Cultured cells (global ubiquitinomics) 10–20 mg total protein (≥5 × 10⁷ cells) Add 20 mM NEM to lysis buffer immediately before use; process on ice; snap-freeze pellet or lyse immediately — do not allow cells to sit at room temperature after media removal
Cultured cells (PROTAC/degrader target mapping) 1–5 mg total protein (≥5 × 10⁶ cells) Treat cells with degrader at defined concentration and time point; add NEM to lysis buffer; submit as frozen pellets or pre-extracted protein on dry ice
Tissue (mouse, rat, human biopsy) ≥50 mg fresh frozen tissue Snap-freeze within 60 s of excision; store at −80 °C; ship on dry ice; no formalin-fixed tissue for ubiquitinomics (FFPE cross-linking disrupts diGLY epitope)
Pre-extracted protein lysate ≥10 mg at ≥2 μg/μL in urea or RIPA buffer Must include NEM (20 mM) at time of lysis; provide buffer composition; avoid SDS >1% without pre-treatment; measure protein concentration before submission
SILAC-labeled cells ≥5 mg each (heavy + light), mixed 1:1 by protein mass Confirm ≥97% labeling efficiency before shipping; mix heavy and light lysates before trypsin digestion; include NEM at lysis; ship pre-mixed as single sample on dry ice

Critical note: NEM must be added to lysis buffer immediately before use. Pre-made lysis buffers without NEM will result in rapid DUB activity and loss of ubiquitination signal during sample preparation — this is the single most common source of failed ubiquitinomics experiments. We provide a detailed sample collection protocol specific to your experimental setup upon project inquiry.

Representative Ubiquitinomics Data

The following illustrate the quantitative outputs generated by our standard diGLY ubiquitinomics workflows — volcano plots, site-level heatmaps, and E3 substrate network visualizations typical of project deliverables.

diGLY ubiquitinomics volcano plot — regulated ubiquitination sites in PROTAC-treated vs DMSO control cells, K-GG remnant profiling

Fig. 1 — Volcano plot of diGLY-quantified ubiquitination sites in degrader-treated vs. DMSO control HEK293 cells. Each point represents a unique K-ε-GG modified peptide; color indicates significance (padj ≤0.05, |FC| ≥1.5). Increased ubiquitination of POI and off-target proteins are identifiable at site resolution. Horizontal and vertical dashed lines denote statistical and fold-change thresholds.

Ubiquitinome heatmap — quantitative diGLY site dynamics across time points after proteasome inhibitor treatment, SILAC ubiquitinomics

Fig. 2 — Hierarchical clustering heatmap of SILAC-quantified diGLY site log2 ratios across three time points after proteasome inhibitor treatment. Each row = one ubiquitination site; columns = time points with biological replicates. Clusters reflect distinct substrate dynamics — rapidly accumulating proteasome targets vs. stable monoubiquitinated proteins.

E3 ligase substrate network from diGLY proteomics — UBE2D3 E3 substrates protein interaction visualization, ubiquitin chain annotation

Fig. 3 — E3 ligase substrate network visualization from diGLY proteomics following E3 knockdown. Proteins with significantly decreased ubiquitination upon E3 depletion (candidate direct substrates, blue) are shown as nodes; edges represent known protein-protein interactions from STRING. Node size proportional to number of regulated ubiquitination sites; color intensity encodes fold-change magnitude.

CASE STUDY

Cellular diGLY Ubiquitinomics Maps the PROTAC-Induced Ubiquitination Zone on Brd4 and Reveals Lysine-Level Selectivity of VHL-Recruiting Degrader MZ1

Crowe C, Nakasone MA, Chandler S et al., Science Advances Vol.10, Issue 41, October 2024 — DOI: 10.1126/sciadv.ado6492

Background & Purpose

PROTAC degraders work by recruiting a target protein (the "neo-substrate") to an E3 ubiquitin ligase via a bifunctional molecule, inducing targeted ubiquitination and subsequent proteasomal degradation. Despite extensive study of ternary complex formation and degradation potency, the precise molecular mechanisms controlling which lysine residues on the neo-substrate are ubiquitinated — and whether specific "ubiquitinable" lysine positions are required for productive degradation — remained poorly understood. Crowe et al. at the Ciulli laboratory (Centre for Targeted Protein Degradation, University of Dundee) set out to combine structural biology, in vitro biochemistry, and cellular diGLY ubiquitinomics to define the ubiquitination mechanism of the well-characterized BET degrader MZ1, which selectively degrades Brd4 over the closely related Brd2 and Brd3 proteins.

Methods

The study proceeded through three complementary experimental layers. First, cryo-EM structural analysis of the complete Brd4BD2-MZ1-(NEDD8)-CRL2VHL-UBE2R1-Ub complex was performed to visualize how MZ1 orients Brd4BD2 relative to the catalytic E2 ubiquitin-conjugating enzyme UBE2R1, revealing which lysine residues are positioned closest to the catalytic cysteine of UBE2R1. Second, in vitro ubiquitination reactions using recombinant Brd4BD2, MZ1, CRL2VHL, and UBE2R1 were analyzed by gel-based MS to map which lysines on Brd4BD2 could be ubiquitinated in the reconstituted system. Third, and most relevant to our service, cellular diGLY ubiquitinomics was performed in MZ1-treated HEK293 cells to confirm in vivo ubiquitination of the identified sites under endogenous conditions. Following 1 μM MZ1 treatment, cells were lysed with NEM-containing buffer, proteins were digested with trypsin, and diGLY-modified peptides were enriched with anti-K-ε-GG antibody immunoprecipitation. A total of 25,843 ubiquitinated precursors corresponding to 5,117 proteins were identified, with quantitative comparison to DMSO-treated controls.

Results Overview

The integrated structural, biochemical, and ubiquitinomics dataset identified a spatial "ubiquitination zone" on the light face of Brd4BD2 — a patch of surface-exposed lysine residues positioned toward the UBE2R1 catalytic site in the cryo-EM model. Cellular diGLY ubiquitinomics confirmed increased ubiquitination at six of eight light-face lysines in MZ1-treated cells, including the primary site K456 (which was also the highest-scoring site in the in vitro system) and nearby K368 and K445. Dark-face lysines showed negligible ubiquitination in both in vitro and cellular experiments. The study further demonstrated that CRL2 has some flexibility in capturing suboptimal lysines when the preferred K456 is mutated, explaining the resilience of MZ1-induced degradation to single lysine mutations — a mechanistic insight directly relevant to resistance mechanism analysis in TPD drug development. The cellular ubiquitinomics data were presented as a volcano plot of 25,843 ubiquitinated precursors, with MZ1-elevated Brd4 light-face lysines highlighted against the proteome-wide background.

Cryo-EM structure of Brd4BD2 MZ1 CRL2VHL UBE2R1 ternary complex — PROTAC ubiquitination mechanism Figure 1 Crowe et al 2024

Fig. 1 from Crowe et al. 2024 — Cryo-EM reconstruction of the complete Brd4BD2-MZ1-CRL2VHL-UBE2R1 complex, showing how the PROTAC MZ1 orients the Brd4 neo-substrate toward the E2 ubiquitin-conjugating enzyme. Source: doi.org/10.1126/sciadv.ado6492 (CC BY 4.0)

In vitro ubiquitination MS map of Brd4BD2 lysines — light face vs dark face ubiquitination zone cryo-EM Figure 2 Crowe 2024

Fig. 2 from Crowe et al. 2024 — Cryo-EM volume of Brd4BD2 with lysines colored by in vitro ubiquitination MS evidence (pink = ubiquitinated light-face Lys; blue = unmodified dark-face Lys), identifying the spatial "ubiquitination zone." Source: doi.org/10.1126/sciadv.ado6492 (CC BY 4.0)

Cellular ubiquitinomics volcano plot 25843 sites MZ1 PROTAC treated HEK293 cells Brd4 K456 K445 highlighted Figure 5 Crowe 2024

Fig. 5 from Crowe et al. 2024 — Cellular diGLY ubiquitinomics volcano plot from MZ1-treated HEK293 cells (25,843 precursors, 5,117 proteins). Brd4 light-face lysines with elevated ubiquitination are highlighted, confirming in vivo relevance of the ubiquitination zone defined by cryo-EM and in vitro MS. Source: doi.org/10.1126/sciadv.ado6492 (CC BY 4.0)

Conclusion & Relevance to Our Service

This study is a definitive demonstration of how cellular diGLY ubiquitinomics — applied at proteome scale with quantitative comparison to controls — can confirm, localize, and contextualize the ubiquitination events induced by a targeted protein degrader. The ability to identify 25,843 ubiquitinated precursors from a single experiment, and to pinpoint which specific lysines on a target protein carry increased ubiquitin in degrader-treated cells, is exactly what our Ubiquitination Analysis Service provides for your PROTAC, molecular glue, or degrader research program. This type of data directly informs degrader optimization — identifying the "ubiquitination zone" determines which lysine mutations would be expected to confer resistance, enabling structure-guided PROTAC linker design and selectivity profiling. Our Targeted Protein Degradation Proteomics Service integrates diGLY ubiquitinomics with total proteome analysis in matched sample sets to provide the complete degrader characterization package.

Frequently Asked Questions

Q1: Why is NEM (N-ethylmaleimide) required in the lysis buffer, and what happens if it is omitted?

NEM is a cysteine-reactive alkylating agent that irreversibly inhibits deubiquitinase (DUB) enzymes, which require an active-site cysteine for catalysis. DUBs begin removing ubiquitin chains from substrates within seconds of cell lysis if not inhibited — meaning that the ubiquitination state you measure reflects post-lysis DUB activity rather than the true in vivo state. Experiments omitting NEM from the lysis buffer consistently show 50–80% lower ubiquitinome depth and specifically lose rapidly cycling ubiquitination events (short half-life ubiquitin chains on proteasome substrates). This is the single most common cause of failed or low-yield ubiquitinomics experiments. We provide a complete, protocol-specific sample collection guide that includes NEM concentration, lysis buffer composition, and handling temperature requirements when you initiate a project — please request this before collecting samples.

Q2: How do I use diGLY ubiquitinomics to study my PROTAC or molecular glue degrader?

The experimental design for degrader characterization by diGLY proteomics typically follows a paired total proteomics + ubiquitinomics approach. Cells are treated with the degrader at a defined concentration and time point (typically 1–4 h, before significant protein level changes occur — earlier time points capture the initial ubiquitination wave before proteasomal degradation depletes the target), alongside a DMSO vehicle control. Matching aliquots from the same cell pellet are processed for (1) total proteomics (DIA or TMT) to confirm target protein degradation and identify indirect proteomic changes, and (2) diGLY ubiquitinomics to identify which proteins gain ubiquitination (direct degrader targets and collateral effects) and which specific lysine residues are modified on the POI. This design answers three questions simultaneously: Is the target being degraded? Which lysines on the target are ubiquitinated? Are any off-target proteins also ubiquitinated? Our Targeted Protein Degradation Proteomics Service provides this integrated workflow as a complete project package.

Q3: How many ubiquitination sites can I expect to identify, and how does this compare to SILAC vs. label-free quantification?

From 10–20 mg total protein input (≥5 × 10⁷ cultured cells), our standard workflow identifies 5,000–15,000 unique K-ε-GG sites across 2,000–5,000 proteins per sample in DDA single-shot mode, consistent with published benchmarks for the diGLY approach. Quantitative performance differs between strategies: SILAC provides the lowest ratio noise for two-condition comparisons in dividing cell lines (CV typically 10–15% at site level across replicates) but requires 5–7 days of labeling before the experiment and is not applicable to primary cells or tissue. Label-free quantification with MaxLFQ intensity is most flexible — applicable to any sample type — but requires ≥3 biological replicates per condition and larger starting input to achieve comparable depth. TMT multiplexing provides the highest throughput (up to 16 conditions in one run) with excellent inter-condition normalization, making it our recommendation for time-course experiments or multi-drug concentration comparisons. We advise on the optimal strategy when you describe your experimental design.

Q4: Can you distinguish ubiquitin from NEDD8 or ISG15 modifications by diGLY profiling?

The diGLY remnant antibody enriches peptides modified by any protein ending in -GGK at the trypsin cleavage site — which includes ubiquitin (LRGG↓ cleavage, leaving GG on substrate Lys), but also NEDD8 (ends in LRGG) and ISG15 (ends in LRGG). However, the vast majority of diGLY sites identified in standard enrichments originate from ubiquitin: NEDD8 conjugation is restricted to cullins and a small number of non-cullin substrates, and ISG15 conjugation is present at appreciable levels only in interferon-stimulated cells. In standard experiments with non-stimulated cell lines, contamination from NEDD8 and ISG15 represents typically <2% of identified sites. If your experiment involves cullin neddylation (e.g., MLN4924 treatment) or interferon stimulation, we can apply MLN4924 pre-treatment controls or ISG15 database filtering to separate ubiquitin from NEDD8 signal. For unambiguous ubiquitin-chain linkage topology (K48 vs. K63 vs. K11), we offer a complementary middle-down or intact ubiquitin chain analysis upon request.

Q5: What bioinformatics deliverables are included, and can you integrate ubiquitinomics with total proteomics from the same samples?

Standard deliverables for every ubiquitinomics project include: raw LC-MS/MS data files; diGLY peptide identification table with sequence, modified residue, localization score, and charge state; site-level quantification matrix (normalized intensity or SILAC ratio for every site across all replicates); differential regulation results (log2 fold-change, p-value, adjusted p-value) with volcano plot; hierarchical clustering heatmap of significantly regulated sites; GO and KEGG pathway enrichment of proteins with regulated ubiquitination; UPS annotation (known E3 substrates, proteasome subunit annotation, DUB substrates from PhosphoSitePlus and UbiNet); and a project report with methods text and key findings. When total proteomics data are generated from the same cell lysate (either as part of a degrader project or independently), we perform integrated analysis — comparing protein-level abundance changes with site-level ubiquitination changes to identify cases where ubiquitination precedes protein degradation (early ubiquitination without proteome change) or where ubiquitination is non-degradative (ubiquitination without protein depletion). This integration is a core output of our Targeted Protein Degradation Proteomics Service.

References

  1. Crowe C, Nakasone MA, Chandler S, et al. Mechanism of degrader-targeted protein ubiquitinability. Sci Adv. 2024;10(41):eado6492. doi.org/10.1126/sciadv.ado6492
  2. Kim W, Bennett EJ, Huttlin EL, et al. Systematic and quantitative assessment of the ubiquitin-modified proteome. Mol Cell. 2011;44(2):325-340. doi.org/10.1016/j.molcel.2011.08.025
  3. Akimov V, Barrio-Hernandez I, Hansen SVF, et al. UbiSite approach for comprehensive mapping of lysine and N-terminal ubiquitination sites. Nat Struct Mol Biol. 2018;25(7):631-640. doi.org/10.1038/s41594-018-0084-y
  4. Yau R, Rape M. The increasing complexity of the ubiquitin code. Nat Cell Biol. 2016;18(6):579-586. doi.org/10.1038/ncb3358

GET STARTED

Design Your Ubiquitinomics Project Today

Tell us your biological question — E3 substrate discovery, PROTAC characterization, proteasome perturbation, or disease ubiquitinome profiling — your sample type, number of conditions, and desired quantification strategy. We will recommend the optimal diGLY workflow, provide expected coverage metrics, and outline timeline and deliverables in a detailed project proposal.

From global ubiquitinome profiling to PROTAC-specific lysine site mapping — all under one project.

Request a Customized Quote