Get Your Custom Quote

Online Inquiry

PTM & Signaling Proteomics Analysis Services

Site-resolved identification, quantification, and functional interpretation of protein post-translational modifications — from global PTM profiling to modification-specific enrichment workflows covering phosphorylation, glycosylation, ubiquitination, acetylation, and 15+ additional modification types, all on high-resolution LC-MS/MS platforms with integrated signaling pathway analysis.

Research Use Only (RUO) Notice: All services and data provided are strictly for non-clinical research purposes. Our analytical results are not intended for clinical diagnosis, patient management, or therapeutic decision-making.

Services Technologies Demo Case Study FAQ Related Services

CORE SERVICE

Full-Spectrum PTM & Signaling Proteomics — from Site Identification to Quantitative Pathway Analysis

Post-translational modifications are the molecular switches that control protein activity, localization, stability, and interaction at every level of cellular signaling. A single phosphorylation event can activate or silence an entire kinase cascade; ubiquitination determines whether a protein is degraded or re-routed; glycosylation governs cell-surface recognition and secretory trafficking; acetylation at histones reconfigures chromatin state and gene programs. To study these mechanisms with the resolution, quantitative precision, and throughput demanded by modern drug discovery and mechanistic research, mass spectrometry-based PTM proteomics is the definitive analytical approach — and the quality of the enrichment chemistry, the instrument platform, and the data analysis pipeline determines everything about what you can and cannot detect.

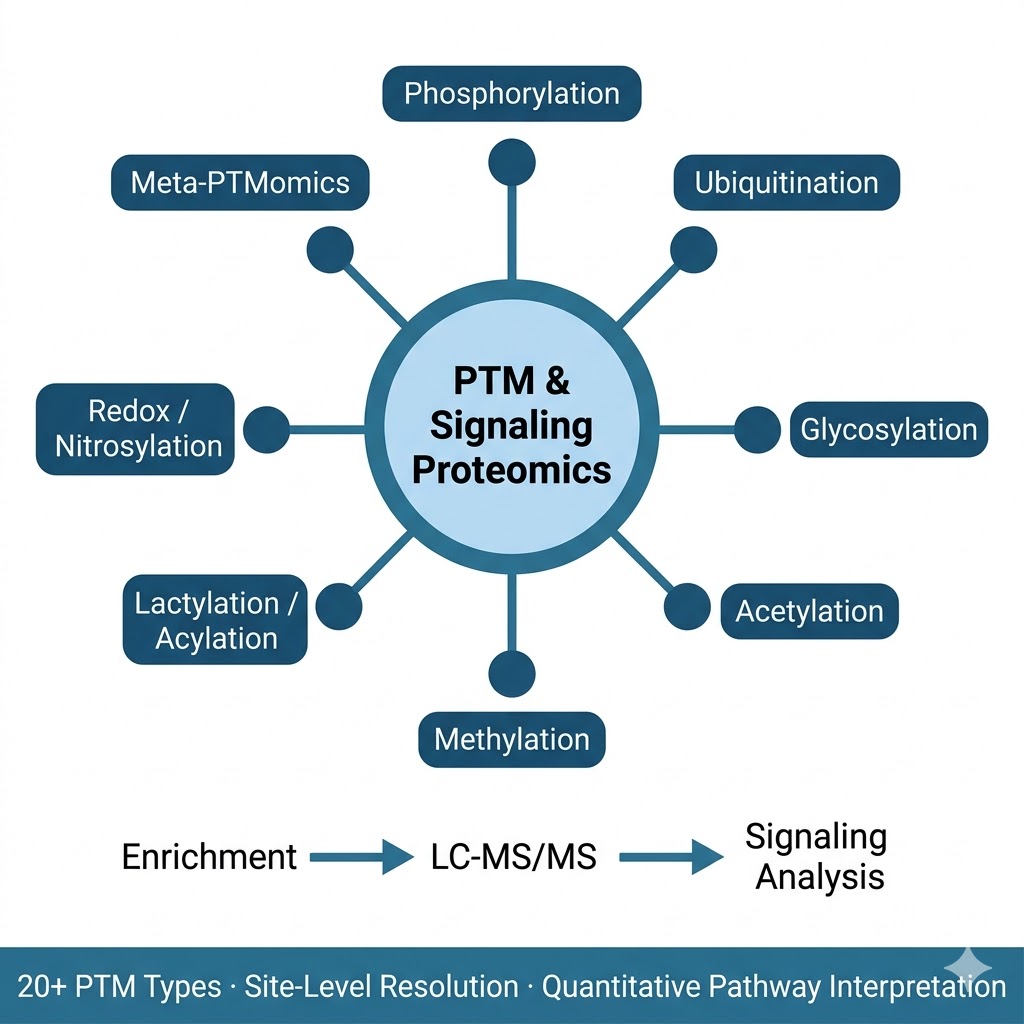
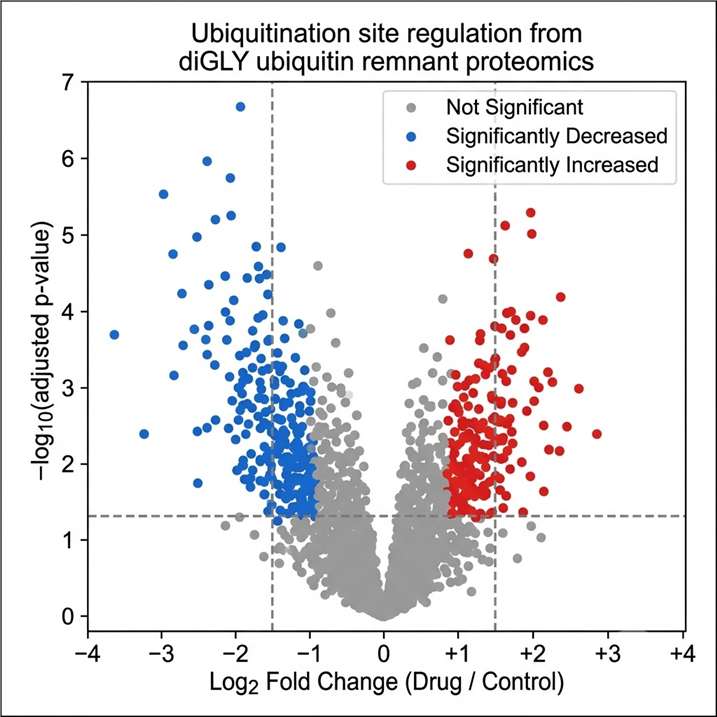
We provide the broadest PTM proteomics service portfolio available from a single CRO, covering more than 20 modification types across qualitative identification, site mapping, quantitative profiling, and integrative multi-PTM analysis. Our workflows combine modification-specific enrichment (IMAC/TiO2 for phospho, lectin affinity or HILIC for glyco, diGLY immunoprecipitation for ubiquitin remnants, antibody-based enrichment for acetyl and acyl marks) with high-resolution mass spectrometry on the Bruker timsTOF Pro, Thermo Orbitrap Fusion Lumos, and Q Exactive HF-X, and a dedicated PTM bioinformatics pipeline covering site localization scoring, stoichiometry calculation, kinase-substrate network inference, and pathway-level signaling analysis.

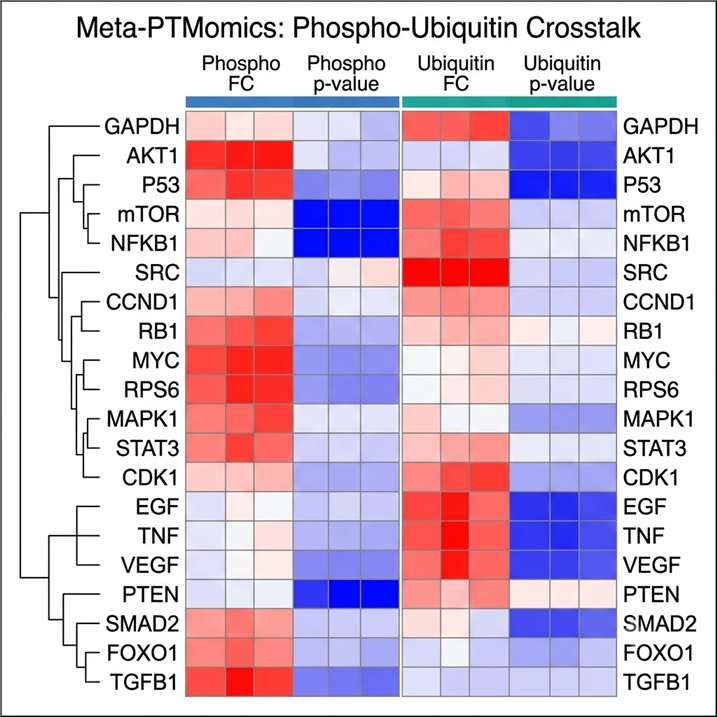
  • Site-level resolution across 20+ PTM types: We cover the full range of biologically relevant modifications from the most studied (phosphorylation, N- and O-glycosylation, ubiquitination/diGLY) to the emerging (lactylation, crotonylation, succinylation, SUMOylation, nitrosylation, lipidation, disulfide bond mapping, and Meta-PTMomics integrative analysis), each with dedicated enrichment and detection protocols.
  • Quantitative PTM analysis: Every profiling service can be extended to quantitative mode using label-free, TMT, or SILAC strategies, providing modification-site-level abundance ratios between conditions, stoichiometry estimates, and differential regulation statistics — not just presence/absence information.
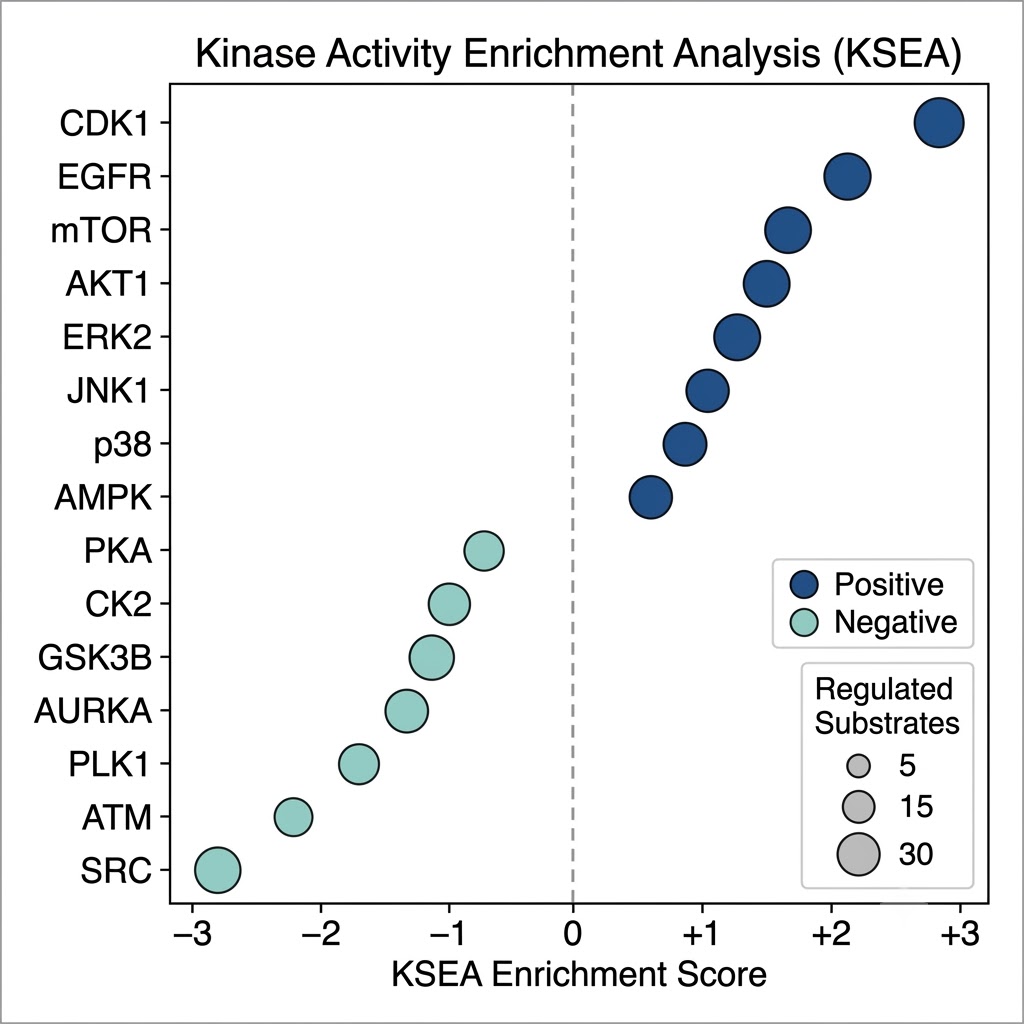
  • Signaling pathway context: PTM data without functional context is a list of sites. Our bioinformatics pipeline connects identified and regulated modification sites to kinase-substrate databases (PhosphoSitePlus, NetworKIN), E3 ligase-substrate networks, glycan structure databases, and KEGG/Reactome signaling pathways, converting a raw modification inventory into an interpretable map of active signaling.
PTM and signaling proteomics service overview — phosphorylation, ubiquitination, glycosylation, acetylation LC-MS/MS workflows

PTM & Signaling Proteomics: from enrichment chemistry to signaling network interpretation

PTM & Signaling Sub-Services Directory

All sub-services are offered as standalone projects or as part of integrated multi-PTM workflows. Each card links to the dedicated service page with full workflow details, sample requirements, and deliverables.

General PTM Analysis

PTM Qualitative Analysis Service

Unbiased identification and characterization of modification types and modified peptides. Ideal for novel PTM discovery or initial site mapping in unstudied proteins, organisms, or sample matrices — without requiring a quantitative comparison between conditions.

PTM Sites Identification Service

Precise assignment of modification positions on specific proteins or complexes, with site localization probability scores (phosphoRS, AScore, ptmRS) to confidently distinguish true modification sites from ambiguous assignments at the residue level.

PTM Profiling Analysis Service

Proteome-scale qualitative PTM profiling to catalog the full modification landscape of a biological sample, including co-occurring modifications on shared substrates and candidate PTM crosstalk pairs for downstream functional analysis.

Quantitative & Core Signaling PTMs

PTM Quantitative Analysis Service

Site-level relative quantification of modification occupancy between conditions using label-free, TMT, or SILAC strategies. Delivers fold-change calculations, statistical significance testing, and differential site lists with full bioinformatics annotation.

Phosphorylation Analysis Service

Global phosphoproteomics using IMAC or TiO2 enrichment on Ser, Thr, and Tyr residues — identifying 10,000–50,000+ phosphosites per project. Includes kinase-substrate enrichment analysis (KSEA) and signaling pathway network interpretation.

Ubiquitination Analysis Service

Proteome-wide ubiquitination mapping via diGLY antibody immunoprecipitation of K-ε-GG remnant peptides. Quantifies substrate dynamics under proteasome inhibition, E3 ligase perturbation, or PROTAC/molecular glue degrader treatment.

Glycosylation Analysis

Glycosylation Analysis Service

Comprehensive glycosylation profiling covering both N- and O-linked modifications — intact glycopeptide detection, glycan structure characterization, and site assignment for recombinant glycoproteins, secreted proteins, and complex biological matrices.

N-Glycosylation Analysis Service

Site-specific N-glycan profiling using PNGase F enzymatic release, HILIC or lectin affinity enrichment, and high-resolution MS/MS for glycan composition, linkage, and site assignment on Asn-X-Ser/Thr sequons.

O-Glycosylation Analysis Service

O-GalNAc and O-GlcNAc site mapping using chemoenzymatic labeling, lectin enrichment, or EThcD fragmentation to preserve labile O-linked glycans during MS/MS, with applications in mucin biology, nuclear signaling (O-GlcNAc), and secretory pathway research.

Acylation & Histone Modification Panel

Acetylation Analysis Service

N-terminal and lysine acetylation mapping using pan-acetyl-lysine antibody enrichment. Covers histone epigenetic marks, metabolic enzyme activity regulation, and protein half-life control — with quantitative stoichiometry measurement available across conditions.

Acylation Analysis Service

Detection and site mapping of diverse short-chain acyl marks including propionylation, butyrylation, and 2-hydroxyisobutyrylation using antibody-based enrichment or chemical derivatization coupled to high-resolution LC-MS/MS.

Lactylation Analysis Service

Quantitative profiling of L-lactylation on histone and non-histone proteins — a modification linked to the Warburg effect and metabolic-epigenetic crosstalk. Detected using anti-lactyllysine antibody enrichment with MS/MS validation.

Crotonylation Analysis Service

Site-resolved mapping of lysine crotonylation — an active transcription-associated epigenetic acyl mark — using anti-crotonyllysine antibody enrichment and detection on Orbitrap or timsTOF platforms with high mass accuracy.

Succinylation Analysis Service

Proteome-wide succinylation profiling using anti-succinyllysine antibody enrichment. Key applications include mitochondrial metabolism research, TCA cycle enzyme regulation, and SIRT5 desuccinylase substrate discovery.

Methylation Analysis Service

Detection of mono-, di-, and tri-methylation at lysine and arginine residues using antibody-based enrichment or heavy methyl-SILAC. Covers chromatin biology, RNA-binding protein regulation, and protein-protein interaction modulation via methyl-reader domains.

Redox, Cysteine & Lipid Modifications

Nitrosylation Analysis Service

Site-level mapping of S-nitrosylation (SNO) using the biotin-switch technique or resin-assisted capture (RAC) coupled to LC-MS/MS. Identifies redox-sensitive cysteine residues regulated by nitric oxide signaling in cardiovascular, neurological, and inflammatory contexts.

Disulfide Bond Analysis Service

Non-reducing LC-MS/MS analysis for disulfide bond mapping in recombinant proteins, monoclonal antibodies, and complex biological samples — providing paired Cys residue identification, disulfide connectivity maps, and free vs. bonded cysteine quantification.

Lipidation Analysis Service

Detection and site assignment of protein lipid modifications including S-palmitoylation (acyl-RAC or ABE), N-myristoylation, prenylation (farnesyl and geranylgeranyl), and GPI anchor analysis by LC-MS/MS for membrane biology and trafficking research.

Redox Proteomics Service

Quantitative proteome-wide mapping of cysteine redox states — reduced, oxidized, sulfenic, sulfinic, S-glutathionylated, and S-nitrosylated — using differential alkylation strategies. Applications include oxidative stress biology, ROS signaling, and covalent drug target profiling.

SUMOylation Analysis Service

Identification and quantification of SUMO-modified proteins and acceptor sites using SUMO-His-tagged expression or SUMO-motif antibody enrichment. Key applications: nuclear transport, DNA damage response, and transcription factor activity regulation.

Meta-PTMomics Analysis Service

Integrative multi-PTM analysis applying two or more enrichment workflows to the same digest — enabling crosstalk analysis between modification types. Supported combinations include phospho + ubiquitin, phospho + acetyl, phospho + ubiquitin + acetyl, and full acyl mark panels (acetyl + crotonyl + succinyl + lactyl).

PTM Proteomics Technology Platform

Enrichment Chemistry

PTM detection by LC-MS/MS is only possible when the modified peptide population is concentrated from a complex background where unmodified peptides are present in vast molar excess. Our enrichment platform covers all established chemistries: IMAC (Fe3+ or Ti4+) and TiO2 for phosphopeptides; diGLY (K-ε-GG) antibody immunoprecipitation for ubiquitin remnants; HILIC and lectin affinity (ConA, WGA, PHA-L) for glycopeptides; pan-acetyl-lysine, pan-acyl-lysine, and modification-specific antibodies (anti-crotonyl, anti-lactyl, anti-succinyl, anti-methyl) for histone and metabolic acyl marks; acyl-RAC and biotin-switch for S-nitrosylation; and ABE/acyl-RAC for palmitoylation. Multi-step sequential enrichment from a single digest is available for Meta-PTMomics projects requiring simultaneous profiling of two or more modification types.

Instrument Platforms & Fragmentation

Modified peptides present unique detection challenges: phosphopeptides are prone to neutral loss under CID; O-glycans are labile; disulfide-linked peptides require non-reducing conditions. We match instrument and fragmentation mode to the modification. Orbitrap Fusion Lumos with EThcD (electron transfer/higher-energy collision dissociation) is our primary platform for phosphorylation site localization, O-glycopeptides, and any modification where backbone fragmentation is needed to preserve the PTM signal. Q Exactive HF-X provides deep coverage for large-scale phospho and ubiquitin profiling. The Bruker timsTOF Pro adds ion mobility separation to separate co-eluting modified and unmodified peptide species, improving site localization confidence and quantitative accuracy in complex enriched samples. For histone modifications, dedicated short-gradient micro-LC methods optimized for histone peptides are employed.

PTM Bioinformatics Pipeline

Site assignment and functional annotation are as critical as the MS data itself. Our PTM bioinformatics pipeline uses MaxQuant or Proteome Discoverer for database searching with PTM-specific variable modifications; phosphoRS, ptmRS, or AScore for site localization probability scoring (≥0.75 threshold for confident site assignment); and in-house R scripts for differential PTM analysis, including site-level fold-change calculation, volcano plots, and clustering. For signaling interpretation, regulated phosphosites are mapped to kinase-substrate databases (PhosphoSitePlus, NetworKIN, KSEA) to infer kinase activity changes. Ubiquitination data is analyzed against E3 ligase substrate networks. For multi-PTM projects, crosstalk analysis between modification sites on shared proteins is performed and visualized. All deliverables include a publication-ready methods section describing enrichment, MS acquisition, and data analysis parameters.

Standard PTM Proteomics Workflow

Step 1 — Sample Receipt & Protein Extraction: Samples are received and assessed for protein quantity and integrity. Cell pellets, tissues, biofluids, or pre-extracted protein lysates are accepted. Species-appropriate protein extraction buffers are used; for histone modifications, acid extraction is applied. For quantitative TMT workflows, protein amounts are normalized across conditions before digestion.

Step 2 — Tryptic Digestion: Proteins are denatured, reduced (DTT), alkylated (IAA), and digested with trypsin (or Lys-C/trypsin combination for longer peptides). For histone modifications, propionylation derivatization is performed pre- and post-digestion to improve peptide recovery and HPLC separation. Digest quality is assessed by BCA and optional LC-UV before enrichment.

Step 3 — PTM Enrichment: The modification-appropriate enrichment method is applied (see Technology section). For phosphoproteomics: two-step sequential IMAC + TiO2 or Mag-Net IMAC for comprehensive phosphopeptide capture. For ubiquitinomics: diGLY antibody IP at 4 °C with validated anti-K-ε-GG resin. For glycoproteomics: HILIC-SPE for global N-glycopeptides or specific lectin affinity for targeted glycan class enrichment. Enrichment efficiency is monitored by LC-MS/MS on a small pre-enrichment aliquot.

Step 4 — LC-MS/MS Data Acquisition: Enriched peptides are analyzed by nanoflow UHPLC coupled to the appropriate MS platform. DDA with HCD or EThcD fragmentation is the standard mode for site-level PTM identification. DIA-based phosphoproteomics is available for large cohorts requiring high quantitative reproducibility. Acquisition parameters — isolation window, fill time, scan range — are optimized per modification type.

Step 5 — Data Analysis & Reporting: Database searches with appropriate variable modifications (phospho, GlyGly, acetyl, etc.), site localization scoring, differential analysis, and signaling pathway interpretation. Deliverables include: raw data files, modified peptide identification tables with localization scores, site-level quantification matrices, differential regulation results, kinase activity analysis (phospho) or substrate network analysis (ubiquitin), GO/KEGG/Reactome pathway enrichment, and a comprehensive project report with publication-ready methods text.

Sample Requirements

Sample Type Recommended Input (Phospho / Ubiquitin / Acyl) Notes
Cell pellet ≥5 × 10⁶ cells (phospho); ≥1 × 10⁷ cells (ubiquitin diGLY) Lyse immediately on ice; add phosphatase inhibitors (PhosSTOP) and protease inhibitors; snap-freeze; ship on dry ice. For ubiquitin: add NEM (N-ethylmaleimide) at 20 mM to block deubiquitinases
Tissue ≥30 mg (phospho); ≥50 mg (ubiquitin); ≥20 mg (acyl marks) Snap-freeze within 30 s of collection; store at −80 °C; ship on dry ice. FFPE tissue accepted for phosphoproteomics with adjusted protocol (10 × 10 μm sections minimum)
Plasma / Serum ≥200 μL (phospho biomarker; depleted); ≥500 μL (glyco) Collect with phosphatase inhibitors; centrifuge and aliquot immediately; store at −80 °C; avoid repeated freeze-thaw cycles
Pre-extracted protein ≥200 μg at ≥1 μg/μL (phospho); ≥500 μg (ubiquitin diGLY) Include phosphatase and protease inhibitors; provide buffer composition; avoid high SDS or urea >2 M before submission
Recombinant protein / antibody ≥10 μg (disulfide mapping); ≥50 μg (glycosylation site mapping) Submit in non-reducing buffer for disulfide analysis; specify expected modification sites if known
Histone / chromatin prep ≥50 μg histone protein Acid-extracted histones preferred; whole-cell lysates accepted with derivatization protocol adjustment

Input requirements vary by specific modification and depth of profiling required. Contact us with your sample type and experimental question for confirmed requirements before collection and shipment.

Representative PTM Proteomics Data

The following illustrate the type of quantitative and functional outputs generated by our phosphoproteomics, ubiquitinomics, and glycoproteomics workflows. These data types are standard deliverables in modification-specific profiling projects.

Phosphoproteomics kinase substrate network — regulated phosphosites mapped to active kinases, KSEA kinase activity enrichment analysis

Fig. 1 — Kinase activity inference from phosphoproteomics data. Regulated phosphosites are mapped to upstream kinases via kinase-substrate enrichment analysis (KSEA). Bubble size reflects number of regulated substrates per kinase; color encodes enrichment z-score. Identifies activated vs. suppressed kinases from site-level abundance data.

Ubiquitinomics diGLY volcano plot — differentially ubiquitinated sites between drug-treated and control cells, K-GG remnant proteomics

Fig. 2 — Volcano plot of ubiquitination site regulation in drug-treated versus control cells (diGLY ubiquitin remnant proteomics). Each point represents a unique K-ε-GG modified peptide; significantly up- and down-regulated ubiquitination events are highlighted. Annotates proteasome-dependent and -independent substrate dynamics.

Meta-PTMomics crosstalk heatmap — co-regulated phosphorylation and ubiquitination sites on shared substrate proteins, multi-PTM network

Fig. 3 — Meta-PTMomics crosstalk heatmap from integrated phospho + ubiquitin profiling. Proteins with co-regulated sites in both modification datasets are shown; rows = modification sites, columns = experimental conditions. Highlights substrates where phosphorylation and ubiquitination are coordinately regulated — typical candidates for phosphodegron-mediated proteasomal targeting.

CASE STUDY

Phosphoproteomics-Guided Low-Dose Drug Combinations Demonstrate Superior Efficacy Against Pancreatic Ductal Adenocarcinoma

de Goeij-de Haas RR et al., Cell Reports 42, 112581, June 2023 — DOI: 10.1016/j.celrep.2023.112581

Background & Purpose

Pancreatic ductal adenocarcinoma (PDAC) is one of the most lethal solid tumors, characterized by a limited set of driver mutations but high cancer cell heterogeneity that makes single-agent targeted therapy ineffective. Because protein-level driver mutations are difficult to target directly, the authors asked whether the downstream consequences of those mutations — captured as aberrant kinase activity in the phosphoproteome — could be used to identify rational combination drug strategies. Specifically, they aimed to build a phosphoproteomics-driven framework for selecting low-dose kinase inhibitor combinations targeting the most hyperactive signaling nodes in each PDAC cell line, and to test whether these combinations outperformed high-dose single-agent approaches in preclinical models.

Methods

The study analyzed nine PDAC cell lines — seven ATCC-derived immortalized lines and two primary xenograft-derived cultures — using a two-step sequential phosphopeptide enrichment protocol (IMAC followed by TiO2) combined with total proteome analysis by LC-MS/MS. The resulting phosphoproteome comprised more than 20,000 phosphosites on 5,763 phosphoproteins, including 316 protein kinases. Kinase activity was inferred from the phosphorylation state of known kinase substrates using integrative inferred kinase activity (INKA) scoring, which combines information from direct kinase autophosphorylation sites and downstream substrate phosphorylation to rank kinase activity across the cell line panel. Based on INKA output, the three most activated kinases per cell line were matched to clinical-stage kinase inhibitors. Drugs were tested as individual agents and as three-drug INKA-tailored combinations at low doses in cell viability assays, 3D organoid cultures, and patient-derived xenograft (PDX) models in vivo.

Results Overview

The comprehensive phosphoproteome revealed highly heterogeneous kinase activity landscapes across the nine PDAC lines, consistent with the clinical observation that PDAC does not respond uniformly to any single targeted agent. INKA scoring successfully identified line-specific hyperactive kinases including members of the EGFR, MET, FGFR, and CDK families. INKA-tailored low-dose three-drug combinations demonstrated markedly superior growth inhibition compared with high-dose single-agent treatments — with particularly pronounced efficacy against the aggressive mesenchymal PDAC subtype. Efficacy translated from 2D cell viability assays through to 3D organoid cultures and PDX models, supporting the translatability of phosphoproteomics-guided treatment selection. These results established a proof-of-concept framework in which global phosphoproteomics, applied in a non-clinical research context, can systematically inform rational combination drug selection for heterogeneous tumors.

Phosphoproteomics workflow and INKA kinase activity scoring in PDAC cell lines — Figure 1 de Goeij-de Haas et al 2023

Fig. 1 from de Goeij-de Haas et al. 2023 — Phosphoproteomic workflow and INKA kinase activity scoring pipeline applied across nine PDAC cell lines. Source: doi.org/10.1016/j.celrep.2023.112581 (CC BY 4.0)

INKA kinase activity heatmap across PDAC cell lines — phosphoproteomics guided kinase inhibitor selection Figure 2

Fig. 2 from de Goeij-de Haas et al. 2023 — INKA kinase activity scores across nine PDAC cell lines revealing heterogeneous kinase activation profiles that guide cell-line-specific drug combination selection. Source: doi.org/10.1016/j.celrep.2023.112581 (CC BY 4.0)

Low-dose INKA-guided drug combination efficacy vs high-dose single agent in PDAC organoids and PDX — Figure 3

Fig. 3 from de Goeij-de Haas et al. 2023 — Efficacy comparison of INKA-tailored low-dose three-drug combinations versus high-dose single agents in PDAC organoid cultures and patient-derived xenografts. Source: doi.org/10.1016/j.celrep.2023.112581 (CC BY 4.0)

Conclusion

This study exemplifies the translational value of high-depth phosphoproteomics combined with computational kinase activity inference. By generating a comprehensive phosphosite landscape and deriving quantitative kinase activity scores from it, the authors moved from an unstructured list of >20,000 phosphorylation events to a ranked, experimentally actionable set of drug targets — and demonstrated that the resulting combinations outperformed conventional single-agent high-dose approaches in three independent preclinical model systems. This type of phosphoproteomics-informed, signaling-driven research strategy — connecting site-level PTM data to active pathway nodes and testable pharmacological hypotheses — is exactly the workflow our PTM & Signaling Proteomics services are designed to enable for your research program.

Frequently Asked Questions

Q1: How many phosphosites can I expect to identify from cell or tissue samples?

From a standard phosphoproteomics experiment using IMAC or TiO2 enrichment followed by LC-MS/MS on an Orbitrap Fusion Lumos or Q Exactive HF-X, we typically identify 10,000–20,000 phosphosites from cell lysates (≥5 × 10⁶ cells) in a single-shot experiment without offline fractionation. Adding high-pH reverse-phase offline fractionation increases this to 30,000–50,000+ phosphosites at the cost of additional instrument time per sample. For tissue samples, depth depends on sample quality and species proteome size; well-prepared human or mouse tissue typically yields 8,000–15,000 sites per sample in single-shot mode. For large cohort studies where quantitative completeness across many samples is more important than maximum depth, we offer DIA-based phosphoproteomics that trades some identification depth for substantially lower missing-value rates across a cohort.

Q2: What is the difference between PTM qualitative analysis and PTM quantitative analysis?

Our PTM Qualitative Analysis Service identifies which modification sites are present in your sample — providing site-level peptide sequences, modification positions, localization confidence scores, and a catalog of modified proteins — but does not compare abundance between conditions. This is appropriate when you want to map the modification landscape of an unstudied protein system, characterize a recombinant protein's modification state, or generate a hypothesis-generating site list for follow-up. Our PTM Quantitative Analysis Service adds differential abundance measurement between two or more biological conditions (treatment vs. control, disease vs. normal, time point A vs. B), using label-free, TMT, or SILAC quantification to determine which sites are significantly up- or down-regulated between groups. If your goal is to understand which modifications change in response to a perturbation — a drug treatment, a gene knockout, a disease state — quantitative analysis is required.

Q3: Do you require phosphatase inhibitors to be added during sample collection?

Yes, and this is critical. Phosphorylation is a highly dynamic, enzyme-catalyzed modification that begins reverting as soon as cells are removed from physiological conditions. Phosphatases remain active in lysates unless inhibited. We require samples submitted for phosphoproteomics to have been collected and lysed in the presence of a phosphatase inhibitor cocktail (such as PhosSTOP, sodium fluoride + sodium orthovanadate, or equivalent) and a protease inhibitor cocktail. For nitrosylation and redox proteomics, the trapping reagent (NEM, iodoacetamide, or sodium arsenite) must be added immediately at lysis. For ubiquitination studies, deubiquitinase inhibitor NEM must be added to preserve ubiquitin chains. We provide a full sample collection guide specific to each modification type when you place your project inquiry — please request this before sample collection to avoid loss of biological signal.

Q4: What is Meta-PTMomics and which modification combinations can be profiled together?

Our Meta-PTMomics Analysis Service applies two or more modification-specific enrichment protocols sequentially to the same tryptic digest, generating site-level data for multiple PTM types from a single sample. This enables crosstalk analysis — identifying proteins with co-regulated sites in two different modification types, which is biologically meaningful because many signaling decisions involve coordinated modification at multiple residues (for example, phosphorylation-primed ubiquitination via phosphodegrons, or acetylation-methylation competition at histone lysine residues). Currently supported combinations include: phospho + ubiquitin (diGLY); phospho + acetyl; phospho + ubiquitin + acetyl (three-way); glyco + phospho; and acyl mark panels (acetyl + crotonyl + succinyl + lactyl). The feasibility of other combinations depends on sample input and enrichment compatibility — contact us with your specific research question to discuss.

Q5: Can PTM proteomics data support a drug mechanism of action study or PROTAC degrader profiling?

Yes — PTM proteomics is one of the most informative tools for drug MoA studies. Phosphoproteomics directly reports on kinase pathway activation and inhibition following kinase inhibitor treatment, capturing downstream signaling changes that total protein abundance measurements cannot detect because protein levels do not change on the timescales of acute signaling responses. For PROTAC and molecular glue degrader profiling, ubiquitination (diGLY) proteomics can be used alongside total proteomics to monitor which proteins gain ubiquitination events following degrader treatment — distinguishing direct substrates from indirect proteomic changes. Redox proteomics is applicable to covalent drug mechanism studies where cysteine reactivity is the relevant endpoint. For comprehensive drug MoA support, we offer integrated projects combining total proteomics, phosphoproteomics, and where relevant, ubiquitinomics, using matched sample sets and unified bioinformatics analysis. Our Drug R&D Proteomics service page covers these integrated workflows in detail.

References

  1. de Goeij-de Haas RR, Henneman AA, Piersma SR, et al. Phosphoproteomics guides effective low-dose drug combinations against pancreatic ductal adenocarcinoma. Cell Rep. 2023;42(6):112581. doi.org/10.1016/j.celrep.2023.112581
  2. Bekker-Jensen DB, Bernhardt OM, Hogrebe A, et al. Rapid and site-specific deep phosphoproteome profiling by data-independent acquisition without the need for spectral libraries. Nat Commun. 2020;11:787. doi.org/10.1038/s41467-020-14609-1
  3. Kim W, Bennett EJ, Huttlin EL, et al. Systematic and quantitative assessment of the ubiquitin-modified proteome. Mol Cell. 2011;44(2):325-340. doi.org/10.1016/j.molcel.2011.08.025
  4. Hornbeck PV, Zhang B, Murray B, et al. PhosphoSitePlus, 2014: mutations, PTMs and recalibrations. Nucleic Acids Res. 2015;43(D1):D512-D520. doi.org/10.1093/nar/gku1267

GET STARTED

Design Your PTM Proteomics Project Today

Tell us your modification of interest, sample type, number of conditions, and research question. We will recommend the right enrichment strategy, instrument platform, and quantification workflow, and provide a detailed project plan with expected site coverage, timeline, and deliverables — including integrated signaling pathway analysis.

From a single modification type to integrated Multi-PTMomics — we cover it all under one project.

Request a Customized Quote