Get Your Custom Quote

Online Inquiry

CSF Biomarker Proteomics: Discovery-to-Validation Mass Spectrometry Services

End-to-end cerebrospinal fluid biomarker proteomics — from deep DIA discovery through PRM-targeted verification to independent cohort validation — all under one roof, with workflows purpose-built for CSF's unique matrix challenges.

Research Use Only (RUO) Notice: All services and data provided are strictly for non-clinical research purposes. Our analytical results are not intended for clinical diagnosis, patient management, or therapeutic decision-making.

Services Technologies Demo Case Study FAQ Related Services

CORE SERVICE

CSF Proteomics: Your Proximal Window into Brain Pathophysiology

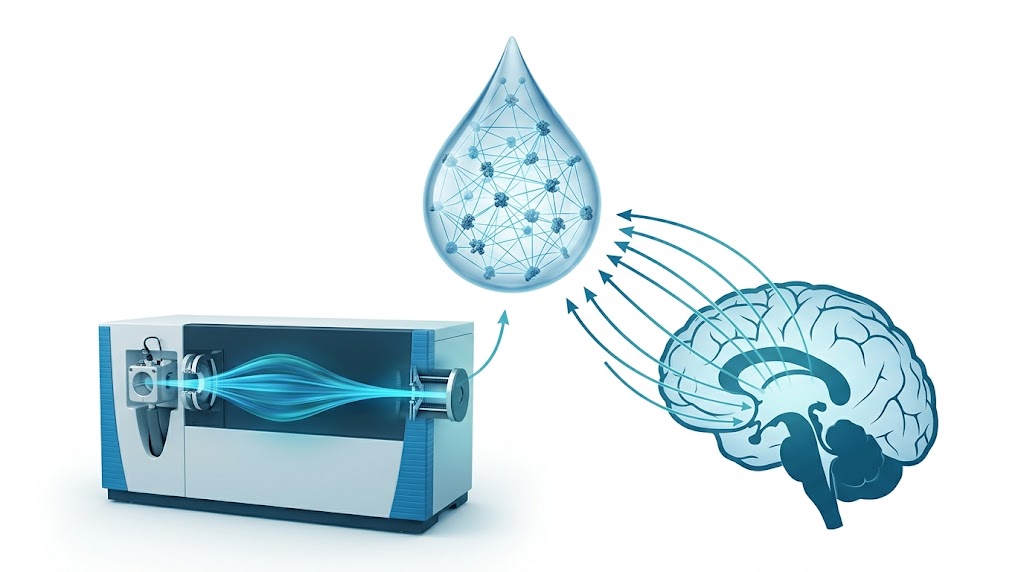
Cerebrospinal fluid bathes the brain and spinal cord, carrying proteins secreted, shed, and released by neurons, glia, and the choroid plexus. Unlike plasma — where brain-derived proteins are diluted into a systemic protein pool orders of magnitude larger — CSF sits in direct contact with the central nervous system. A protein changing in the brain parenchyma changes in CSF. This makes CSF the most information-rich biofluid for studying neurodegenerative diseases, neuroinflammatory conditions, and CNS drug target engagement.

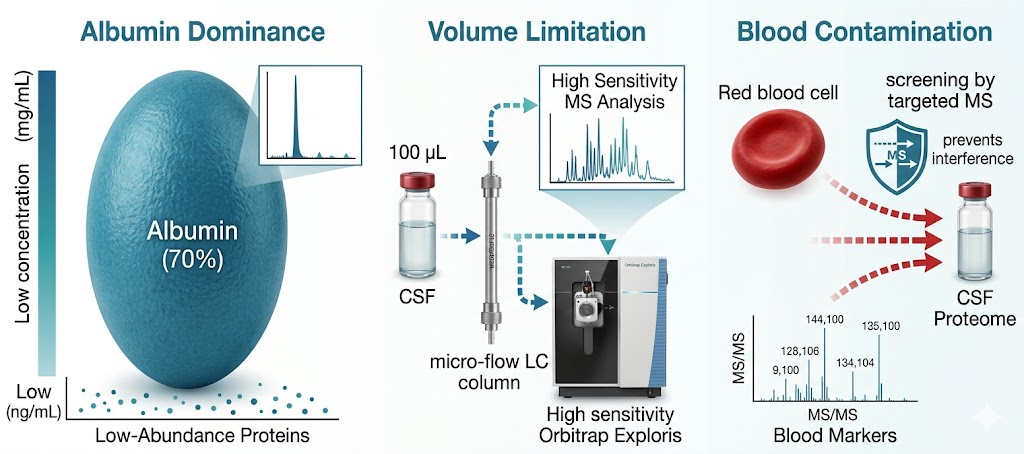
But CSF proteomics is harder than plasma proteomics. We treat CSF as a specialty matrix — not just another sample type on a general proteomics page. Our workflows are optimized for the specific analytical demands of cerebrospinal fluid, deploying immunoaffinity depletion, nanoparticle-based enrichment, and micro-flow LC gradients tuned for limited input volumes. From a typical 100–500 µL CSF sample, we routinely quantify 800–2,000+ protein groups.

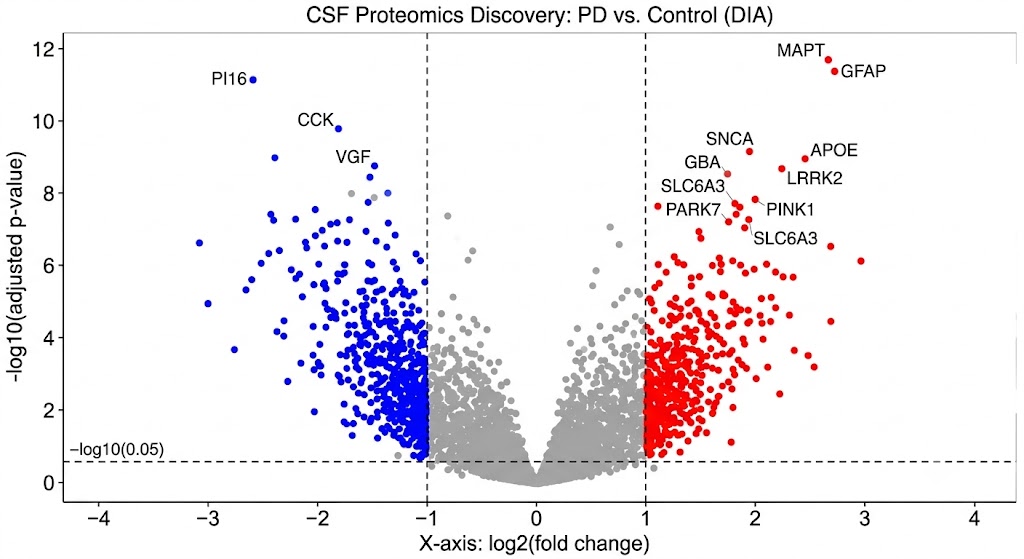
  • Depth: DIA acquisition captures a complete digital record of every detectable CSF peptide — no stochastic precursor selection, no run-to-run gaps
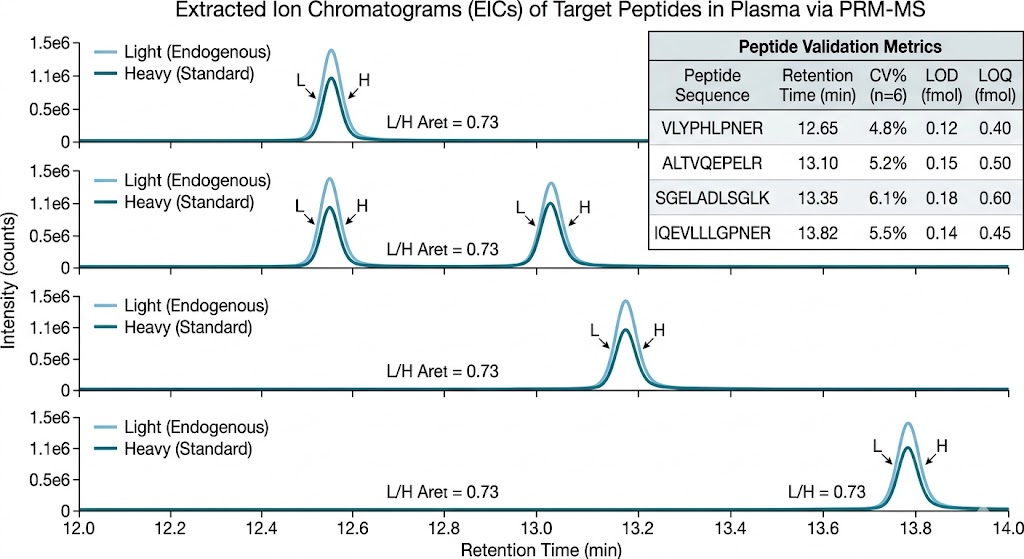
  • Integration: The entire discovery-to-validation pipeline runs under one roof — from unbiased DIA discovery through PRM-targeted verification with heavy isotope-labeled standards to independent cohort validation
  • Neuro-Expertise: We work with CSF from human lumbar puncture, ventricular drain, mouse cisterna magna, rat, and non-human primate collections, and we know the matrix-specific handling requirements for each
Cerebrospinal fluid proteomics concept: CSF droplet with protein networks, LC-MS instrument background, Nature journal scientific illustration style

Three Challenges of CSF Proteomics — And How We Solve Each One

CSF presents three analytical challenges that generic plasma-optimized workflows cannot adequately address. We have built dedicated solutions for each.

Challenge 1: Albumin Dominates at 50–70% of CSF Protein Mass

Even though CSF total protein is ~100× lower than plasma, the dynamic range problem persists: albumin, IgG, transferrin, and a handful of other abundant proteins consume most of the MS ion current, suppressing signal from the low-abundance neuroproteins that are actually biologically informative. We deploy immunoaffinity depletion columns targeting the top 14 high-abundance proteins. For projects requiring even deeper access, we combine depletion with nanoparticle protein corona-based enrichment, which preferentially captures low-molecular-weight and low-abundance proteins typically invisible in unfractionated CSF digests. The result is coverage extending into the ng/mL range — where neuroinflammatory cytokines, synaptic proteins, and neurodegeneration markers reside.

Challenge 2: Typical LP Collections Yield Only 0.5–2 mL Total

CSF is not plasma. You cannot draw another tube. We have optimized our entire sample preparation workflow for limited input volumes, starting from as little as 100 µL of CSF for a DIA discovery experiment. Micro-flow LC gradients maximize ionization efficiency at low peptide loads. Single-pot solid-phase-enhanced sample preparation (SP3) minimizes surface losses during protein cleanup and digestion — losses that become significant when total protein input is only 10–50 µg. For targeted PRM assays, we can work with as little as 50 µL of CSF per sample, quantifying 15–30 pre-selected biomarker candidates with heavy isotope-labeled AQUA peptide standards.

Challenge 3: Blood Contamination Masks True CSF Biology

A traumatic lumbar puncture introduces erythrocytes and plasma proteins into the CSF sample, creating a blood-contamination signature that can dominate the proteomic profile and obscure genuine CSF-derived changes. We screen every CSF sample for hemoglobin-derived peptides by targeted MS before accepting it into the analytical pipeline. Samples exceeding our hemoglobin threshold are flagged, quantified for contamination level, and reported with recommendations. For longitudinal studies where re-collection is impossible, we apply post-hoc contamination correction using established blood-CSF protein abundance ratios.

Three-panel illustration: CSF dynamic range challenge showing albumin dominance, volume limitation with micro-flow LC solution, and blood contamination screening workflow, Nature journal scientific illustration style

From DIA Discovery Through PRM Validation: One Pipeline, One Provider

DIA Discovery

Unbiased data-independent acquisition on timsTOF or Orbitrap platforms. All detectable peptides systematically fragmented within defined m/z windows — creating a complete digital proteome record for each sample. 800–2,000+ protein groups quantified from 100–500 µL CSF.

PRM Verification

Targeted parallel reaction monitoring with heavy isotope-labeled AQUA peptide standards for the top 15–30 candidate biomarkers. Full assay characterization: peptide selection rationale, calibration curves, LOD/LOQ, and CV for every target.

Cohort Validation

Independent validation in 80–300+ samples per group. ROC curve analysis with AUC and 95% confidence intervals, sensitivity/specificity at optimal thresholds, LASSO and random forest panel optimization, and DeLong's test for panel comparisons.

CSF Biomarker Pipeline Workflow

Step 1 — Sample Intake & QC: Hemoglobin screening by targeted MS, total protein quantification, visual contamination grading. Samples failing QC thresholds are flagged and reported.

Step 2 — Depletion & Digestion: Immunoaffinity depletion of top 14 high-abundance proteins (or nanoparticle enrichment for deep coverage). SP3-based tryptic digestion optimized for 10–50 µg total protein input.

Step 3 — DIA LC-MS/MS Acquisition: Micro-flow or nano-flow LC coupled to timsTOF or Orbitrap mass spectrometer. Method tuned for CSF peptide complexity with optimized gradient length and MS1/MS2 cycle times.

Step 4 — Data Processing & Candidate Selection: Spectronaut or DIA-NN processing with species-specific spectral library. LIMMA differential abundance with Benjamini-Hochberg correction. Candidate ranking by composite score integrating statistical significance, effect size, and MS detectability metrics.

Step 5 — PRM Assay Development & Verification: 2–3 proteotypic peptides per candidate, heavy AQUA peptide synthesis, collision energy and scheduling optimization. PRM analysis of independent verification cohort. Assay performance metrics: CV, linearity (R²), LOD, LOQ.

Step 6 — Panel Optimization & Validation: ML feature selection (LASSO, random forest), independent cohort validation, ROC analysis with defined sensitivity and specificity. Final validated panel delivery with publication-ready figures and statistical outputs.

CSF Sample Collection and Submission Requirements

Proper CSF collection and handling are essential for proteomic data quality. The table below summarizes our recommended specifications.

Sample Type Volume / Input Collection Tube Storage Notes
Human CSF (lumbar puncture) ≥100 µL per sample (DIA); ≥50 µL (PRM) Polypropylene, no additives Snap-freeze on dry ice, store at -80°C Avoid glass tubes (protein adsorption); record collection time and fraction number if sequential
CSF with protease inhibitors ≥150 µL per sample Polypropylene + protease inhibitor cocktail (add immediately post-collection) Snap-freeze within 30 min, -80°C Required for neuropeptide-focused or peptidomics studies
Mouse CSF (cisterna magna) ≥20 µL (pool 3–5 animals recommended for discovery) Polypropylene, low-protein-binding Snap-freeze, -80°C Pooling recommended for DIA discovery; individual samples acceptable for PRM
Rat CSF (cisterna magna) ≥30 µL Polypropylene, low-protein-binding Snap-freeze, -80°C Individual samples feasible for DIA
Non-human primate CSF ≥100 µL Polypropylene, no additives Snap-freeze, -80°C Same handling protocol as human CSF

Additional recommendations for cohort and multi-site studies:

  • Standardize the collection protocol across all sites. Provide collection SOPs to each clinical coordinator.
  • Use identical tube types within the study. Different tube polymers have different protein adsorption profiles.
  • Record the time between collection and freezing for each sample. Delayed freezing increases proteolytic degradation.
  • If blood contamination is suspected (pink/red CSF), note the visual contamination grade (0–4) on the sample manifest.
  • For longitudinal studies with per-visit collections, batch randomization (not chronological grouping) minimizes confounding of biological change with analytical drift.
  • Ship on dry ice with temperature loggers. Do not allow samples to thaw during transit.

For projects involving plasma, serum, urine, or other biofluid specimens alongside CSF, our body fluid proteomics services cover the full range of clinically accessible matrices with matrix-optimized workflows comparable to those detailed here for cerebrospinal fluid.

CSF Biomarker Proteomics in Practice

Our CSF biomarker pipeline produces publication-grade data across every phase of the workflow — from discovery volcano plots through PRM quantitative traces to final machine learning panel performance metrics. The representative visualizations below illustrate the data quality and analytical depth that support each stage of a CSF biomarker program.

Volcano plot from DIA CSF proteomics discovery: log2 fold change vs -log10 p-value with significantly up/down-regulated proteins highlighted in blue and red

Volcano plot from DIA CSF proteomics discovery: each point represents a quantified protein group comparing disease versus control groups. Red (upregulated) and blue (downregulated) points meet dual significance thresholds (|log2FC| > 1, adjusted p < 0.05). Key biomarker candidates labeled with gene names.

PRM extracted ion chromatograms: overlaid traces of endogenous and heavy peptide standards for 6 CSF biomarker candidates with peak area ratios annotated

PRM extracted ion chromatograms for 6 verified CSF biomarker candidates: overlaid traces of endogenous (light) peptides and heavy isotope-labeled AQUA standards (dark), with peak area ratios (L/H) and calculated concentrations annotated. Co-eluting peak profiles and matching fragment ion ratios (dot-product > 0.9) confirm peptide identity.

ROC curve comparison: individual biomarkers vs multi-protein ML panel for CSF, with AUC values and confusion matrix inset

ROC curves comparing individual CSF biomarker performance against the LASSO-selected multi-protein panel: the optimized panel achieves AUC 0.93 (95% CI: 0.88–0.97), outperforming the best single biomarker (AUC 0.76). Confusion matrix inset shows classification at the optimal Youden index threshold.

CASE STUDY

CSF Biomarker Discovery and Validation in Parkinson's Disease: A Published Case Study

Oh S, Jung J, Kim J, et al. eBioMedicine. 2025. DOI: 10.1016/j.ebiom.2025.105844

Background & Purpose

Parkinson's disease (PD) lacks cerebrospinal fluid protein biomarkers that reflect its underlying pathophysiology and can guide disease-modifying therapy development. Oh and colleagues addressed this gap by deploying a staged MS-based proteomics workflow — deep discovery profiling of CSF integrated with substantia nigra tissue proteomic data, followed by statistical candidate selection and validation. The study demonstrates the discovery-to-candidate-validation paradigm that our CSF Biomarker Proteomics service operationalizes for any neurological indication.

Methods

The study analyzed CSF samples from 40 individuals with Parkinson's disease and 40 age-matched healthy controls using deep proteome profiling by mass spectrometry. CSF proteins were subjected to depletion of high-abundance proteins, tryptic digestion, and data-independent acquisition (DIA) on a high-resolution mass spectrometer. The resulting CSF proteomic data were integrated with previously published substantia nigra (SN) tissue proteomic data to prioritize candidates with concordant changes at both the tissue and biofluid levels — a strategy that enriches for proteins directly reflecting brain pathophysiology rather than systemic confounders. Candidate biomarkers were selected using a stepwise statistical criterion combining differential abundance significance, effect size, and biological relevance.

Results Overview

Deep proteome analysis of the CSF discovery cohort identified 3,683 unique proteins, of which 1,425 were quantified across all 80 samples. Differential abundance analysis between PD and control groups revealed 505 proteins that significantly separated the two groups. Applying a stepwise criterion and integrating with substantia nigra tissue proteomic data, the authors identified 8 potential PD diagnostic markers with disease-relevant biological functions. Notably, this investigation was the first to identify peptidase inhibitor 16 (PI16) as a possible PD biomarker in CSF and the first to detect cholecystokinin (CCK) in the CSF of individuals with PD. A combination of 4 proteins demonstrated modest but significant ability to separate PD from controls. Additionally, CCK and VGF levels significantly predicted Montreal Cognitive Assessment (MoCA) total scores among individuals in the dementia with Lewy bodies (DLB) group, linking these CSF protein changes to cognitive function.

Case study: CSF proteomic profiling and discovery results — protein identification, quantification, and differential abundance between PD and control groups (from Oh et al. 2025, eBioMedicine)

CSF proteomic profiling of the discovery cohort: DIA-based protein identification and quantification results showing differential abundance between Parkinson's disease and healthy control groups. (Source: Oh et al. 2025, eBioMedicine)

Case study: Candidate biomarker validation — PRM-targeted verification results for 8 PD candidate biomarkers from CSF (from Oh et al. 2025, eBioMedicine)

Candidate biomarker validation: targeted PRM verification results for the top PD candidate biomarkers from CSF discovery, showing confirmed differential abundance across the independent verification cohort. (Source: Oh et al. 2025, eBioMedicine)

Case study: 4-protein biomarker panel performance metrics — ROC curves and biomarker characterization (from Oh et al. 2025, eBioMedicine)

Biomarker panel performance: the 4-protein CSF biomarker combination showing separation of PD from controls and correlation of CCK/VGF levels with cognitive scores in the DLB subgroup. (Source: Oh et al. 2025, eBioMedicine)

Conclusion

Oh et al. demonstrated that deep MS-based proteomic profiling of CSF — when integrated with tissue-level proteomic data from the affected brain region — can identify novel, biologically relevant protein biomarker candidates for Parkinson's disease. The identification of PI16 in CSF for the first time and CCK in PD CSF expands the catalog of proteins measurable in this biofluid and provides new molecular entry points for understanding PD pathophysiology. The staged approach — discovery in CSF → integration with tissue data → candidate prioritization → validation — mirrors the pipeline we have built into our CSF Biomarker Proteomics service. We deploy the same DIA acquisition strategies, the same depletion and enrichment workflows, and the same statistical frameworks to help neuroscience research teams navigate their own CSF biomarker programs, from the first discovery experiment through publication-ready validated panels.

Bioinformatics and Data Analysis for CSF Biomarker Studies

Raw mass spectrometry data are only the starting point. Our bioinformatics pipeline transforms spectra into interpretable, publication-ready results.

From Raw Spectra to Candidate Biomarker Lists

DIA raw files are processed using Spectronaut or DIA-NN with a species-specific spectral library. Protein group quantification is performed at the peptide precursor level, and data are normalized using a combination of retention time alignment and local regression (LOESS) to correct for run-to-run signal drift. Differential abundance analysis uses LIMMA (linear models for microarray data) with empirical Bayes moderation and Benjamini-Hochberg multiple testing correction. Each protein receives a fold change, p-value, adjusted p-value, and q-value. Candidates are ranked by a composite score incorporating statistical significance, effect size, and MS-level detectability metrics including number of unique peptides and CV across replicates.

Machine Learning Panel Optimization

For multi-biomarker panel construction, we apply LASSO (least absolute shrinkage and selection operator) regression to identify the minimal subset of proteins that maximizes classification performance. Cross-validation (k-fold, typically k=5 or k=10) prevents overfitting. Alternative methods — random forest with variable importance ranking, elastic net, and stepwise logistic regression — are available upon request. The output includes feature importance scores, model coefficients, cross-validation performance metrics, and final panel composition with per-biomarker contribution. Once a validated panel is defined, transition to our multiplexed protein panel quantification service for routine, high-throughput cohort-level measurement of your finalized biomarker set.

Pathway and Network Analysis (Optional)

For clients interested in the biological interpretation of their proteomic data, we offer enrichment analysis against Gene Ontology (biological process, molecular function, cellular component), KEGG pathways, Reactome, and WikiPathways. Protein-protein interaction networks are constructed using STRING and visualized with Cytoscape. Weighted gene co-expression network analysis (WGCNA) identifies modules of co-regulated proteins that may represent coordinated biological processes or shared regulatory mechanisms. These analyses are delivered as annotated figures, tables, and interpretation summaries suitable for manuscript inclusion.

LC-MS/MS vs. Affinity Platforms for CSF: Choosing the Right Approach

The choice between mass spectrometry-based and affinity-based proteomics for CSF depends on the research question. The table below provides a fair comparison to help you determine which approach — or which combination — best serves your study.

Dimension LC-MS/MS (DIA/TMT) Affinity Platforms (Olink/SomaScan)
Protein Coverage 800–2,500+ proteins per sample (depends on depletion/fractionation) 1,500–7,000 pre-defined protein targets
Novel Biomarker Discovery Yes — detects any peptide within mass and concentration range; no prior target list required No — limited to proteins for which binding reagents exist
Sample Volume Required 50–500 µL depending on workflow 1–4 µL
Proteoform/PTM Detection Yes — peptide-level resolution distinguishes isoforms, cleavage products, and PTMs No — binding reagents recognize epitopes, not specific proteoforms
Quantification Type Relative (label-free, TMT) or absolute (heavy AQUA peptides, calibration curves) Relative (NPX or RFU units, not molar concentration)
Throughput Moderate (20–40 samples/day for DIA; 40–80 for PRM) Very high (hundreds/day)
Best For Unbiased discovery of novel CSF biomarkers; independent verification using an orthogonal technology; PTM-focused studies; absolute quantification with defined accuracy Screening large cohorts against known protein panels; studies where sample volume is severely limited; when highest throughput is needed

These approaches are complementary, not competitive. Many biomarker programs use both: affinity platforms for broad screening of large cohorts against known panels, followed by LC-MS/MS for independent, orthogonal verification of top candidates and for unbiased discovery of proteins outside the affinity panel's target list. Our CSF Biomarker Proteomics service covers the MS-based arm of this complementary workflow — from deep, unbiased discovery through quantitative, targeted validation.

Frequently Asked Questions

Q1: What is the minimum CSF volume required for proteomics analysis?

For DIA discovery, we recommend a minimum of 100 µL of human CSF per sample. This volume supports our standard depletion and digestion workflow and typically yields 800–1,500 quantified protein groups. For targeted PRM assays on pre-selected biomarker candidates, we can work with as little as 50 µL per sample. For mouse CSF, we recommend pooling 3–5 animals (≥20 µL pooled) for DIA discovery due to the very low total protein content. If your available volume is below these thresholds, contact us during study design — we can evaluate whether nanoparticle enrichment or other low-input strategies can make your samples viable.

Q2: How many proteins can you detect and quantify in CSF?

With immunoaffinity depletion of the top 14 high-abundance proteins followed by DIA acquisition on a timsTOF or Orbitrap platform, we routinely identify and quantify 800–1,500 protein groups per 100 µL CSF sample. Adding moderate peptide-level fractionation (high-pH reversed-phase, 6–12 fractions) extends this to 1,500–2,500+ protein groups. With nanoparticle protein corona-based enrichment, coverage can exceed 2,000 protein groups without fractionation. The actual number depends on the depletion/enrichment strategy, instrument platform, sample volume, and desired throughput. We discuss coverage expectations during study design based on your specific experimental goals.

Q3: How does LC-MS/MS compare to Olink or SomaScan for CSF biomarker discovery?

Affinity platforms offer ultra-high sensitivity, very low sample volume requirements (1–4 µL), and high throughput — valuable attributes for screening large cohorts. However, they are inherently limited to pre-defined protein panels: they can only measure proteins for which binding reagents have been developed. LC-MS/MS is unbiased — it detects any peptide within its mass and concentration range, meaning it can discover novel biomarkers not represented on any affinity panel. MS also provides peptide-level resolution, distinguishing isoforms, proteolytic fragments, and post-translational modifications that affinity reagents cannot discriminate. For CSF — where many biologically important proteins exist at low concentrations and are not represented on standard affinity panels — MS-based discovery offers unique value. Many programs use both technologies in complementary fashion.

Q4: How do you control for batch effects in large CSF cohort studies?

We use multiple strategies: (1) randomized sample processing order (not chronological or grouped by condition), which converts any residual technical drift into random noise rather than systematic bias; (2) retention time alignment and LOESS normalization during data processing; (3) pooled QC samples injected every 8–10 runs to monitor instrument performance and enable inter-batch normalization; (4) bridge samples — identical aliquots run in every batch — for studies exceeding ~200 samples; and (5) statistical batch correction (ComBat or RUVseq) when residual batch effects are detected. We report all QC metrics transparently: peptide and protein-level CV distributions, QC sample correlation coefficients, and batch effect diagnostics.

Q5: Can you analyze CSF from non-human models (mouse, rat, NHP)?

Yes. We routinely handle CSF from mouse (cisterna magna collection), rat, and non-human primate models. Mouse and rat CSF present additional challenges due to extremely low volumes (typically 10–30 µL per animal) and low total protein content. For discovery proteomics, we generally recommend pooling 3–5 animals per sample to achieve sufficient protein input. For targeted PRM assays, individual animal samples may be feasible depending on the assay sensitivity. Non-human primate CSF is handled identically to human CSF. Please discuss your model system during study design so we can optimize the workflow for your specific sample constraints.

Q6: What data deliverables and bioinformatics support do you provide?

Every project includes: (1) raw MS data files; (2) processed quantification matrices (protein groups × samples in .csv or .tsv format); (3) statistical analysis results (differential abundance tables with fold changes, p-values, adjusted p-values); (4) PRM assay characterization reports (peptide selection rationale, calibration curves, LOD/LOQ, CV); (5) machine learning panel optimization outputs (feature importance, cross-validation metrics, ROC curves); and (6) a comprehensive study report describing all methods, QC metrics, and interpretation guidance. All data are in formats compatible with R, Python, or Perseus. We also offer optional bioinformatics support for pathway enrichment analysis, protein-protein interaction network construction, WGCNA co-expression analysis, and manuscript figure preparation.

GET STARTED

Advance Your CSF Biomarker Program with an Integrated Discovery-to-Validation Pipeline

From deep DIA profiling of your discovery cohort through PRM-targeted verification and machine learning panel optimization to independent cohort validation — our CSF biomarker proteomics service delivers every phase under one roof, eliminating the data fragmentation and methodological drift of multi-vendor biomarker programs.

Ready to discuss your CSF biomarker study?

Request a Customized Quote