Get Your Custom Quote

Online Inquiry

Discovery & Quantitative Proteomics Analysis

From unbiased proteome-wide discovery to deep quantitative profiling — we provide DIA, 4D-DIA, TMT, label-free, and SILAC workflows that deliver complete, reproducible, publication-ready protein datasets across cells, tissues, and complex biological fluids.

Research Use Only (RUO) Notice: All services and data provided are strictly for non-clinical research purposes. Our analytical results are not intended for clinical diagnosis, patient management, or therapeutic decision-making.

Services Technologies Demo Case Study FAQ Related Services

CORE SERVICE

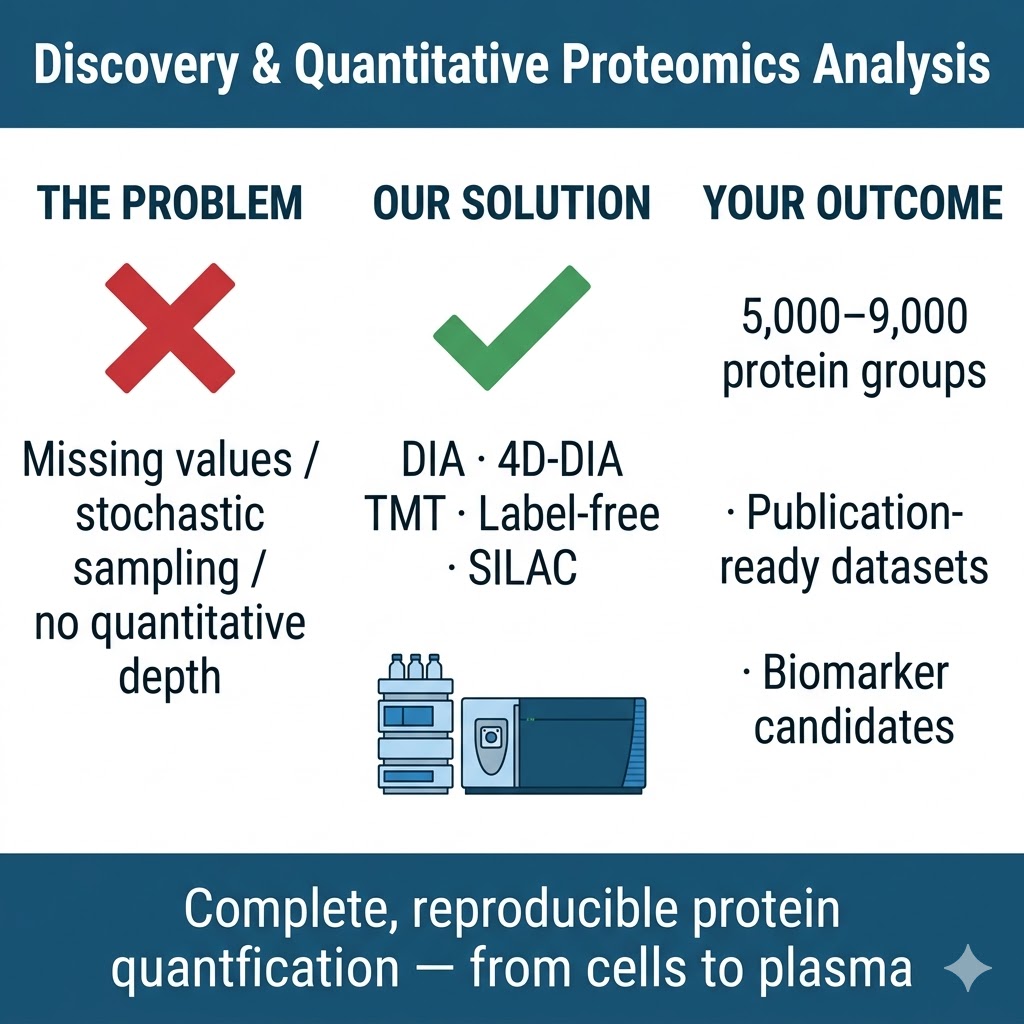
Full-Spectrum Discovery Proteomics — from Protein ID to Deep Quantification

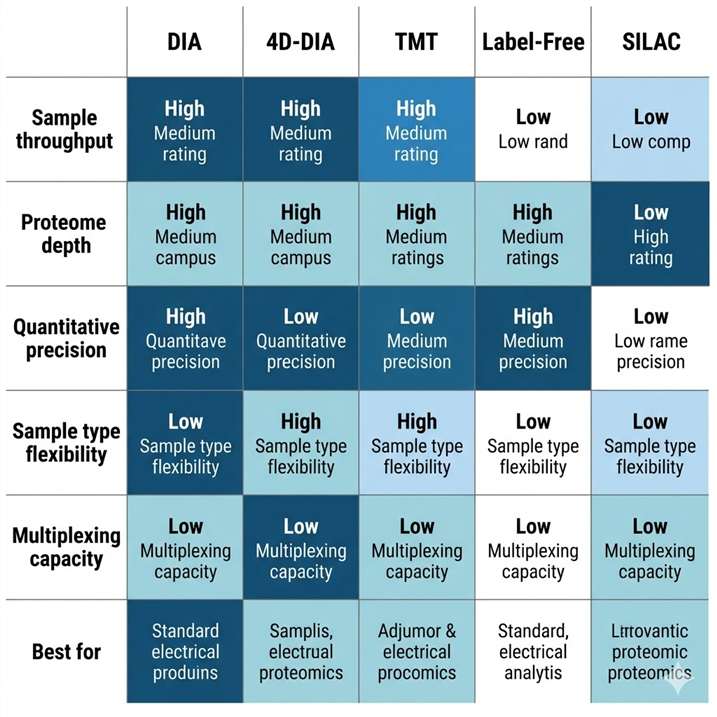
Discovery and quantitative proteomics form the foundation of every protein-level research program. Whether you need an unbiased snapshot of how the proteome shifts between conditions, or a deep, reproducible quantification dataset to support a biomarker discovery cohort, the right workflow choice determines what you can confidently measure, compare, and publish. We operate across the full range of established and next-generation discovery proteomics platforms — DIA, 4D-DIA (diaPASEF on timsTOF HT), label-free, 4D label-free, TMT, iTRAQ, and SILAC — all on high-resolution instruments including the Bruker timsTOF Pro, Thermo Q Exactive series, and Orbitrap Fusion Lumos, with standardized QC and publication-grade bioinformatics integrated into every project.

  • Deep proteome coverage: DIA and 4D-DIA workflows routinely identify and quantify thousands of proteins per sample, with low missing-value rates even across large cohorts; ion mobility separation in 4D workflows adds a fourth dimension that reduces spectral interference and improves identification confidence for complex matrices such as plasma, FFPE tissue, and exosomes.
  • Flexible quantification strategies: We match the workflow to your experimental design — label-free or 4D label-free for large or heterogeneous sample sets, TMT (up to 16-plex) or iTRAQ for high-throughput multiplexed comparisons, SILAC for cell-culture-based pulse-chase or interaction studies — so your quantitative data is optimized for your study, not the other way around.
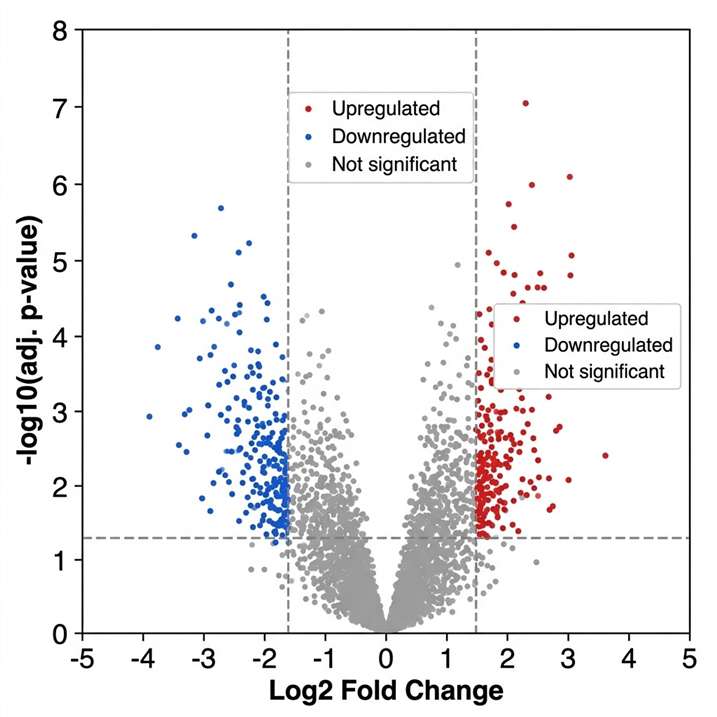
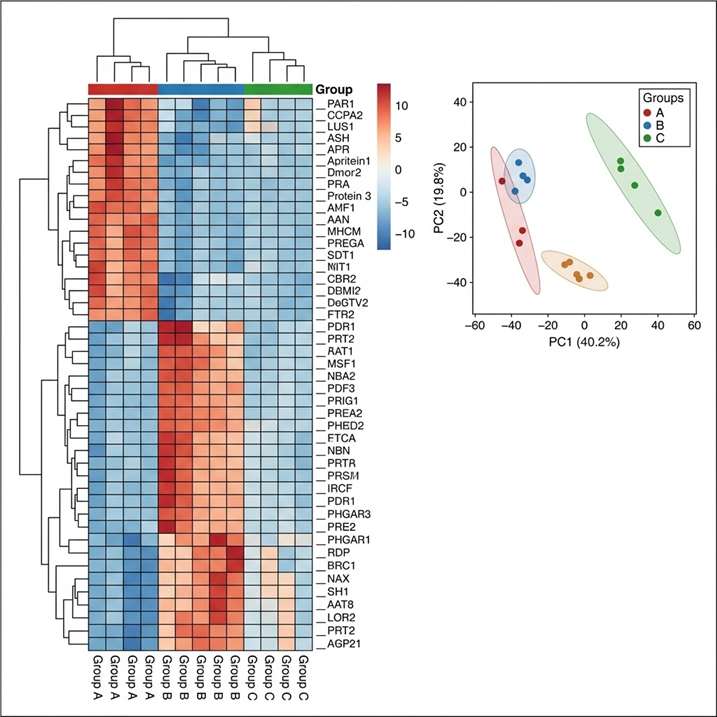
  • End-to-end project delivery: From sample intake QC through LC-MS/MS acquisition, database search, differential expression analysis, pathway enrichment, and final report with methods text, we deliver a comprehensive data package ready to support manuscript submission without additional processing.
Discovery and quantitative proteomics service overview — DIA, TMT, label-free, SILAC workflow comparison

Discovery & Quantitative Proteomics: matching the right platform to your research question

What Is Discovery & Quantitative Proteomics?

Discovery proteomics refers to unbiased, large-scale protein analysis that does not require prior knowledge of which proteins are present in a sample. Using bottom-up LC-MS/MS, trypsin-digested peptides are separated chromatographically and detected by high-resolution mass spectrometry, generating identification and quantification data for thousands of proteins in a single experiment. Quantitative proteomics adds relative or absolute abundance measurements to these identifications, enabling meaningful comparisons between treatment groups, time points, disease states, or sample cohorts.

The field has been transformed by two technology shifts: the adoption of data-independent acquisition (DIA), which systematically fragments all precursor ions within a defined m/z window rather than selecting the most abundant subset as in DDA, and the introduction of ion mobility separation (4D) in instruments like the Bruker timsTOF series, which adds a gas-phase separation step that dramatically reduces co-elution interference and improves quantitative precision in complex matrices. Together, these advances make it possible to quantify 5,000–8,000 protein groups in cells or tissues and 1,000–2,500 protein groups in depleted plasma with high reproducibility across large sample cohorts — performance that was difficult to achieve even five years ago.

Our Discovery & Quantitative Proteomics Sub-Services

We provide a full portfolio of discovery and quantitative proteomics services covering every major acquisition mode and labeling strategy. Each sub-service is designed for a specific experimental context — choose based on your sample type, number of conditions, required depth, and downstream validation plans.

Sub-services currently available include: DIA Quantitative Proteomics Analysis for high-coverage, low-missing-value discovery; 4D-DIA Quantitative Proteomics Analysis for ion-mobility-enhanced depth in complex or cohort-scale studies; Label-Free Quantitative Proteomics for flexible, reagent-free comparative proteomics; 4D Label-Free Quantitative Proteomics combining ion mobility and label-free quantification; TMT-Based Quantitative Proteomics for high-throughput multiplexed differential analysis; iTRAQ-Based Quantitative Proteomics for isobaric multiplexed quantification; SILAC-Based Quantitative Proteomics for metabolic labeling in cell culture models; Qualitative Proteomics Services for protein identification and profiling without quantification; Protein Identification Service for single-protein or gel-band identification; Protein Profiling Analysis Service for discovery-phase proteome comparison; and Deep Proteome Profiling for ultra-high-depth protein characterization in demanding sample types.

Discovery proteomics technology landscape — DIA, 4D-DIA, TMT and label-free acquisition modes comparison

Discovery Proteomics Technologies & Platform Overview

Data-Independent Acquisition (DIA & 4D-DIA)

DIA systematically fragments all precursor ions within predefined isolation windows, eliminating the stochastic undersampling inherent in DDA. Every peptide present in the window is fragmented in every acquisition cycle, producing highly reproducible quantitative matrices with very low missing-value rates. Our 4D-DIA implementation on the Bruker timsTOF HT adds trapped ion mobility separation (TIMS) as a fourth separation dimension before MS/MS fragmentation. The resulting diaPASEF acquisition combines near-100% ion utilization with CCS-based filtering, delivering improved sensitivity, reduced co-fragmentation interference, and outstanding quantitative precision for complex matrices including plasma, serum, and FFPE tissues. DIA and 4D-DIA are our recommended platforms for large cohort studies, biomarker discovery, and any project where quantitative completeness across many samples is essential.

Isobaric Labeling (TMT & iTRAQ)

Tandem mass tag (TMT) and isobaric tags for relative and absolute quantitation (iTRAQ) are in vitro chemical labeling strategies that attach mass-equal, reporter-ion-distinct tags to peptide amine groups. All labeled samples are combined and analyzed in a single LC-MS/MS run, generating quantitative reporter ion intensities per peptide per sample. TMT supports multiplexing of up to 16 samples simultaneously, providing high-throughput, batch-normalized quantification with excellent reproducibility within a plex. iTRAQ offers up to 8-plex labeling, suitable for multi-condition comparisons. Both platforms are particularly well-suited to studies requiring high protein coverage across many treatment groups, time-course experiments, and multi-condition comparative analyses where relative fold-changes are the primary endpoint. They are compatible with phosphoproteomics, glycoproteomics, and other PTM-enrichment workflows.

Label-Free & SILAC Quantification

Label-free quantification (LFQ) compares protein abundance across samples by integrating MS1 precursor ion intensities or spectral counts, without any chemical modification of peptides. Our DDA-based LFQ workflow and 4D label-free service using timsTOF cover a wide range of sample types with no constraint on sample origin, species, or quantity. SILAC (stable isotope labeling by amino acids in cell culture) incorporates heavy isotope-labeled essential amino acids directly into newly synthesized proteins during cell growth, generating chemically identical "light" and "heavy" peptide pairs detectable in the same MS run with very low ratio noise. SILAC is the gold standard for quantifying dynamic changes in actively dividing cells, protein turnover, protein-protein interaction stoichiometry, and drug-induced proteome remodeling in cell culture models. We offer both standard SILAC (Lys/Arg labeling) and pulse-SILAC configurations.

Standard Discovery Proteomics Workflow

Step 1 — Sample Receipt & QC: Samples are received, logged, and assessed for protein concentration (BCA), integrity, and purity. QC metrics are reported at intake; samples failing minimum thresholds are flagged before processing begins. Acceptable formats include protein extracts, cell pellets, tissue, FFPE sections, plasma/serum, urine, CSF, and exosome pellets.

Step 2 — Sample Preparation & Digestion: Proteins are denatured, reduced, alkylated, and digested with trypsin using standardized SP3 or FASP protocols adapted for the sample matrix. For isobaric labeling workflows (TMT/iTRAQ), peptides are labeled following digestion, combined according to the experimental design, and desalted. SILAC cells are lysed, mixed at defined heavy-to-light ratios, and digested. For complex samples or maximum coverage, optional high-pH reversed-phase fractionation is applied.

Step 3 — LC-MS/MS Data Acquisition: Peptides are separated by nanoflow UHPLC (C18 analytical column, 75–120 min gradients) and analyzed by high-resolution mass spectrometry. Platform selection depends on service: Bruker timsTOF HT (diaPASEF 4D-DIA), Thermo Q Exactive HF-X or Orbitrap Fusion Lumos (DDA, DIA, TMT), or AB Sciex 6500+ (targeted validation). Instrument QC includes iRT peptide injection, mass accuracy checks, and ion current monitoring before and after sample runs.

Step 4 — Database Search & Protein Identification: Raw data are processed using DIA-NN (DIA workflows), MaxQuant or Proteome Discoverer (DDA/TMT/LFQ), or Spectronaut (spectral-library DIA). Searches are performed against species-specific UniProt/SwissProt databases with FDR thresholds of ≤1% at peptide and protein level. Protein grouping, razor-peptide assignment, and intensity normalization are applied per workflow specifications.

Step 5 — Bioinformatics Analysis & Reporting: Normalized protein abundance matrices are processed in R/Python pipelines for statistical testing (t-test, ANOVA, limma), volcano plot generation, principal component analysis, and hierarchical clustering heatmaps. Significantly changed proteins are subjected to GO enrichment, KEGG pathway analysis, and STRING protein-protein interaction network visualization. Deliverables include raw MS data files, protein and peptide identification tables, quantitative matrices, statistical results, bioinformatics figures, methods text, and a project summary report.

Sample Requirements

Sample Type Recommended Input Notes
Cell pellet ≥1 × 10⁶ cells (standard); ≥1 × 10⁵ cells (low-input/4D) Wash twice with ice-cold PBS before snap-freezing; ship on dry ice
Tissue ≥10 mg fresh/frozen; ≥5 × 10 μm FFPE sections Snap-freeze immediately after excision; store at −80 °C; FFPE dewaxing performed in-house
Plasma / Serum ≥100 μL per sample (standard); ≥50 μL (4D-DIA depleted) Collect in EDTA (plasma) or SST (serum) tubes; centrifuge within 30 min; store at −80 °C in single-use aliquots
Exosome pellet ≥50 μg protein equivalent or ≥5 × 10⁹ particles Isolated by differential ultracentrifugation or size-exclusion; ship as pellet at −80 °C
Urine / CSF / other biofluids ≥500 μL urine; ≥100 μL CSF Centrifuge to remove cells; aliquot; store at −80 °C; avoid repeated freeze-thaw cycles
Pre-extracted protein ≥100 μg at ≥1 μg/μL Provide BCA or Bradford quantification data; submit in non-detergent buffer or specify detergent used

Minimum input requirements may vary by workflow and expected proteome depth. Contact us with your specific sample type and experimental design for a confirmed recommendation before shipping.

Representative Data from Discovery Proteomics Experiments

The following examples illustrate the type and quality of quantitative outputs generated by our standard workflows. Data include differential expression volcano plots, quantitative precision metrics, and pathway-level visualizations that are typical deliverables in DIA and TMT projects.

DIA proteomics volcano plot — differential protein expression between treatment and control groups, FC vs p-value

Fig. 1 — Volcano plot of DIA-quantified differential proteins (fold change ≥1.5, adjusted p-value ≤0.05) between two biological conditions. Significantly up- and down-regulated proteins are highlighted; color-coded by statistical significance threshold.

TMT proteomics heatmap and PCA clustering — quantitative reproducibility across biological replicates

Fig. 2 — Hierarchical clustering heatmap (left) and PCA plot (right) of TMT-quantified protein abundance across six biological replicates per group. Inter-replicate CV below 15% confirms high quantitative reproducibility.

KEGG pathway enrichment and GO biological process bubble plot — bioinformatics deliverable from discovery proteomics

Fig. 3 — GO biological process and KEGG pathway enrichment bubble plots generated from significantly regulated proteins in a DIA discovery experiment. Bubble size reflects gene count; color encodes −log10(adjusted p-value).

CASE STUDY

Plasma DIA Proteomics Identifies Pathogenic Pathways and Novel Biomarker Candidates in Cervical Cancer Progression

Han et al., Journal of Clinical Medicine, 2022 — DOI: 10.3390/jcm11237155

Background & Purpose

Cervical cancer develops through a stepwise progression from normal epithelium through high-grade squamous intraepithelial lesion (HSIL) to invasive carcinoma, but the protein-level molecular events driving each transition remain incompletely characterized. Han et al. aimed to use plasma-based DIA quantitative proteomics to generate an unbiased protein abundance landscape across all three disease states simultaneously — providing both mechanistic insight and a ranked list of candidate biomarker proteins detectable in a minimally invasive blood-based sample matrix.

Methods

The study enrolled 60 participants: 20 healthy female volunteers, 20 patients with HSIL, and 20 patients with confirmed cervical cancer. Plasma was collected and processed using 14-antibody multiple affinity removal followed by tryptic digestion. DIA data acquisition was performed, and protein groups were quantified across all three cohorts. Differentially expressed proteins (DEPs) were identified by fold-change and statistical filtering. Functional annotation of DEPs was performed by Gene Ontology and KEGG pathway analysis; protein-protein interaction networks were constructed using weighted gene co-expression network analysis (WGCNA) to identify hub proteins and co-expression modules. Top candidate biomarkers were validated in an independent sample set by ELISA.

Results Overview

The DIA workflow identified 243 differentially expressed proteins across the three groups. KEGG pathway analysis showed that DEPs were predominantly enriched in the complement and coagulation cascade, cholesterol metabolism pathway, IL-17 signaling pathway, and the viral protein-cytokine receptor interaction pathway — providing a systems-level map of the immune and metabolic dysregulation occurring during HSIL and cervical cancer progression. WGCNA identified hub proteins within co-expression modules that showed stage-specific abundance patterns. ELISA validation confirmed the differential expression of key candidate biomarkers, supporting their potential utility as plasma protein indicators of disease state in this non-clinical research context.

KEGG pathway enrichment in DIA plasma proteomics of cervical cancer — complement coagulation and IL-17 pathway DEPs

Fig. 2 from Han et al. 2022 — KEGG pathway enrichment of 243 DEPs identified by plasma DIA proteomics across healthy, HSIL, and cervical cancer cohorts. Source: doi.org/10.3390/jcm11237155 (CC BY 4.0)

Volcano plot of differentially expressed proteins — DIA plasma proteomics cervical cancer vs healthy

Fig. 3A from Han et al. 2022 — Volcano plot displaying differentially expressed proteins between cervical cancer and healthy plasma groups identified by DIA quantitative proteomics. Source: doi.org/10.3390/jcm11237155 (CC BY 4.0)

PPI hub protein network from WGCNA co-expression modules — DIA proteomics cervical cancer plasma

Fig. 4 from Han et al. 2022 — Protein-protein interaction network of hub proteins identified by WGCNA analysis of DIA plasma proteomics data across disease progression stages. Source: doi.org/10.3390/jcm11237155 (CC BY 4.0)

Conclusion

This study demonstrates the power of plasma DIA quantitative proteomics for simultaneous, unbiased profiling of disease-relevant protein changes across a multi-stage disease continuum in a non-clinical research cohort. The 243 DEPs identified encompassed both known cancer-associated pathways and previously unreported protein associations, highlighting DIA's capacity to generate discovery-level hypotheses that can be taken forward into targeted validation studies. The integration of bioinformatics tools — GO/KEGG enrichment, PPI networks, WGCNA — within a single project illustrates the type of complete analytical pipeline we deliver for every discovery proteomics engagement.

Frequently Asked Questions

Q1: How do I choose between DIA, TMT, label-free, and SILAC for my project?

The choice depends on four factors: the number of samples, the sample type, the required proteome depth, and how you plan to use the data downstream. DIA (or 4D-DIA) is our default recommendation for most discovery projects because it produces very low missing-value rates and scales well to large cohorts — it is the best choice when sample numbers exceed 10–15 or when the dataset will feed into a biomarker validation pipeline. TMT is preferred when you need to compare multiple conditions (up to 16) within a single instrument run with high quantitative precision and minimal batch effects, and when deep coverage via offline fractionation is acceptable. Label-free works well for smaller experiments or when samples cannot be chemically labeled. SILAC is the right choice exclusively for actively dividing cell culture models where metabolic incorporation is feasible. If you describe your experimental design to our team, we will recommend the optimal approach and explain the tradeoffs in writing before project initiation.

Q2: How many proteins can I expect to identify and quantify in my samples?

Coverage depends strongly on sample type and workflow. In cell lines or tissue using DIA with standard 90–120 min gradients, we typically quantify 5,000–7,000 protein groups per sample. With 4D-DIA on the timsTOF HT, cell and tissue samples can reach 7,000–9,000 protein groups. For plasma and serum, standard protocols typically identify 300–600 proteins; depleted plasma using 4D-DIA expands this to 1,000–2,500 protein groups. TMT with offline fractionation routinely exceeds 7,000 proteins across fractions. These figures reflect median performance across our internal QC benchmarks on common matrices; actual numbers depend on biological complexity and sample quality. We provide expected coverage estimates for your specific sample type when you inquire.

Q3: What bioinformatics outputs are included in a standard discovery proteomics project?

Every discovery proteomics project includes: (1) raw MS data files in vendor format; (2) peptide and protein identification lists with scores, FDR values, and sequence coverage; (3) normalized protein quantification matrix; (4) statistical analysis — t-test or ANOVA, fold-change calculations, adjusted p-values (Benjamini-Hochberg), volcano plots, and a list of significantly regulated proteins; (5) exploratory data visualization — PCA, hierarchical clustering heatmap, correlation matrix; (6) GO biological process, GO molecular function, and KEGG pathway enrichment analysis with bubble plots; (7) STRING-based protein-protein interaction network visualization; (8) a methods section suitable for use in manuscript Materials and Methods; and (9) a project summary report. We can also include additional analyses such as protein domain/motif enrichment, tissue expression databases, or custom comparisons — discuss requirements when submitting your project request.

Q4: Can discovery proteomics results be directly used for biomarker validation, or is a separate targeted step required?

Discovery proteomics generates hypothesis-level protein abundance data suitable for candidate selection — it is the first phase of a biomarker research workflow, not the validation phase. To move from a DIA or TMT discovery dataset to validated protein biomarkers, a separate targeted quantification study (typically PRM or MRM) using stable-isotope-labeled standards and appropriate cohort sizes is required. We provide both phases under one project framework: our PRM Targeted Proteomics Analysis and Targeted Proteomics Services are designed as the natural downstream continuation of a discovery project, allowing you to transition from list-based candidate proteins to robust, quantitative assays for the proteins you have prioritized.

Q5: What are the QC checkpoints in a discovery proteomics project?

We apply QC checkpoints at every stage. At sample intake, protein concentration and integrity are assessed and a go/no-go decision is made before processing. During digestion, peptide yield is measured and compared to expected values. Before injection, iRT peptide standards are run to confirm column performance and gradient elution. During acquisition, instrument sensitivity, spray stability, and mass accuracy are monitored in real time. After database search, we report protein identification depth, peptide FDR, missed cleavage rate, precursor mass accuracy (target: ≤5 ppm), and inter-replicate Pearson correlation. Quantitative QC includes CV distribution across technical and biological replicates — we flag any replicate with an outlier CV profile before including it in the final report. A condensed QC summary is provided alongside every final dataset.

References

  1. Han S, Zhang J, Sun Y, et al. The plasma DIA-based quantitative proteomics reveals the pathogenic pathways and new biomarkers in cervical cancer and high grade squamous intraepithelial lesion. J Clin Med. 2022;11(23):7155. doi.org/10.3390/jcm11237155
  2. Meier F, Brunner AD, Frank M, et al. diaPASEF: parallel accumulation–serial fragmentation combined with data-independent acquisition. Nat Methods. 2020;17(12):1229-1236. doi.org/10.1038/s41592-020-00998-0
  3. Demichev V, Messner CB, Vernardis SI, Lilley KS, Ralser M. DIA-NN: neural networks and interference correction enable deep proteome coverage in high throughput. Nat Methods. 2020;17(1):41-44. doi.org/10.1038/s41592-019-0638-x
  4. Hughes CS, Foehr S, Garfield DA, Furlong EE, Steinmetz LM, Krijgsveld J. Ultrasensitive proteome analysis using paramagnetic bead technology. Mol Syst Biol. 2014;10(10):757. doi.org/10.15252/msb.20145625

GET STARTED

Design Your Discovery Proteomics Project Today

Tell us about your samples, your experimental groups, and what you want to learn. We will recommend the right platform — DIA, 4D-DIA, TMT, label-free, or SILAC — and provide a detailed project plan with expected coverage, timeline, and deliverables. Every project includes complete bioinformatics analysis and a publication-ready data report.

Ready to move from a biological question to a quantitative protein dataset?

Request a Customized Quote