Get Your Custom Quote

Online Inquiry

Protein & Antibody Array Services

High-throughput protein profiling across the full spectrum of array formats — from human proteome-scale autoantibody discovery and exposome reactivity mapping to functional protein interaction screening and semi-quantitative cytokine panels — enabling simultaneous measurement of hundreds to thousands of protein analytes from a single low-volume sample.

Research Use Only (RUO) Notice: All services and data provided are strictly for non-clinical research purposes. Our analytical results are not intended for clinical diagnosis, patient management, or therapeutic decision-making.

Services Technologies Demo Case Study FAQ Related Services

CORE SERVICE

Array-Based Protein Profiling — High-Throughput, Low-Input, Multiplexed Analysis

Mass spectrometry-based proteomics excels at unbiased discovery across the full proteome, but array-based protein profiling occupies a complementary and in many applications superior niche: when your question is about a defined set of proteins, antigens, or analytes, and you need to screen them across many samples simultaneously with minimal sample consumption, protein and antibody arrays deliver throughput and sensitivity that LC-MS/MS workflows cannot match.

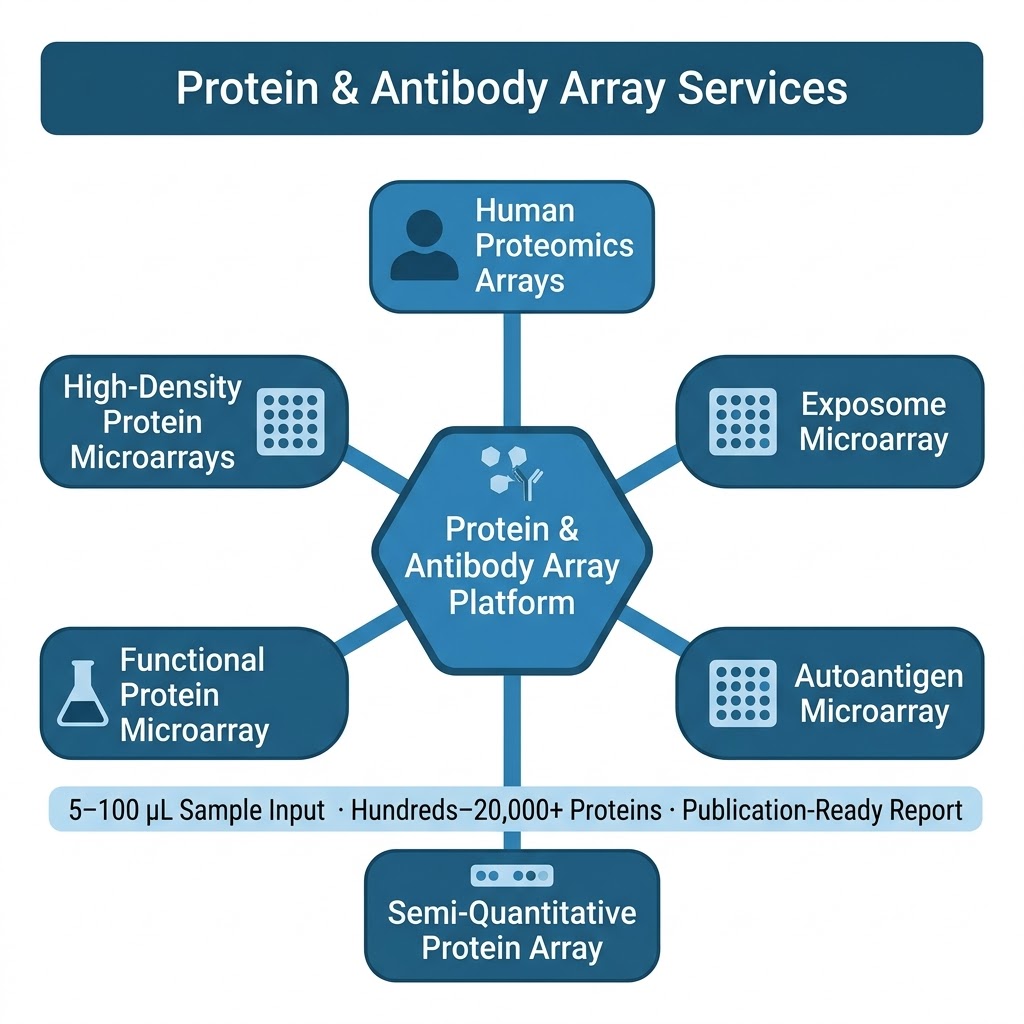
Our Protein & Antibody Array Services cover six distinct array formats, each designed for a specific class of biological question — from proteome-wide autoantibody discovery using arrays bearing over 20,000 full-length human proteins, to focused semi-quantitative cytokine and growth factor profiling from 10–50 μL plasma, to functional screening of protein-protein, protein-lipid, and protein-small molecule interactions on arrays of purified recombinant proteins. All formats are available as fully managed CRO services: you ship samples, we handle array processing, imaging, data extraction, normalization, and statistical analysis, and deliver a publication-ready report.

  • Proteome-scale or targeted: Array formats span from >20,000-protein full human proteome coverage (HuProt-format arrays) to custom 40–1,000 analyte panels, giving you the right resolution for discovery or validation phases.
  • Minimal sample input: Most array formats require only 10–100 μL serum, plasma, or cell lysate per sample — enabling rare sample types, longitudinal cohorts, and pediatric or biopsy-scale biospecimens that cannot support LC-MS/MS workflows.
  • High sample throughput: Array formats support screening of 10–500+ samples per project. Cohort-scale autoantibody screening, cross-sectional biomarker studies, and multi-group exposure profiling are all feasible within a single project engagement.
Protein and antibody array services overview — human proteome microarray autoantigen exposome functional array formats

Six array formats covering discovery to validation, autoimmunity to functional proteomics

Array Service Portfolio — Six Formats, One Platform

Each format below addresses a distinct experimental question. Click through to the dedicated service page for array specifications, sample requirements, analyte lists, deliverables, and application examples.

Human Proteomics Arrays

High-density arrays bearing >19,000 full-length human proteins in duplicate, covering the majority of the human proteome. Probe with patient serum, plasma, or cell lysate to detect IgG and IgM autoantibodies or protein-binding events across the entire human proteome simultaneously. The gold standard for discovery-phase serological biomarker research, tumor-associated antigen (TAA) identification, and proteome-wide binding partner screening — requiring only 20–30 μL serum per sample.

Exposome Microarray

Arrays displaying hundreds of environmental, microbial, dietary, and chemical antigens — enabling simultaneous profiling of IgG and IgM antibody reactivity to a broad panel of exposure-associated antigens in a single serum or plasma sample. Designed for exposome research, environmental epidemiology, allergy and hypersensitivity studies, and occupational health research requiring large-cohort, multi-antigen serology with minimal sample volume.

Autoantigen Microarray

Focused arrays of validated autoantigens — including nuclear antigens (ANA panel), extractable nuclear antigens (ENA), tissue-specific antigens, and disease-associated antigen panels — for profiling the autoantibody repertoire in autoimmune diseases, cancer immunology, and treatment-induced autoimmunity studies. Enables simultaneous detection of dozens to hundreds of autoantibody specificities from a single 5–10 μL serum sample.

Semi-Quantitative Protein Array

Capture-based antibody arrays for multiplexed profiling of cytokines, chemokines, growth factors, angiogenesis regulators, and other secreted proteins from serum, plasma, cell culture supernatant, and tissue lysate. Enables simultaneous relative quantification of 40–1,000+ analytes from 50–500 μL sample volume — ideal for inflammatory signature profiling, drug response monitoring, and pathway activity screening without prior knowledge of which analytes are regulated.

Functional Protein Microarray

Arrays of purified recombinant proteins used to screen functional interactions at the protein level: protein-protein interactions, protein-lipid binding, protein-nucleic acid interactions, kinase substrate specificity, protein-drug binding, and post-translational modification site mapping using purified modification enzymes. Covers yeast and human proteome-scale functional arrays as well as custom sub-arrays for targeted interaction screening.

High-Density Protein Microarrays

Ultra-high-density arrays with spot counts ranging from thousands to tens of thousands of proteins per slide, enabling comprehensive proteome-scale coverage within a single hybridization. Particularly suited to systems-level protein interaction mapping, cross-species comparative proteomics, and large-library screening campaigns where coverage depth is the primary requirement — with dual-color fluorescence or chemiluminescence detection for maximum dynamic range.

Array Technology Platform & Workflow

Array Design & Fabrication

Protein arrays used in our platform are fabricated by contact printing or non-contact inkjet deposition of purified recombinant proteins (human full-length, GST-tagged or His-tagged), antibody capture probes, or antigen libraries onto nitrocellulose-coated or epoxy-functionalized glass slides. Protein identity and purity are verified by SDS-PAGE and western blot before array production. Arrays are printed in duplicate (minimum) per protein spot to enable within-array reproducibility assessment. Slide batches are quality-controlled for signal uniformity, background fluorescence, and positive control performance before use in client projects. For custom antigen arrays (autoantigen panels, custom cytokine arrays), we support array design consultation based on your disease indication, sample matrix, and desired analyte coverage.

Sample Probing & Detection

Array probing protocols are adapted to each format. For serum/plasma autoantibody profiling (human proteome, autoantigen, exposome arrays): slides are blocked with BSA-containing buffer, then incubated with diluted serum or plasma (typically 1:100–1:500 dilution in blocking buffer) for 1–2 h at room temperature, followed by secondary antibody (anti-human IgG-Cy3, anti-human IgM-Cy5, or both simultaneously for dual-isotype profiling). For capture antibody arrays (semi-quantitative cytokine/growth factor panels): sample lysate or conditioned medium is incubated on the array, and detected by a biotinylated detection antibody cocktail followed by streptavidin-conjugated fluorophore. For functional protein arrays: purified protein probes (kinases, lipid vesicles, labeled small molecules, or cell lysates) are applied directly to the array surface at defined concentrations, and retained interactions are detected by direct fluorescence or sandwich detection.

Imaging, Normalization & Bioinformatics

Arrays are scanned on a high-resolution dual-channel fluorescence microarray scanner (Agilent SureScan or equivalent) at multiple gain settings to maximize dynamic range. Raw signal intensities are extracted using GenePix Pro or equivalent software, with automatic flagging of saturated spots, morphological outliers, and spots failing duplicate-concordance thresholds. Data normalization applies array-wide median centering, spike-in control normalization (for cross-slide comparisons), and log2 transformation before statistical analysis. Differential analysis between groups uses t-test or limma (for small sample sizes), with Benjamini-Hochberg FDR correction. Deliverables include: raw data files, normalized intensity matrices, differential protein lists with statistical annotations, heatmaps, volcano plots, and — for autoantibody arrays — ROC analysis and AUC values for candidate biomarker antigens. All analysis is provided with a publication-ready methods section.

Standard Array Service Workflow

Step 1 — Project Consultation & Array Selection: We review your research question, sample type, sample number, available volume, and downstream analysis goals to recommend the optimal array format and panel. For autoantibody discovery projects, we advise on cohort design (case-control ratio, matching criteria, sample size for adequate statistical power). For functional array projects, we discuss probe protein selection, interaction assay design, and appropriate controls.

Step 2 — Sample Receipt & QC: Samples are received at −80 °C, logged, and assessed for protein concentration (lysates: BCA), hemolysis (serum/plasma: visual check and A414/A280 ratio), and freeze-thaw cycle history. Samples failing quality thresholds are flagged before processing. A minimum sample volume reserve is maintained for repeat assays if needed.

Step 3 — Array Processing: Slides are blocked, probed with patient samples (or interaction probes for functional arrays) under standardized incubation conditions (humidity chamber, temperature-controlled, timed protocols), washed to remove non-specific signal, and processed with secondary detection reagents. Positive and negative control slides are included in every run to confirm assay performance. All steps are performed under subdued light to minimize fluorophore bleaching.

Step 4 — Scanning & Raw Data Extraction: Arrays are scanned at optimized gain settings (typically two-channel: Cy3 and Cy5) on a calibrated scanner. Raw TIFF images and GenePix Results (GPR) files are archived. Spot morphology, signal-to-noise ratio, and duplicate reproducibility (r >0.95 within-slide) are checked before data release to the analysis pipeline.

Step 5 — Data Analysis & Reporting: Normalized data matrices are processed for differential analysis, biomarker ranking, and pathway annotation. For autoantibody discovery: ROC curves and AUC values are generated for each candidate antigen; multi-antigen panel models are evaluated by logistic regression or machine learning classifiers (random forest, LASSO). For cytokine/growth factor arrays: fold-change heatmaps, pathway enrichment, and cross-group comparison bubble plots. All deliverables include a project report with publication-ready methods text and key findings summary.

Sample Requirements by Array Format

Array Format Sample Types Accepted Minimum Volume / Input per Sample Key Pre-Collection Requirements
Human Proteomics Arrays Serum, plasma (EDTA or heparin), cell lysate 20–30 μL serum/plasma; ≥100 μg protein for lysates Collect in SST (serum) or EDTA (plasma) tubes; centrifuge within 30 min; aliquot to 50–100 μL; store at −80 °C; avoid repeated freeze-thaw; hemolyzed samples rejected
Exposome Microarray Serum, plasma 10–20 μL per sample Same as above; document collection date and any recent vaccinations or infections that may confound antibody background
Autoantigen Microarray Serum, plasma, CSF 5–10 μL serum/plasma; ≥50 μL CSF Standard serum/plasma collection requirements; for CSF: centrifuge to remove cells, aliquot, store at −80 °C; ship on dry ice
Semi-Quantitative Protein Array Serum, plasma, cell culture supernatant, tissue/cell lysate, urine, CSF 50–500 μL serum/plasma; ≥200 μg protein for lysates; ≥1 mL urine For cytokine profiling: collect serum within 1 h of blood draw; centrifuge immediately; avoid prolonged clotting time which elevates platelet-derived factors. For lysates: use RIPA or NP-40 lysis buffer; measure protein concentration before submission
Functional Protein Microarray Purified protein probes, cell lysate, labeled small molecules, lipid vesicles ≥50 μg purified protein or ≥200 μg total lysate protein Provide protein in non-denaturing buffer at ≥0.5 μg/μL; specify labeling (fluorescent, biotin, or label-free detection); confirm absence of blocking agents (BSA, casein) in probe buffer
High-Density Protein Microarrays Serum, plasma, purified antibody, cell lysate 20–50 μL serum/plasma; ≥1 μg purified antibody Same as human proteomics arrays; for purified antibody probes, provide concentration and buffer composition; fluorescent pre-labeling available upon request

Cohort-scale projects (≥20 samples per group) are strongly recommended for discovery-phase autoantibody or exposome studies to provide adequate statistical power for biomarker ranking. Contact us for power calculation guidance and sample size recommendations specific to your study design.

Representative Array Profiling Data

The following illustrate the types of outputs generated by our human proteomics array and semi-quantitative protein array workflows — from autoantibody discovery scatter plots and differential heatmaps to ROC-based biomarker evaluation.

Human proteome microarray scatter plot — IgG autoantibody signal intensities disease vs control serum, tumor-associated antigen discovery

Fig. 1 — Human proteome microarray scatter plot comparing IgG autoantibody signal intensities between disease serum (x-axis) and healthy control serum (y-axis) across >19,000 protein spots. Proteins with significantly elevated reactivity in disease samples (upper-left quadrant, above fold-change threshold) represent candidate tumor-associated autoantibody targets for downstream ELISA validation.

Protein array heatmap — semi-quantitative cytokine growth factor profiling, differential expression between treatment groups

Fig. 2 — Semi-quantitative protein array heatmap showing relative abundance of 120 cytokines and growth factors across six sample groups (3 conditions × 2 biological replicates). Hierarchical clustering identifies co-regulated cytokine clusters; significantly elevated analytes in each group are annotated. Fold-change and p-value thresholds applied: FC ≥1.5, p ≤0.05.

Autoantibody biomarker ROC curves — AUC comparison for individual and panel TAAb candidates from human proteome microarray discovery

Fig. 3 — ROC curves for individual and panel autoantibody biomarker candidates identified by human proteome microarray discovery and validated by ELISA. Individual TAAb AUCs (0.62–0.76) are shown alongside the multi-antigen logistic regression panel (AUC 0.83), illustrating the diagnostic lift achieved by combining complementary autoantibody signals — a standard deliverable for autoantibody biomarker discovery projects.

CASE STUDY

Human Proteome Microarray Screening Identifies a Six-Autoantibody Panel for Hepatocellular Carcinoma Detection with AUC 0.835 across 1,625 Serum Samples

Yang Q, Ye H, Sun G et al., Molecular Oncology 17(5):887–900, May 2023 — DOI: 10.1002/1878-0261.13371

Background & Purpose

Hepatocellular carcinoma (HCC) is among the most lethal cancers globally, with poor prognosis attributable largely to late-stage diagnosis. Alpha-fetoprotein (AFP), the standard serum biomarker, has well-documented sensitivity limitations — missing a substantial fraction of early-stage cases. The humoral immune system generates autoantibodies against tumor-associated antigens (TAAs) months to years before clinical presentation, creating a window for early detection that serum autoantibody profiling can exploit. Yang et al. aimed to identify novel autoantibody biomarkers for HCC by screening patient and healthy control sera across the full human proteome using a high-density protein microarray, then validating the top candidates in a large multi-disease cohort.

Methods

In the discovery phase, sera from 30 HCC patients and 22 normal controls (NCs) were probed on Human Proteome Microarrays bearing >19,000 full-length human proteins. IgG autoantibody signal intensities were compared between HCC and NC groups; candidate TAAs were ranked by fold-change and statistical significance. Fifteen antigens with significantly elevated IgG reactivity in HCC sera were selected for validation. Validation proceeded through two stages: first-round ELISA screening in an independent cohort of 240 HCC and NC samples; and large-scale multi-stage validation by ELISA across a total of 1,625 serum samples from six disease groups — NCs, HCC, liver cirrhosis (LC), chronic hepatitis B (CHB), gastric cancer (GC), esophageal cancer (EC), and colorectal cancer (CRC). Eight of the 15 candidate TAAs passed all validation stages. A multi-antigen immunodiagnostic model was constructed by binary logistic regression using the validated autoantibody set.

Results Overview

Of the 15 candidate TAAs identified by microarray discovery, eight demonstrated consistently elevated autoantibody reactivity in HCC relative to NCs across all validation cohorts. Logistic regression modeling identified a panel of six autoantibodies (against RAD23A, CAST, RUNX1T1, PAIP1, SARS, and PRKCZ) as the optimal multi-marker model. This six-TAAb panel achieved an AUC of 0.835 in the training set and 0.788 in the validation set for distinguishing HCC from NCs, substantially outperforming AFP alone (AUC 0.695 in the same cohort). The panel also demonstrated meaningful specificity relative to other gastrointestinal and hepatic diseases (liver cirrhosis, chronic hepatitis B, gastric cancer, esophageal cancer, colorectal cancer), supporting potential clinical research utility in differential diagnostic contexts. Serial serum samples from HCC model mice showed a progressive increase in autoantibody titers during hepatocarcinogenesis, indicating that these autoantibodies arise early in the disease process — consistent with their utility for early detection research.

Human Proteome Microarray workflow for HCC autoantibody discovery — Figure 1 Yang et al 2023 Molecular Oncology

Fig. 1 from Yang et al. 2023 — Experimental workflow: Human Proteome Microarray discovery in 30 HCC + 22 NC sera → 15 candidate TAAs → multi-stage ELISA validation across 1,625 samples → 6-TAAb logistic regression model. Source: doi.org/10.1002/1878-0261.13371 (CC BY 4.0)

Human proteome microarray scatter plot HCC vs normal serum IgG autoantibodies — 15 candidate TAAs identified Figure 2 Yang 2023

Fig. 2 from Yang et al. 2023 — Microarray scatter plot of IgG autoantibody intensities in HCC vs. NC sera, with 15 candidate TAA antigens highlighted above significance thresholds. Source: doi.org/10.1002/1878-0261.13371 (CC BY 4.0)

ROC curve 6-TAAb panel AUC 0.835 HCC vs normal — logistic regression diagnostic model validation Figure 4 Yang 2023

Fig. 4 from Yang et al. 2023 — ROC curve for the six-autoantibody panel (RAD23A, CAST, RUNX1T1, PAIP1, SARS, PRKCZ) in HCC detection: AUC 0.835 (training set) and 0.788 (validation set) versus AFP alone (AUC 0.695). Source: doi.org/10.1002/1878-0261.13371 (CC BY 4.0)

Conclusion & Relevance to Our Service

This study illustrates the complete discovery-to-validation pipeline that our Human Proteomics Array service enables: a single microarray experiment in a small discovery cohort identified 15 candidate antigens from >19,000 proteins — a screening scale that no antibody-based single-plex assay or small custom panel could achieve. The subsequent validation in 1,625 samples and construction of a multi-antigen diagnostic model represents the natural downstream continuation, demonstrating that microarray-discovered autoantibodies can produce clinically meaningful panel AUC values. Whether your research targets HCC, lung cancer, autoimmune disease, or any other indication where serological biomarkers are sought, our Human Proteomics Array service provides the proteome-wide discovery resolution needed to find the right antigens — with the low sample volume requirements (20–30 μL per serum) that make large cohort screening feasible.

Frequently Asked Questions

Q1: How do I choose between the Human Proteomics Array and the Autoantigen Microarray for an autoimmune disease study?

The choice depends primarily on your prior knowledge of relevant antigens. If you are in the discovery phase — you do not know which antigens are targeted by the autoantibody response in your disease, and you want to identify novel autoantigens without bias — the Human Proteomics Array is the right tool: it covers >19,000 human proteins and will detect autoantibodies against any of them simultaneously. If you already know the relevant antigen categories for your disease (for example, ANA/ENA antigens in lupus or rheumatoid arthritis, citrullinated antigens in RA, myositis-specific antigens in inflammatory myopathies) and you want to profile the breadth and titer of the established autoantibody repertoire across a cohort, the Autoantigen Microarray is more efficient — it uses a focused, validated antigen panel at lower cost per sample and is better suited to cohort-scale screening of known specificities.

Q2: What sample size (number of patients) is recommended for a discovery-phase autoantibody study?

For initial discovery on the Human Proteomics Array or High-Density Array, a minimum of 10–15 cases and 10–15 matched controls per group is required to achieve statistical filtering of candidate antigens — this is the discovery cohort, not the validation cohort. Results from this stage generate a shortlist of 10–50 candidate antigens, which must then be validated by ELISA or targeted array in an independent cohort of ≥50 cases and ≥50 controls per group to assess true sensitivity and specificity. For biomarker panel development with ROC analysis, the final validation cohort should include ≥100 cases per group for meaningful AUC confidence intervals and should include disease mimics (conditions with similar clinical presentation) as comparator groups to evaluate specificity. We provide power calculation guidance and cohort design consultation as part of our project initiation process — please request this when submitting your project inquiry.

Q3: Can the Semi-Quantitative Protein Array measure absolute protein concentrations?

No — our Semi-Quantitative Protein Array provides relative abundance values (signal intensities normalized within and across arrays) that allow comparison between sample groups — for example, identifying which cytokines are significantly higher in treated versus untreated conditions — but not absolute concentrations in pg/mL. This is appropriate for the most common use case: identifying which proteins are regulated without prior knowledge of which subset to target. If you require absolute quantification of a defined set of proteins (e.g., confirmed cytokine concentrations for pharmacokinetic or dose-response analysis), our PRM Targeted Proteomics service or multiplexed ELISA provide quantitative measurement with defined LOD/LOQ and calibration curves. For plasma protein profiling combining discovery breadth with quantitative depth, our Olink Proteomics Analysis Service also provides absolute-scaled NPX units across up to 1,500 proteins.

Q4: How does the Functional Protein Microarray differ from a co-immunoprecipitation or BioID experiment?

The Functional Protein Microarray presents thousands of purified recombinant proteins in parallel on a slide surface and screens them all simultaneously against a single labeled probe — a purified protein, a cell lysate, a kinase, a lipid, or a small molecule. This is a cell-free, in vitro binding assay performed on a fixed protein library, which means it can identify direct binding partners without the cellular context or proximity bias that cell-based methods like co-IP and BioID introduce. Its advantages: it covers proteome-scale binding space in a single experiment and works with any probe that can be labeled or detected; its limitation is that it tests interactions outside the native cellular environment, so it will not capture interactions requiring post-translational modification, cofactors, or protein complex formation. Co-IP and BioID are complementary: they operate in living cells and capture endogenous, modification-dependent interactions. For a complete interaction landscape, combining functional array screening (broad, cell-free, direct binding) with co-IP or BioID (in-cell, endogenous, context-dependent) provides the most comprehensive picture.

Q5: Can I submit samples from different time points or treatment arms for the same project?

Yes — all our array formats support multi-condition project designs including time-course experiments (baseline, 1 h, 6 h, 24 h post-treatment), dose-response comparisons (multiple drug concentrations), and longitudinal cohorts (pre-treatment, on-treatment, post-treatment serum). For time-course and multi-arm designs, all samples are processed in a single array run batch whenever possible to minimize batch effects. When sample numbers exceed a single batch capacity, we apply reference sample normalization (a pooled reference sample is run on every batch) to enable cross-batch comparison. Please specify your experimental design — number of groups, time points, replicates, and expected comparisons — at project initiation so we can confirm the most appropriate batch layout and normalization strategy.

References

  1. Yang Q, Ye H, Sun G, et al. Human Proteome Microarray identifies autoantibodies to tumor-associated antigens as serological biomarkers for the diagnosis of hepatocellular carcinoma. Mol Oncol. 2023;17(5):887-900. doi.org/10.1002/1878-0261.13371
  2. Li S, Song G, Bai Y, et al. Applications of protein microarrays in biomarker discovery for autoimmune diseases. Front Immunol. 2021;12:645632. doi.org/10.3389/fimmu.2021.645632
  3. Zhu H, Bilgin M, Bangham R, et al. Global analysis of protein activities using proteome chips. Science. 2001;293(5537):2101-2105. doi.org/10.1126/science.1062191
  4. Michaud GA, Salcius M, Zhou F, et al. Analyzing antibody specificity with whole proteome microarrays. Nat Biotechnol. 2003;21(12):1509-1512. doi.org/10.1038/nbt910

GET STARTED

Design Your Protein Array Project Today

Tell us your research question, sample type and volume, number of samples, and the proteins or antigen categories you are targeting. We will recommend the right array format, advise on cohort design and statistical power, and provide a detailed project plan with expected throughput, timeline, and complete deliverables.

From proteome-wide autoantibody discovery to focused cytokine profiling — one platform, six formats, fully managed.

Request a Customized Quote