Integrative Analysis Services of Proteomics and Phosphoproteome
What is the Phosphoproteome?
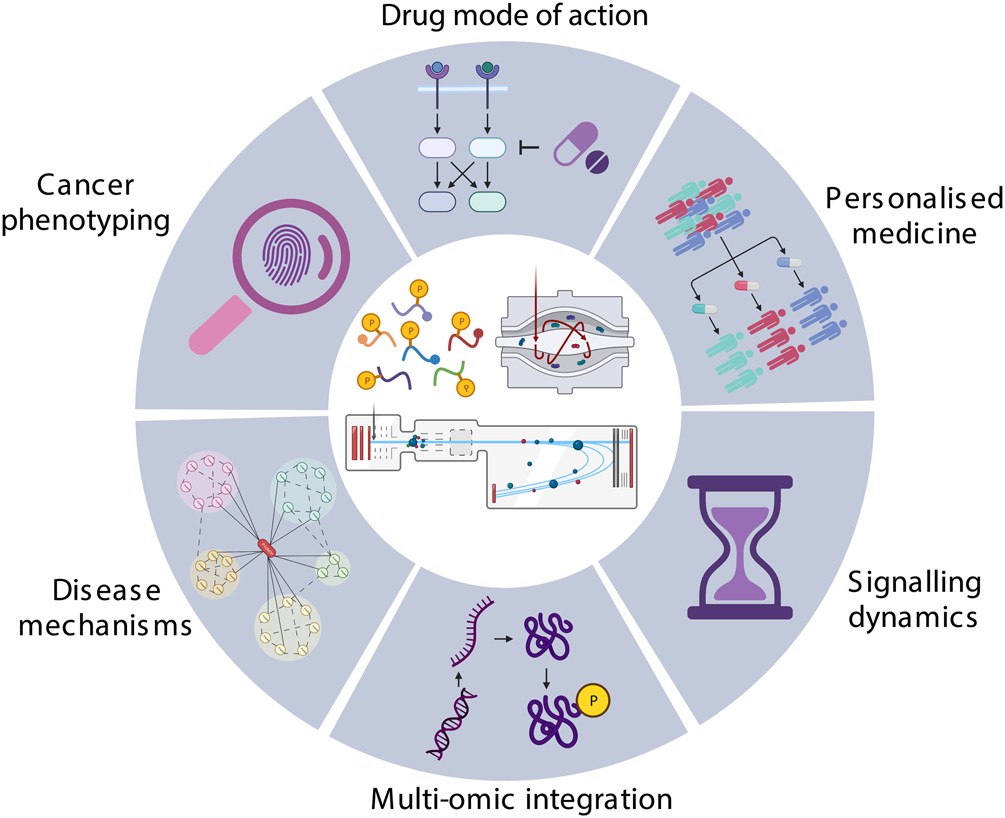
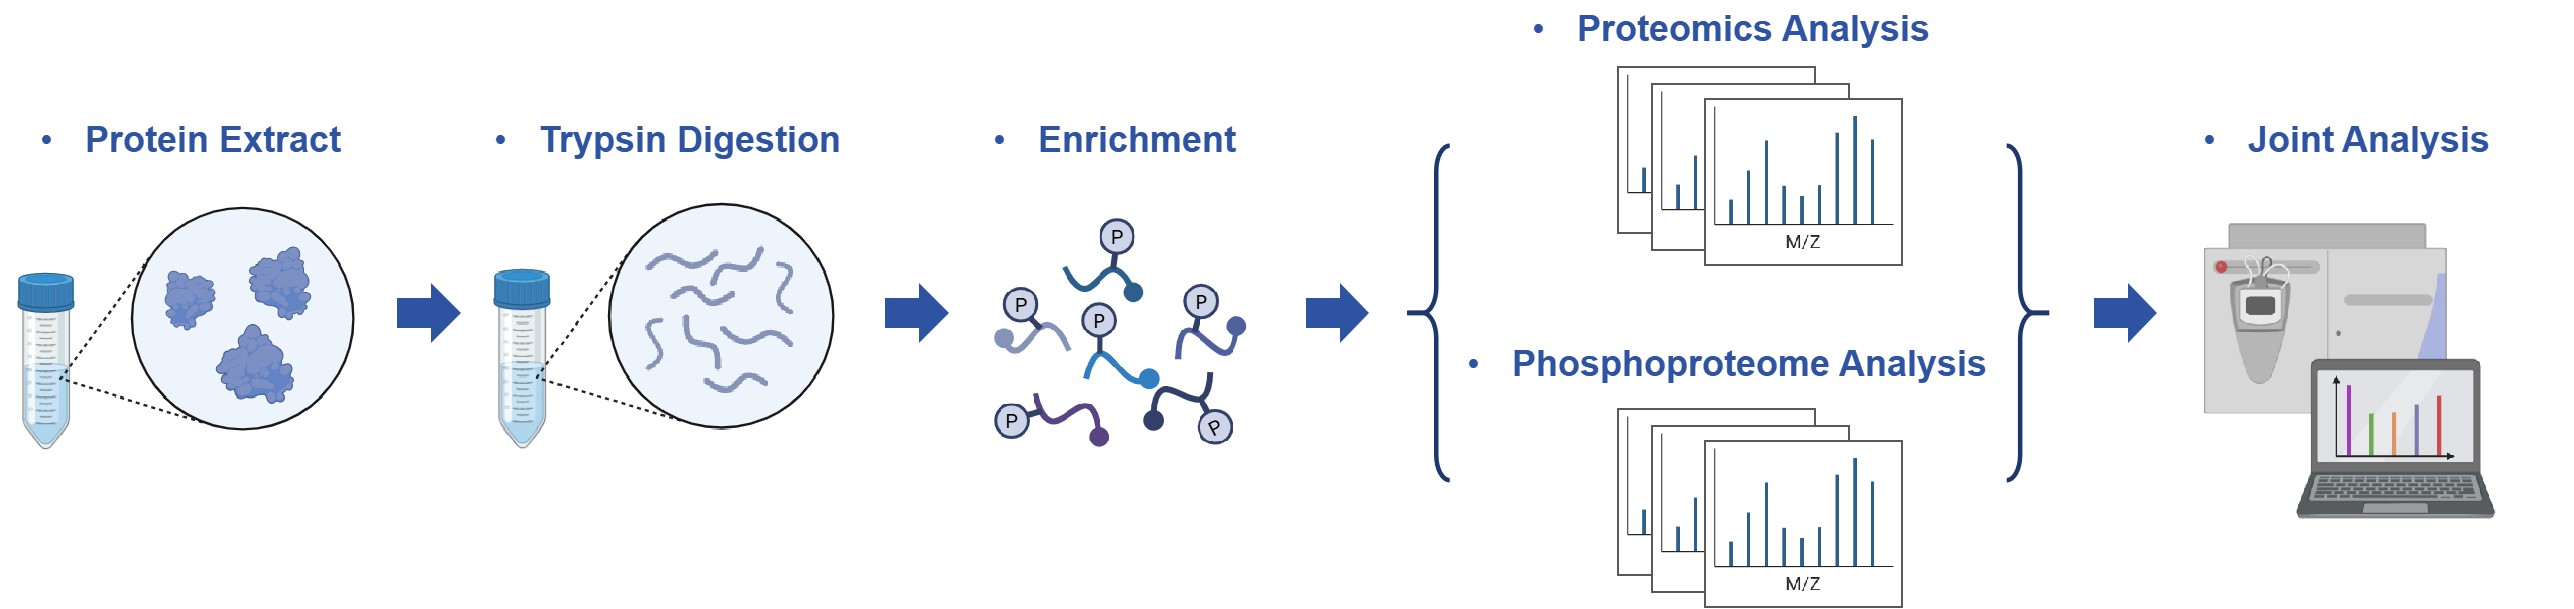
Proteins are the central executors of biological processes, and their regulation often depends on chemical modifications. Among these, phosphorylation represents one of the most dynamic and reversible events. Proteomics provides a global view of protein abundance, while phosphoproteomics reveals signaling activity by identifying phosphorylation events. Integrating these two dimensions enables researchers to understand cellular regulation's static and dynamic layers.
The phosphoproteome refers to the complete set of phosphorylated proteins in a cell, tissue, or organism at a given time. Phosphorylation is catalyzed by kinases and reversed by phosphatases. This reversible modification alters protein conformation, stability, localization, and interaction networks. Unlike total proteomics, which focuses on protein expression levels, phosphoproteomics highlights functional regulation within signaling pathways. Because phosphorylation is tightly linked to cellular responses such as proliferation, apoptosis, and immune activation, the phosphoproteome provides essential information about the dynamic state of biological systems.

Figure 1. Application of phosphoproteomics in cancer research (Higgins L, et al., 2023).
Why is Proteomics and Phosphoproteome Integrative Analysis Necessary?
Integrating proteomics with phosphoproteomics is critical because protein expression alone does not fully explain functional activity. Many signaling pathways operate independently of protein abundance, relying instead on phosphorylation switches. For example, a kinase may remain at stable expression levels but exhibit increased activity through phosphorylation at specific residues. Without phosphoproteomic data, such regulatory events would remain hidden. Therefore, combining proteome and phosphoproteome analysis is essential for:
- Mapping active signaling networks.
- Identifying key regulators in disease progression.
- Evaluating therapeutic targets and drug responses.
- Revealing functional modifications that control protein behavior.
Advanced Technologies for Proteomics and Phosphoproteome Integrative Analysis
High-Resolution Mass Spectrometry (MS)
- Utilizes Orbitrap and Q-TOF platforms for deep proteome and phosphoproteome profiling.
- Achieves site-specific phosphorylation identification with sub-ppm mass accuracy.
Phosphopeptide Enrichment Strategies
- TiO₂ and IMAC enrichment improve detection sensitivity for low-abundance phosphopeptides.
- Ensures confident identification of transient and signaling-relevant phosphorylation events.
Quantitative Labeling Techniques
- TMT, iTRAQ, and SILAC for multiplexed protein and phosphosite quantification.
- Label-free quantification (LFQ) for flexible experimental designs.
Bioinformatics Integration
- Integrates proteomic and phosphoproteomic datasets into comprehensive pathway maps.
- Uses kinase-substrate network modeling to uncover functional mechanisms.
Advantages of Our Proteomics and Phosphoproteome Integrative Analysis
- Comprehensive Coverage: Detection of thousands of proteins and phosphorylation sites.
- High Sensitivity: State-of-the-art MS and optimized enrichment protocols ensure deep coverage.
- Quantitative Precision: Label-based and label-free quantification strategies tailored to project needs.
- Pathway-Level Insights: Bioinformatics integration highlights functional and disease-relevant networks.
- Customizable Solutions: Services adapted for basic research, drug discovery, and translational studies.
Workflow for Proteomics and Phosphoproteome Integrative Analysis

Deliverables and Reporting Standards
Creative Proteomics ensures that results are both detailed and actionable. Deliverables include:
- Lists of identified proteins and phosphorylation sites.
- Quantitative comparisons across conditions or treatments.
- Pathway and network enrichment analyses.
- Data visualization formats include heatmaps, volcano plots, and signaling maps.
- Comprehensive reports designed for publication and regulatory submission.
Applications of Proteomics and Phosphoproteome Integrative Analysis
- Mapping Cellular Signaling Pathways: Phosphorylation is a key regulatory mechanism in cell communication. Integrating proteomic and phosphoproteomic data enables precise identification of activated signaling pathways and their downstream effectors.
- Biomarker Discovery and Validation: Phosphoproteomic profiling complements global proteomics by highlighting phosphorylation events associated with disease states. Integrative analysis facilitates the identification of candidate biomarkers for early diagnosis, prognosis, and therapeutic monitoring.
- Drug Target Identification and Mechanism of Action: Phosphorylation changes often reflect drug-induced modulation of signaling networks. Combining proteomic and phosphoproteomic insights helps to map drug targets, evaluate pathway activation, and characterize off-target effects.
- Cancer Research and Precision Medicine: Aberrant phosphorylation drives tumor initiation and progression. Integrative analysis reveals dysregulated kinases, receptor activity, and altered signaling cascades in cancer.
- Systems Biology and Network Modeling: The combined dataset from proteomics and phosphoproteomics enhances systems-level modeling of protein networks. Reconstructing pathway dynamics can predict molecular interactions, regulatory feedback loops, and disease-associated network disruptions.
Simple Requirements
Requirement Category | Details |
Sample Type | Accepts a wide range of biological samples, including tissues, cells, plasma, serum, urine, and other biofluids. |
Sample Quantity | Typically ≥ 100 μg of total protein per sample for proteomics; specific amounts may vary based on project design. |
Sample Quality | Samples should be free from contaminants such as salts, detergents, and nucleic acids to ensure accurate phosphoproteomic profiling. |
Sample Storage | Store samples at −80 °C to maintain protein and phosphorylation integrity. Avoid repeated freeze-thaw cycles. |
Shipping Conditions | Ship samples on dry ice with proper labeling and secure packaging to prevent degradation during transit. |
Why Choose Creative Proteomics
- Proven expertise. We have rich experience in proteomics and phosphoproteomics. Our scientists have worked with academic labs, biotech firms, and pharmaceutical companies.
- Advanced instrumentation. We operate high-resolution mass spectrometers and modern liquid chromatography systems that increase sensitivity and improve site-level confidence.
- Tailored experimental design. Our team creates study plans that match your hypothesis and sample constraints. We recommend input amounts, enrichment strategies, and quantitative methods that suit your goals.
- Rigorous quality control. We include technical replicates and appropriate controls. We report QC metrics such as peptide identification rates and instrument performance.
- Integrated data analysis. Our analysts perform site mapping, pathway enrichment, and kinase-substrate network analysis. We present results in clear tables and intuitive figures.
- Clear deliverables. We deliver raw data, processed tables, annotated phosphosite lists, and publication-ready figures. Files are provided in common formats (Excel, CSV, image files) and with explanatory notes.
FAQ
-
Q1: What is the difference between proteomics and phosphoproteomics?
A1: Proteomics involves the large-scale study of proteins, particularly their functions and structures. It provides a comprehensive analysis of the protein content in a biological sample. Phosphoproteomics, on the other hand, focuses specifically on identifying and characterizing proteins that have undergone phosphorylation. This post-translational modification is crucial in regulating protein function and cellular signaling.
-
Q2: Can integrative proteomics detect low-abundance phosphoproteins?
A2: Advanced enrichment strategies (TiO₂, IMAC) combined with high-resolution mass spectrometry allow sensitive detection of low-abundance phosphoproteins that may be critical for signaling pathways or disease mechanisms.
-
Q3: What are the common methods for phosphopeptide enrichment?
A3: Several strategies are employed to enrich phosphopeptides from complex biological samples:
- IMAC (Immobilized Metal Affinity Chromatography): Utilizes metal ions to bind phosphopeptides, enriching them for subsequent analysis selectively.
- TiO₂ (Titanium Dioxide) Chromatography: Offers high specificity for phosphorylated peptides, minimizing non-specific binding.
- Fe-NTA (Iron-Nitrilotriacetic Acid): Provides low non-specific binding, making it suitable for complex sample analysis.
-
Q4: What is the difference between site-specific and global phosphorylation analysis?
A4: Site-specific analysis identifies the exact amino acid residue phosphorylated, allowing detailed mapping of signaling networks. Global phosphorylation analysis provides an overview of phosphorylation levels across all proteins but does not resolve individual sites. Integrating both approaches improves pathway interpretation.
-
Q5: What bioinformatics analyses are typically performed after integrative profiling?
A5: Pathway and Gene Ontology (GO) enrichment analysis.
Kinase-substrate network prediction.
Protein-protein interaction (PPI) network mapping.
Temporal or condition-specific phosphorylation dynamics.
Integration with transcriptomics or metabolomics for multi-omics insights.
-
Q6: Can integrative proteomics and phosphoproteomics be applied to non-mammalian systems?
A6: Yes. Enrichment strategies and mass spectrometry workflows are compatible with plant, microbial, and model organism samples, enabling cross-species signaling studies.
Demo
Demo: Integrated proteome and phosphoproteome analysis of gastric adenocarcinoma reveals molecular signatures capable of stratifying patient outcome
Tumor vs. adjacent tissue profiling integrated global protein abundance with site-specific phosphorylation to define prognostic signatures in gastric adenocarcinoma.

Figure 2. Quantitative proteomic comparison of tissues between GAC patients with and without LNM (Lu X, et al., 2022).

Figure 3. Phosphoproteomic comparison of tissues between GAC patients with and without LNM (Lu X, et al., 2022).

Figure 4. KEGG pathways of upregulated proteins, phosphoproteins, and abnormal activity kinases (Lu X, et al., 2022).
-
Case Study
Case: Integrated proteome and phosphoproteome analysis of gastric adenocarcinoma reveals molecular signatures capable of stratifying patient outcome
Abstract:
Naive T cells reside in quiescence and exit quiescence upon antigen stimulation. Transcriptional measurements alone do not fully predict protein-level responses, and phosphorylation acts as a rapid, reversible signaling regulator. Therefore, simultaneous temporal profiling of the proteome and phosphoproteome is required to reconstruct signaling networks that drive T cell activation. To generate a temporal, integrative proteomic and phosphoproteomic atlas of naive mouse T cell activation and to use that multi-layer dataset to infer kinase-transcription factor (TF) networks and identify bioenergetic pathways critical for quiescence exit. The authors also sought functional validation of key predictions.
Methods
- Naive mouse T cells were stimulated with anti-CD3/anti-CD28 and sampled at multiple time points (0, 2, 8, 16 h).
- Tandem Mass Tag (TMT) multiplexed labeling was used for quantitative proteomics.
- Deep LC/LC-MS/MS profiled the global proteome and an enriched phosphopeptide fraction from the same pooled samples.
- Bioinformatics pipelines integrated time-series proteome and phosphoproteome data with TF-target and kinase-substrate databases to reconstruct regulatory networks.
- Key predictions were functionally tested by genetic perturbation (e.g., COX10 knockout) and pharmacology.
Results
- The authors quantified ~8,400 proteins and ~13,700 phosphopeptides with high confidence. Early (2 h) responses were dominated by phosphorylation dynamics, whereas later time points (8–16 h) showed large changes in protein abundance.
- Integrative clustering revealed co-expression modules linking translation, mitochondrial function (mitoribosomes, complex IV), and metabolic pathways to T cell activation.
- Kinase-activity inference identified dynamic rewiring of kinase signaling (e.g., central roles of AKT-mTOR as positive regulators and modulation of GSK3β and DNA-damage response kinases).
- Functional validation: COX10 (complex IV assembly factor) was required for oxidative phosphorylation (OXPHOS) activation and for efficient exit from quiescence, supporting a causal role for the mitochondrial pathways inferred from the integrated data.
Figure 5. Temporal profiling of whole proteome and phosphoproteome during T cell activation.
Figure 6. Temporal expression profiling of whole proteome reveals co-expression clusters and functional modules during T cell activation.
Figure 7. T cell phosphoproteome profiling reveals co-expression clusters, multiple active kinases, and dynamically regulated kinase signaling networks.
Conclusion
Temporal integrative profiling of the proteome and phosphoproteome reveals that T cell activation proceeds via an early phosphorylation-driven signaling phase followed by a later proteome reprogramming phase. Systems-level integration identifies key kinase-TF circuits and bioenergetics modules (notably mitoribosomes and complex IV) that are functionally necessary for naive T cells to exit quiescence. The multi-tier pipeline (proteome + phosphoproteome + databases + perturbation) provides superior sensitivity for discovering core molecular circuits compared with single-omic approaches.
Related Services
References
- Higgins L, Gerdes H, Cutillas P R. Principles of phosphoproteomics and applications in cancer research. Biochemical Journal, 2023, 480(6): 403-420.
- Lu X, et al. Integrated proteome and phosphoproteome analysis of gastric adenocarcinoma reveals molecular signatures capable of stratifying patient outcome. Molecular Oncology, 2023, 17(2): 261-283.
- Tan H, et al. Integrative proteomics and phosphoproteomics profiling reveals dynamic signaling networks and bioenergetics pathways underlying T cell activation. Immunity, 2017, 46(3): 488-503.