Get Your Custom Quote

Online Inquiry

Unlock non-invasive biomarker insights with Creative Proteomics' urinary proteomics services, powered by DIA, 4D-DIA, and targeted quantification technologies.

Get Your Custom Quote

Urinary Proteomics

Are you seeking a non-invasive, high-precision approach to explore disease mechanisms, track therapeutic responses, or discover novel biomarkers? Creative Proteomics offers comprehensive urinary proteomics services that combine high-resolution mass spectrometry, advanced DIA and 4D-DIA platforms, EV enrichment, and PTM analysis to deliver deep, reproducible, and quantitative insights from even minimal urine samples.

  • High Sensitivity & Depth: Detect thousands of proteins, phosphoproteins, and low-abundance molecules from small urine volumes.
  • Comprehensive Quantification: DIA, 4D-DIA, and PRM-PASEF enable absolute and reproducible measurements across large cohorts.
  • Multi-Omics Integration: Combine proteomics with metabolomics for pathway-level insights and holistic biomarker discovery.
  • Proven Expertise: Trusted by academic and industry researchers worldwide, with published case studies and validated workflows.
Creative Proteomics' Urinary Proteomics Services.

Overview of Urinary Proteomics and Its Importance in Biomedical Research

Urinary proteomics has emerged as a powerful analytical discipline for the discovery of non-invasive biomarkers. Urine contains a diverse proteome that reflects physiological and pathological processes across multiple organ systems. The urinary proteome captures signals from the kidney, urogenital tract, cardiovascular system, and immune system. Its composition also mirrors systemic metabolic and proteostatic changes.

Modern mass spectrometry enables high-depth and high-throughput analysis of urinary proteins. These advances facilitate early disease detection, mechanism-based classification, and pharmacodynamic evaluation. Urinary proteomics now supports precision medicine, translational research, and development programs. The field continues to expand as analytical sensitivity and data fidelity improve.

Production process of urine.

Figure 1. Circulation process of urine in the kidney (Decramer S, et al., 2008).

Why Urine is an Ideal Sample for Proteomics Research?

Urine offers several advantages as a research matrix. The collection process is simple and non-invasive. This reduces patient burden and increases sample compliance in large-scale studies. Urine contains fewer high-abundance proteins than plasma. This improves the detection of low-abundance biomarkers. The matrix also exhibits high stability because it lacks proteases that are abundant in blood.

Urine reflects dynamic physiological changes because it comes into direct contact with renal and urogenital tissues. Many diseases alter glomerular filtration, tubular reabsorption, or immune activity. These changes produce measurable proteomic signatures. As a result, urine is well-suited for longitudinal monitoring, early screening, and evaluation of therapeutic response.

Advanced Quantitative Proteomics Platforms for High-Depth Urinary Analysis

Data-Independent Acquisition (DIA)

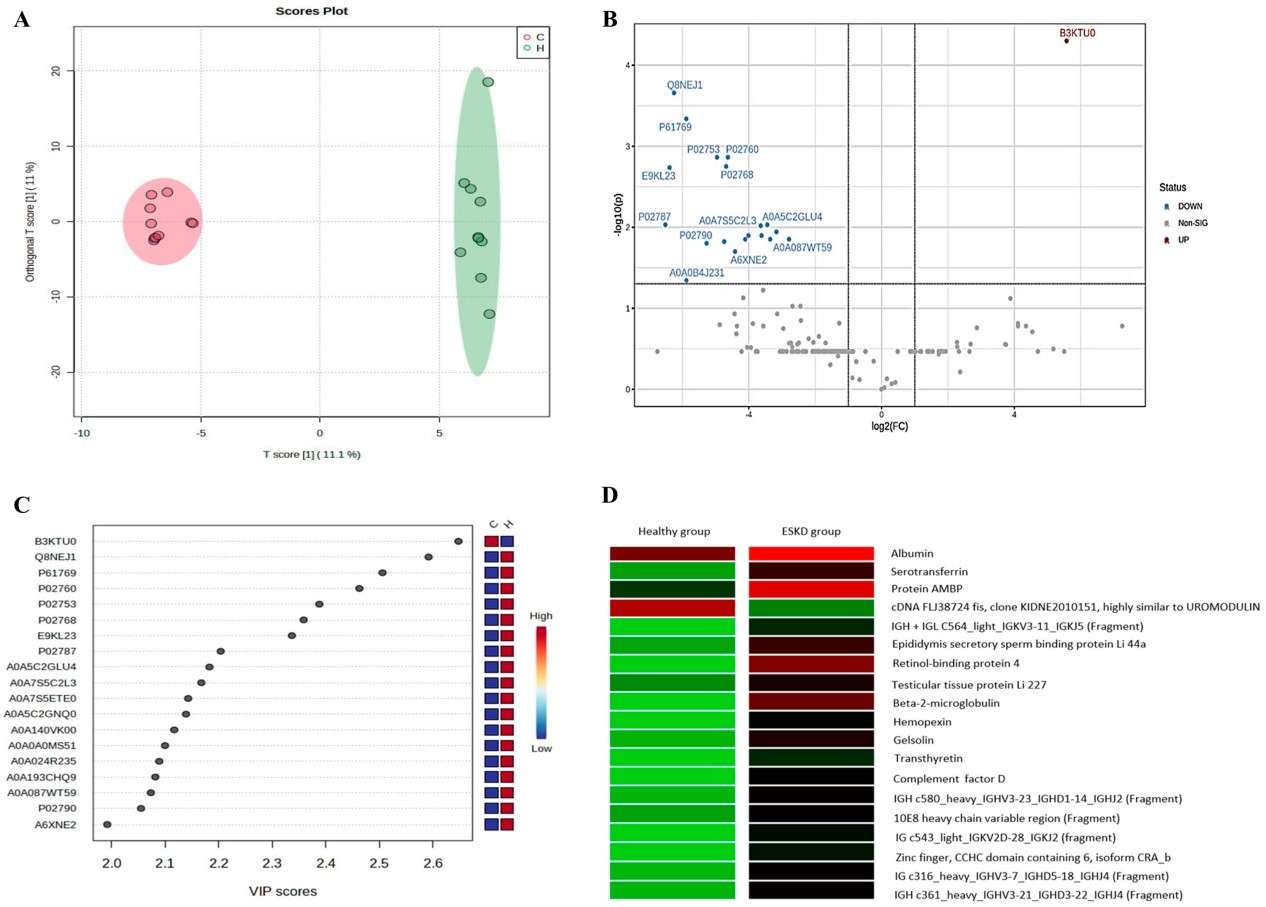
DIA collects fragment-ion data for all precursor ions systematically. This eliminates stochastic precursor selection and improves quantification stability. DIA resolves complex urine matrices with high confidence. The method supports biomarker discovery, pathway profiling, and differential proteome analysis across large cohorts.

DIA libraries derived from deep urinary datasets enable sensitive peptide identification. They also facilitate standardisation across instruments and laboratories.

4D-DIA and dia-PASEF

4D-DIA and dia-PASEF incorporate trapped ion mobility spectrometry. This separates peptides based on mobility, mass, retention time, and fragmentation behaviour. The four-dimensional dataset improves analytical resolution and reduces interference.

The increased sequencing speed benefits discovery-driven projects. The higher sensitivity enables the detection of ultra-low-abundance urinary proteins related to inflammation, fibrosis, or metabolic dysfunction.

Targeted Proteomics and PRM-PASEF

Targeted proteomics offers high-accuracy quantification for predefined biomarker panels. Parallel Reaction Monitoring (PRM) combined with PASEF enhances selectivity. The method provides absolute quantification when paired with stable isotope–labelled standards.

PRM-PASEF delivers robust quantification for signalling molecules, transport proteins, renal injury markers, and pharmacodynamic biomarkers.

Our Comprehensive Urinary Proteomics Workflow at Creative Proteomics

Urinary proteomics workflow at creative proteomics.

Applications of Urinary Proteomics
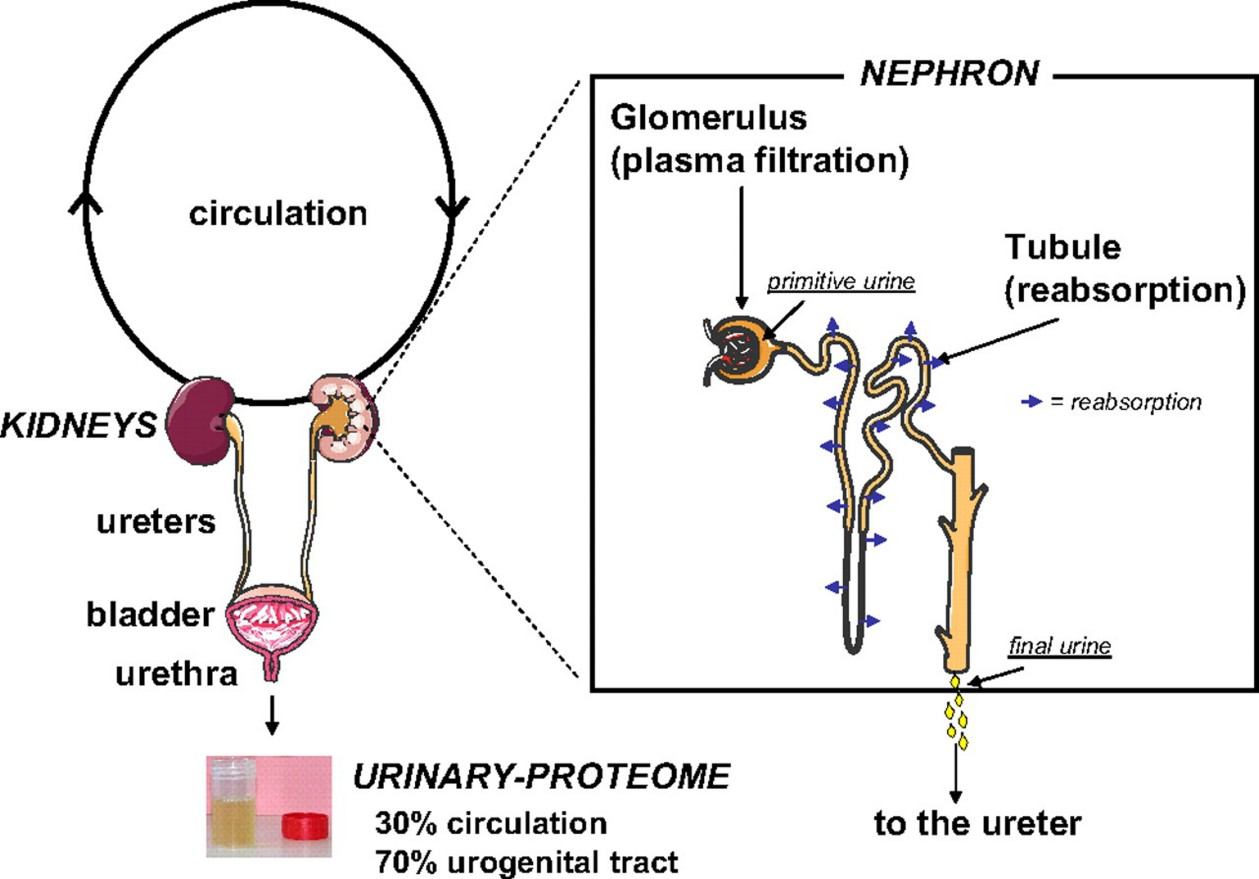
Why Choose Creative Proteomics for Urinary Proteomics Projects?

Sample Requirements for Urinary Analysis

Parameter Requirement
Sample Type Human or animal urine
Minimum Volume 5–10 mL (standard); ≥50 mL recommended for exosome enrichment
Collection Method Midstream urine; first-morning sample preferred
Container Sterile polypropylene tube
Processing Centrifugation at 2,000 × g for 10 min to remove debris
Storage −80°C; avoid repeated freeze–thaw cycles

Note:

We recommend first-morning midstream urine due to higher protein concentration. Samples require immediate cooling. Centrifugation removes cellular debris and particulate matter. Filtration and protease inhibitors further stabilize protein composition.

Consistent storage below −80 °C preserves protein integrity for long-term biobanking. Quality control metrics ensure batch uniformity and minimize analytical bias.

FAQ

Q1: Why is urine considered less complex than serum or plasma for proteomics?

A1: Urine is considered less complex than serum or plasma due to its lower overall protein concentration and reduced presence of high-abundance proteins such as albumin and immunoglobulins. This reduction in complexity enables the mass spectrometric interrogation of lower-abundance proteins with improved depth and quantitative precision.  

Q2: How is data from urinary proteomics interpreted?

A2: Data analysis includes peptide identification, quantitative normalization, differential protein analysis, pathway enrichment, and statistical modeling. Advanced bioinformatics, including machine learning, can identify patterns and predict functional relationships between proteins and disease mechanisms.

Q3: How does DIA improve reproducibility compared to traditional shotgun proteomics?

A3: DIA systematically fragments all detectable precursor ions, unlike DDA, which selects ions stochastically. This ensures consistent peptide coverage across samples, enabling high reproducibility and reliable quantification in large-scale studies.

Q4: How do extracellular vesicles (EVs) improve urinary biomarker detection?

A4: EVs carry proteins, RNA, and lipids from their cells of origin, including diseased tissues. Isolation of urine EVs concentrates these molecules, increasing the likelihood of detecting low-abundance biomarkers.

Q5: What is the current detection depth achievable in urinary proteomics?

A5: With modern high-resolution MS, researchers have identified several thousand proteins in normal human urine. For example, deep profiling using advanced separation strategies has identified over 6,000 unique urinary proteins in healthy individuals. This depth supports broad biological insight and increases the likelihood of capturing disease-relevant biomarkers.

Demo

Demo: Urine Proteomics for Detection of Potential Biomarkers for End-Stage Renal Disease

This study compared urinary proteomes of healthy individuals and chronic kidney disease patients using LC–MS/MS. It identified distinct protein expression differences, including elevated beta‑2‑microglobulin levels in CKD patients, which correlated negatively with renal function. These findings support urinary proteomics as a non-invasive approach for detecting and monitoring progression toward end-stage renal disease.

Quantitative characterization of the urinary proteomic profile.

Figure 2. Quantitative characterization of the urinary proteomic profile of the control and hemodialysis groups (Silva N R, et al., 2025).

GO analysis of the statistically significant proteins.

Figure 3. Gene ontology (GO) analysis of the 19 statistically significant proteins (Silva N R, et al., 2025).

Eight presented interactions according to the analysis performed.

Figure 4. Functional interactions between proteins (Silva N R, et al., 2025). 

Case Study

Case: Urine proteomics identifies biomarkers for diabetic kidney disease at different stages

Background:

Type 2 diabetic kidney disease (DKD) is a leading cause of chronic kidney disease (CKD) and end-stage renal disease (ESRD). Current diagnosis relies on invasive kidney biopsy or clinical measures (eGFR, albuminuria), which are limited in accuracy and early detection. Noninvasive biomarkers for early detection and monitoring of DKD are needed.

Purpose:

To establish a urinary proteomics workflow to identify protein biomarkers that can differentiate DKD from uncomplicated diabetes, distinguish DKD stages, and monitor early disease progression.

Methods

  • Cross-sectional study with 252 urine samples from patients with diabetes without nephropathy, DKD (stages 3 and 4), and CKD without diabetes.
  • Proteins were extracted from urine pellets, digested with trypsin, and analyzed using nano HPLC coupled with LC–MS/MS.
  • Label-free quantification (iBAQ/iFOT) and statistical analyses (DEPs identification, PCA, logistic regression, ROC) were performed.
  • Classifiers were built to differentiate DKD from diabetes, DKD3 from DKD4, and identify early DKD progression (pre-DKD3).

Results

  • 2946 proteins were quantified overall, with a median of 571 proteins per sample.
  • A 2-protein classifier (ALB, AFM) distinguished DKD from diabetes (AUC = 0.928).
  • A 3-protein classifier (ANXA7, APOD, C9) distinguished DKD3 from DKD4 (AUC = 0.949).
  • A 4-protein classifier (SERPINA5, VPS4A, CP, TF) identified early-stage DKD3 from diabetes (AUC = 0.952).
  • DEPs were associated with complement cascade, immune response, and metabolic pathways, reflecting disease progression.
  • Follow-up of 11 patients confirmed progression in 2 predicted pre-DKD cases.
Urine proteomic of CKD, DKD, and Diabetes.

Figure 5. Urine proteomic analysis of Diabetes, DKD, and CKD.

Conclusion

Urinary proteomics is a non-invasive and reproducible approach for detecting, staging, and monitoring the progression of DKD. The study identified robust biomarker panels and provided insights into molecular pathways underlying DKD, supporting early intervention in high-risk patients.

Related Services

References

For research purposes only, not intended for clinical diagnosis, treatment, or individual health assessments.

Tell Us About Your Project