
What Does a Venn Diagram Show in Omics Research?
Practical Applications of Venn Diagrams in Omics
Best Practices for Generating and Using Venn Diagrams in Omics
Tools and Software for Venn Diagram Generation in Omics
Moving Beyond Overlap: How to Interpret Venn Diagram Results
Limitations and Common Pitfalls in Using Venn Diagrams for Omics
How Creative Proteomics Supports Advanced Comparative Omics Analysis?
In proteomics, metabolomics, and glycomics research, comparing molecular profiles across different sample groups or experimental conditions is a common but complex task. One of the most intuitive ways to visualize these comparisons is through Venn diagrams—a tool that helps researchers identify shared and unique biomolecules across datasets.
While Venn diagrams are easy to generate, understanding what they truly represent in the context of biological systems requires deeper insight. This guide provides a practical overview of how to interpret Venn diagrams in omics research, including their structure, biological meaning, best practices, limitations, and how Creative Proteomics supports clients in effective comparative analysis.
What Does a Venn Diagram Show in Omics Research?
A Venn diagram is a visual representation of the relationships between different sets—in omics, these sets are typically lists of identified molecules such as proteins, metabolites, or glycans under specific conditions.
Key Concepts:
- Each circle represents a dataset (e.g., proteins detected in one sample group).
- Overlapping areas indicate molecules shared across datasets.
- Non-overlapping areas represent molecules unique to one dataset.
For example, when comparing the proteomes of healthy vs. diseased tissues:
- The intersection shows proteins found in both conditions—these may play core cellular roles.
- The unique sections reveal condition-specific proteins—potential biomarkers or disease drivers.
Why It Matters:
Venn diagrams are often the first layer of biological insight, helping researchers:
- Highlight consistently regulated molecules across replicates or conditions
- Identify treatment- or stage-specific biomolecules
- Generate hypotheses for downstream validation
However, these diagrams show only presence or absence—not quantitative change or statistical significance.
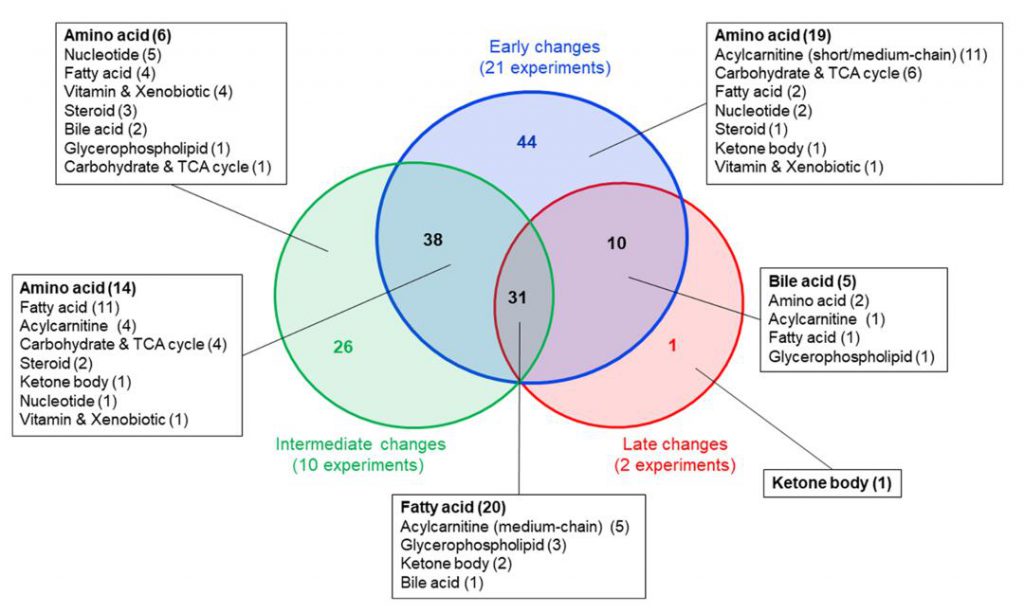
Venn diagram showing metabolites altered at early (≤0.5 h), intermediate (>0.5–3 h), and late (>3–24 h) time points after exercise. Thirty-one metabolites, including acylcarnitines and free fatty acids, were consistently changed across all time points. Data represent blood metabolite changes from 33 experiments (Schranner, Daniela, et al., 2020)
Practical Applications of Venn Diagrams in Omics
Comparative Proteomic Profiling
Proteomics studies often generate lists of differentially expressed proteins under various experimental conditions (e.g., drug treatment vs. control, different time points). Venn diagrams allow researchers to quickly identify:
- Proteins consistently regulated across multiple treatments
- Proteins uniquely altered in a specific condition
- Overlapping proteins across biological replicates or batches
Such comparative visualization supports robust biomarker discovery by focusing attention on consistently altered proteins with higher biological significance.
Multi-Omics Data Integration
Modern systems biology increasingly relies on integrating multiple omics layers to gain a holistic understanding of biological processes. Venn diagrams can be employed to:
- Identify molecules (e.g., proteins, metabolites, glycans) appearing in multiple datasets, suggesting coordinated regulation
- Detect cross-talk between different omics layers by overlapping sets of proteins with their related metabolites or glycosylation modifications
- Guide targeted pathway analysis by focusing on shared elements that bridge multiple biological layers
For instance, overlaying glycoproteomic data with total proteome profiles via a Venn diagram can pinpoint proteins whose glycosylation status is significantly altered alongside changes in their overall abundance.
Temporal and Condition-Specific Analysis
In studies involving multiple time points or varying experimental conditions, Venn diagrams facilitate the identification of:
- Molecules stably expressed throughout a time course (common elements)
- Transiently expressed or condition-specific molecules (unique elements)
- Patterns of molecular dynamics important for understanding progression or treatment response
This application is critical in developmental biology, pharmacodynamics, and stress response research.
Best Practices for Generating and Using Venn Diagrams in Omics
Despite their visual simplicity, Venn diagrams must be carefully designed and interpreted to yield reliable insights in omics research. Effective use requires stringent data preprocessing, thoughtful group definitions, and biological context.
Rigorous Data Preprocessing
Before constructing a Venn diagram, researchers must ensure the comparability and quality of input datasets. Poorly normalized or inconsistently filtered data can lead to misleading overlaps.
- Normalization: Apply appropriate normalization methods to remove technical variability. For example, use total ion current normalization in proteomics, internal standard correction in metabolomics, or batch correction in multi-run datasets.
- Statistical Filtering: Establish strict thresholds for defining differential or present molecules. Typical filters include adjusted p-values (e.g., FDR < 0.05) and biologically meaningful fold changes (e.g., ≥1.5 or ≤0.67). This minimizes false positives that may inflate overlap counts.
- Unified Identifier Systems: Ensure molecular identifiers are harmonized across datasets—e.g., UniProt IDs for proteins, HMDB or KEGG IDs for metabolites, GlyTouCan IDs for glycans—to avoid mismatched or duplicated entities.
Define Clear Inclusion Criteria
A frequently overlooked but critical step in Venn diagram generation is deciding which molecules to include. Not all detected features are equally meaningful.
- Presence Criteria: For presence/absence comparisons, include only molecules confidently detected across biological replicates or above a predefined intensity threshold. Excluding low-confidence features reduces noise.
- Reproducibility Check: Include only those entities reproducibly observed in multiple replicates or conditions. Molecules identified in only a single replicate may not be biologically relevant.
- Biological Relevance: Consider biological context when deciding on inclusion. For example, low-abundance signaling proteins or rare metabolites may still be important despite borderline statistical metrics.
Thoughtful Grouping and Thresholding
How you group your samples and define comparisons can significantly impact the interpretability of the resulting Venn diagram.
- Clearly Define Comparison Groups: Establish biologically meaningful groupings (e.g., drug-treated vs. untreated, early vs. late-stage samples, different tissues) based on experimental objectives.
- Apply Consistent Cutoffs Across Groups: Use the same statistical and intensity filters across all datasets to ensure fair comparisons. Inconsistent cutoffs can introduce artifacts into the overlap pattern.
- Avoid Overinterpretation of Marginal Overlaps: Not all overlapping molecules are equally relevant. Two molecules may both appear in an intersection but differ significantly in biological behavior. Use downstream analyses to validate relevance.
Limit the Number of Sets Compared
While it may be tempting to compare many conditions at once, Venn diagrams become difficult to read and interpret with more than four sets.
- 2–4 Groups Ideal: Venn diagrams are visually effective for two to four comparisons. For more complex datasets, alternatives like UpSet plots or Euler diagrams provide better scalability and clarity.
- Use Visual Hierarchies: In studies requiring many comparisons (e.g., time courses, multiple cell types), consider breaking the analysis into subsets or using hierarchical diagrams layered with biological metadata.
Tools and Software for Venn Diagram Generation in Omics
Web-Based Tools
- Venny: User-friendly online tool allowing input of lists and interactive visualization.
- BioVenn: Provides area-proportional Venn diagrams tailored to biological datasets.
- InteractiVenn: Supports dynamic Venn diagrams, useful for more complex comparisons.
These tools are accessible without programming skills but may have limitations with large datasets.
R/Bioconductor Packages
- VennDiagram: Comprehensive package for customizable, publication-quality Venn diagrams.
- ggVennDiagram: Integrates with ggplot2 for enhanced aesthetics and integration with R workflows.
- limma::vennCounts: Useful for directly analyzing differential expression results.
These packages facilitate reproducibility and integration into bioinformatics pipelines, which is essential for omics datasets.
Integration with Omics Analysis Pipelines
Several omics platforms and software suites include built-in support for Venn diagrams:
- MaxQuant (proteomics): Export lists for Venn analysis.
- MetaboAnalyst (metabolomics): Integrated tools for differential analysis and Venn plotting.
- GlycoWorkbench (glycomics): Enables comparative glycan profiling with Venn visualization.
Creative Proteomics supports clients by integrating these tools in customized workflows tailored to project-specific needs.
Moving Beyond Overlap: How to Interpret Venn Diagram Results
While Venn diagrams give you a snapshot of shared and unique elements, interpreting their biological relevance requires context.
Assess the Biological Meaning of Overlaps
Ask:
- Are the overlapping molecules involved in core cellular functions?
- Do they play roles in shared pathways or mechanisms across conditions?
If yes, they might represent stable or essential biological components.
Investigate Unique Molecules
Molecules unique to one dataset may:
- Indicate condition-specific responses
- Serve as biomarkers or drug targets
- Reflect technical artifacts (which require validation)
Use complementary tools (e.g., pathway enrichment analysis) to understand their significance.
Combine with Quantitative and Statistical Analyses
Remember:
- Venn diagrams don't capture fold changes or expression levels.
- Two molecules might both appear in an overlap, but one could be significantly more regulated.
For deeper insight:
- Pair Venn diagram analysis with volcano plots, heatmaps, and PCA.
- Use statistical validation (e.g., ANOVA, multiple testing correction) to confirm findings.
Limitations and Common Pitfalls in Using Venn Diagrams for Omics
Overemphasis on Overlap Counts
Quantitative overlap alone does not guarantee biological importance. Researchers should avoid interpreting large intersections as inherently more significant without further context.
Biases from Experimental Design
- Inconsistent sample sizes or quality across groups can distort overlaps.
- Batch effects or incomplete data can artificially inflate or deflate intersections.
Visual Complexity and Scalability
- For datasets with many groups or very large molecule lists, Venn diagrams become cluttered and hard to interpret.
- Alternative visualizations (e.g., Upset plots, network diagrams) should be considered when complexity increases.
How Creative Proteomics Supports Advanced Comparative Omics Analysis?
Creative Proteomics offers comprehensive services designed to empower researchers in extracting meaningful insights from complex omics datasets:
- Customized Data Analysis Pipelines: Tailored normalization, filtering, and differential expression analyses to prepare data for robust comparison.
- Integrated Multi-Omics Visualization: Generation of high-quality Venn diagrams combined with enrichment and network analyses for biological interpretation.
- Expert Reporting and Consultation: Detailed, client-specific reports including comparative analyses and actionable insights to guide experimental design and validation.
Through these capabilities, Creative Proteomics enables clients to leverage Venn diagrams not just as visualization tools, but as gateways to deeper biological understanding.
References
Schranner, Daniela, et al. "Metabolite concentration changes in humans after a bout of exercise: a systematic review of exercise metabolomics studies." Sports medicine-open 6 (2020): 1-17.
Monnerie, Stéphanie, et al. "Metabolomic and lipidomic signatures of metabolic syndrome and its physiological components in adults: a systematic review." Scientific Reports 10.1 (2020): 669.
Related Services
Proteomics
Service
Metabolomics
Service
Lipidomics
Service
Glycomics Service