What Are Histone PTMs?
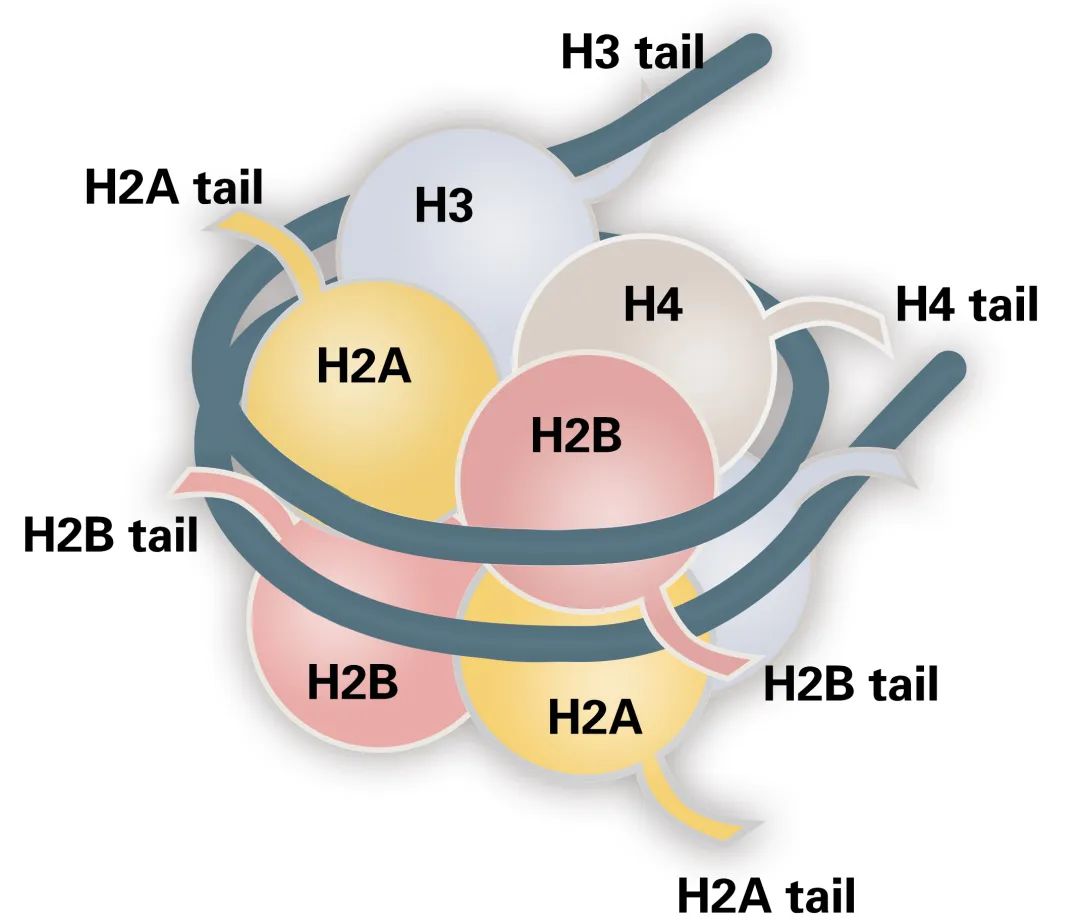
Histone post-translational modifications (PTMs) are covalent chemical changes in histone proteins. These modifications occur primarily on the unstructured N-terminal tails of core histones H2A, H2B, H3, and H4. Common PTMs include acetylation, methylation, phosphorylation, ubiquitination, and acylations such as propionylation and butyrylation. Each PTM alters histone charge, conformation, or interaction potential. Such changes govern chromatin compaction and accessibility. They therefore regulate transcription, replication, and repair processes. The ensemble of histone PTMs constitutes the "histone code." This code integrates metabolic cues and enzymatic activities to modulate gene expression programs.
Mass Spectrometry for Quantitative Histone PTM Profiling
Why Mass Spectrometry Is Preferred Over Antibody-Based Methods
Antibody-based assays depend on specific antibodies targeting known PTM sites. However, these assays face challenges such as cross-reactivity and a limited ability to analyze multiple targets at once, and they typically provide semi-quantitative results. In contrast, mass spectrometry (MS) allows for unbiased detection of all PTMs in a single experiment, offering precise mass measurements with parts-per-million resolution. MS can simultaneously identify and quantify numerous PTM states, effectively addressing the specificity issues associated with antibodies. The workflows used in MS provide high reproducibility and a wide dynamic range, making it the gold standard for profiling histone PTMs.
Bottom-Up vs. Top-Down vs. Middle-Down Strategies
Bottom-up proteomics digests histones into short peptides. It achieves high sensitivity and broad coverage. However, it may lose information about combinatorial PTM patterns on the same histone tail. Top-down proteomics analyzes intact histones or large fragments. It preserves PTM crosstalk information and sequence variants. Yet it suffers from reduced sensitivity and challenging data analysis. Middle-down approaches target large peptides (~5-20 residues). They represent a compromise. Middle-down retains combinatorial PTM context while maintaining moderate sensitivity.
Sample Preparation: Histone Extraction and Chemical Derivatization
Histone extraction begins with nuclei isolation via hypotonic lysis. Acid extraction with 0.2-0.4 M HCl enriches histones. Purity above 80 % is necessary for reliable MS analysis. Next, chemical derivatization blocks free amines on unmodified and monomethylated lysines. Propionic anhydride or d₆-acetic anhydride are common reagents. They prevent trypsin cleavage at lysine residues. Trypsin then cleaves exclusively at arginine C-termini, yielding peptides of optimal length. Deuterated anhydrides enable discrimination of endogenous acylations from chemical labels. Finally, phenyl isocyanate derivatization enhances peptide hydrophobicity. It improves chromatographic retention and peak shape.
Select Service
Label-Based Quantitative Approaches for Histone PTMs
SILAC
Stable isotope labeling by amino acids in cell culture (SILAC) facilitates the introduction of heavy isotopes into the proteome through metabolic incorporation. This technique involves culturing cells in media enriched with 13C6‐lysine and 13C6,15N4‐arginine. Following multiple cell divisions, over 97% of the proteins are labeled with heavy isotopes. Prior to protein extraction, control and treated cells are combined in equal proportions. The resulting digested peptides yield light and heavy pairs. Mass spectrometry (MS1) scans are employed to detect the mass shift associated with the labeled peptides. The relative abundance of these peptides is quantified by analyzing the peak area ratios of light to heavy ions.
Isobaric Tagging (TMT, iTRAQ, DiLeu)
Isobaric tags such as tandem mass tags (TMT) and isobaric tags for relative and absolute quantification (iTRAQ) label peptides post-digestion. Each tag comprises an amine-reactive group, a mass reporter, and a balanced group. Tagged peptides from multiple samples are combined and analyzed together. Reporter ions of distinct masses appear in MS2 spectra. Their intensities reflect relative abundances across samples. Current kits support up to 16-plex or higher, enabling large-scale studies.
Chemical Derivatization Strategies
Chemical labeling with propionic anhydride blocks unmodified lysines. It increases peptide hydrophobicity. It standardizes peptide charge states for improved MS performance. Deuterated anhydrides (d₆-acetic, d₅-propionic) permit a distinction between endogenous acylations and labels.
Derivatization with propionic anhydride masks unmodified and monomethylated lysines. Endogenous propionylation cannot be distinguished. d₆-acetic anhydride avoids this overlap. It shifts chemical acetyl labels by +3Da relative to endogenous acetyl groups. This approach supports accurate measurement of acetylation, propionylation, and butyrylation.
Label-Free Quantitative Proteomics for Histone Modifications
Label-free quantitative proteomics offers a versatile approach for measuring histone PTMs without the need for isotopic or chemical labeling. This strategy is particularly valuable when analyzing large sample sets, primary tissues, or clinical specimens where labeling is impractical.
MS1-Based Peak Area Integration and Spectral Counting
Label-free quantification primarily relies on two techniques:
- MS1 peak area integration measures the chromatographic intensity of precursor ions. Extracted ion chromatograms (XICs) are generated for each peptide, and the area under the curve reflects its relative abundance. This method is suitable for detecting subtle changes in histone PTM levels across samples.
- Spectral counting tallies the number of tandem MS (MS2) spectra matching each peptide. Although less precise, spectral counting is useful for estimating the relative abundance of highly expressed histone peptides in large-scale comparisons.
Data-Independent Acquisition (DIA) vs. Data-Dependent Acquisition (DDA)
Label-free workflows can be implemented using two major acquisition modes:
- Data-dependent Acquisition (DDA) selects the most intense MS1 ions for fragmentation in real time. While commonly used, DDA may suffer from stochastic sampling, resulting in missing values for low-abundance peptides or modifications.
- Data-independent Acquisition (DIA) divides the entire m/z range into sequential isolation windows. All ions within each window are fragmented together, providing comprehensive and reproducible coverage. DIA is particularly effective for quantifying histone PTMs due to their complexity and low abundance.
Select Service
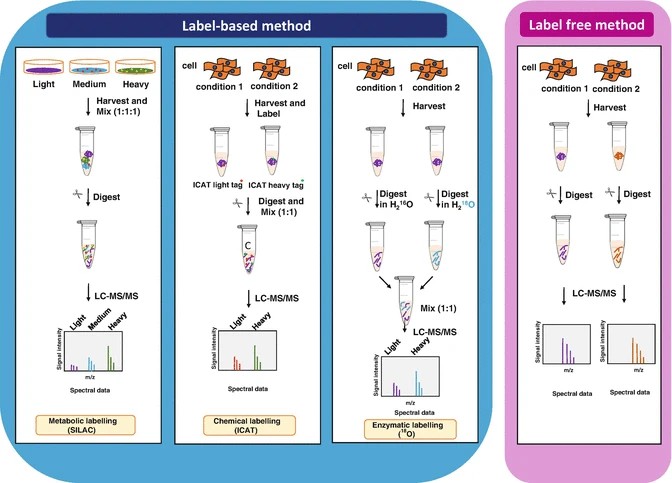 Figure 1. General scheme of quantitative proteomics (Anand S, et al., 2017).
Software Tools for Histone PTM Quantification
EpiProfile 2.0
EpiProfile 2.0 automates the identification and quantification of histone peptides from DDA or DIA data. It uses retention time alignment and spectral libraries to assign peaks. It generates quantitative tables for each PTM state. It accelerates data processing but may misspeak in medium-quality datasets.
Skyline
Skyline is an open-source platform for targeted proteomics. It supports manual inspection of MS1 and MS2 chromatograms. Users can adjust integration boundaries and verify peak identity. Skyline exports data for downstream statistical analysis. This platform requires user expertise but yields high confidence in quantification.
R-Based Custom Workflows for Data Filtering, Normalization, and Statistics
Custom R scripts streamline data quality control, normalization, and statistical testing. Key steps include:
- Data Check: Verify recovery of benchmark histone peptides.
- Normalization: Apply median or internal standard-based scaling.
- Statistical Analysis: Perform t-tests or ANOVA for PTM fold-change significance.
These workflows enhance reproducibility and accessibility for non-experts.
Select Service
Comparative Analysis: Label-Free vs. Label-Based Quantification
| Feature | Label-Free Quantification | Label-Based Quantification |
|---|---|---|
| Basic Principle | Measures endogenous peptide intensity directly | Introduces stable isotope or isobaric tags for comparative quantification |
| Common Techniques | MS1 peak area integration, spectral counting, DIA/DDA | SILAC, TMT, iTRAQ, DiLeu, chemical labeling (e.g., propionylation) |
| Sample Type Compatibility | Any sample, including tissues and primary cells | SILAC limited to dividing cells; isobaric tags applicable to all digests |
| Multiplexing Capability | One sample per run | Up to 16-plex (e.g., TMTpro), enabling high-throughput comparisons |
| Sensitivity | Moderate; depends on peptide abundance and instrument stability | High; internal standards improve precision, especially for low-abundance PTMs |
| Quantification Accuracy | Sensitive to run-to-run variation; requires normalization | High accuracy due to internal reference channels or isotopic controls |
| Dynamic Range | Broad, but may suffer from variability at low signal intensities | Generally narrower; can suffer from ratio compression (isobaric tags) |
| Reproducibility | Lower between batches; improved with DIA and normalization | Higher due to within-run comparisons of labeled peptides |
| Technical Complexity | Simpler sample prep; minimal protocol modification | Requires additional steps (e.g., labeling, purification, calibration) |
| Instrument Time and Cost | Longer total time for large cohorts (one sample per run); low reagent cost | More cost-effective for multi-sample projects; reagent cost is high |
| Data Analysis Requirements | Advanced normalization and statistical corrections essential | Requires software for tag-based quantification; may need MS3 (TMT) |
| Use Case Examples | Longitudinal studies, tissue cohorts, biomarker discovery | Cell culture experiments, screening of treatment conditions, PTM profiling |
Best Practices and Recommendations for Quantitative Histone Proteomics
Experimental Design and Biological Replicates
Include a minimum of four biological replicates per condition to achieve ≥80% statistical power for 20% fold-changes. Plan pilot studies to estimate variance. Randomize sample processing order to avoid confounding batch effects.
Quality Control Criteria and Data Curation
Incorporate pooled reference samples and technical replicates. Apply data-check filters to verify the recovery of benchmark peptides. Exclude samples with poor peak detection. Document instrument performance metrics such as retention time drift and mass accuracy.
Choosing the Right Quantification Strategy Based on Research Goals
Select SILAC when cell culture modeling is feasible and utmost accuracy is required. Use isobaric tagging for high-throughput, multi-condition studies. Adopt label-free DIA for discovery phases or large-scale clinical cohorts. Balance cost, complexity, and desired depth of coverage.
Applications in Epigenetic Research and Biomarker Discovery
Histone PTM Dynamics in Cell Lines and Disease Models
Label-free and targeted MS approaches have enabled precise quantification of histone acetylation changes in disease contexts. Zhang et al. used targeted SRM proteomics to measure H3K18/K23 acetylation in Alzheimer’s disease cortex. They reported significantly reduced H3 acetylation in temporal lobe tissue from AD patients compared to age-matched controls (p<0.01) (Zhang K, et al., 2019).
Similarly, Karczmarski et al. quantified histone H3K27 acetylation in colorectal cancer samples using bottom-up LC-MS/MS. They identified elevated H3K27Ac in tumor tissue compared to normal mucosa across twelve paired samples (p≤0.05), highlighting its role in enhancer activation within tumorigenic pathways (Karczmarski J, et al., 2014).
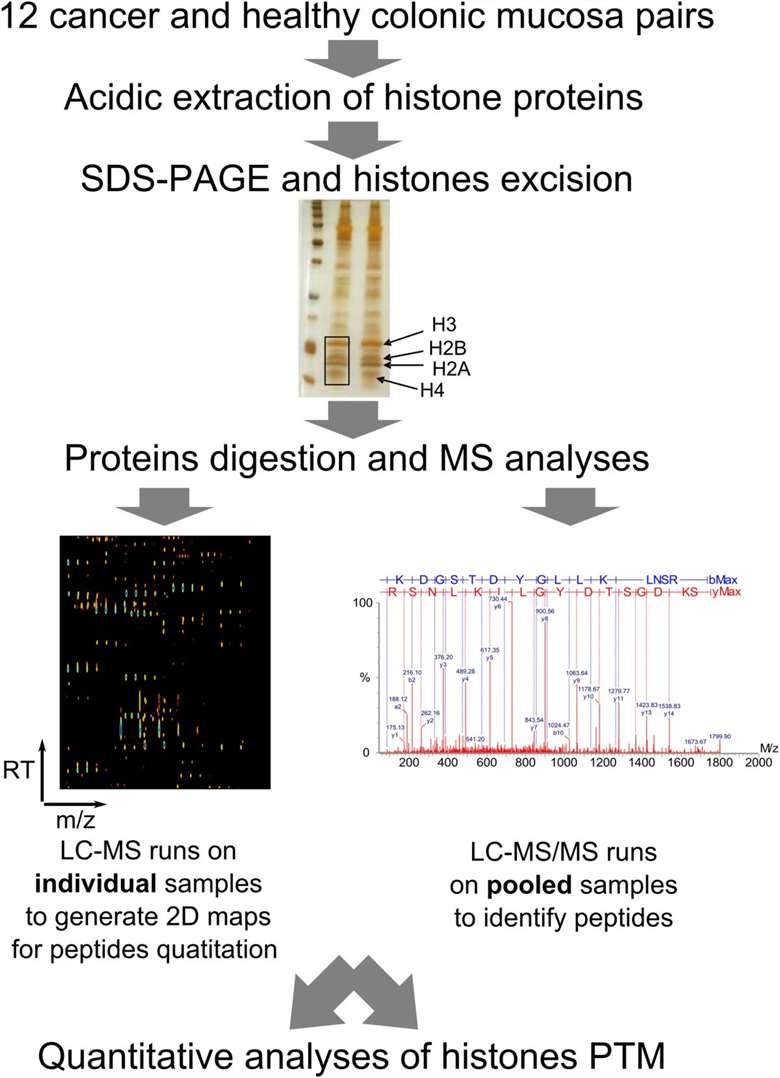 Figure 2. Diagram of workflow to determine altered histones PTMs in colon carcinoma tissues (Karczmarski J, et al., 2014).
Top-Down MS of Histone Variant Phosphorylation in Cancer
Top-down MS provides insight into combinatorial PTM patterns on intact histones. Phanstiel et al. used top-down analysis of histone H1.4 phosphorylation in breast cancer cell lines. They discovered sequential, mitosis-specific phosphorylation at multiple serine and threonine residues—a potential hallmark of proliferative tumor cells (Chen Y, et al., 2016).
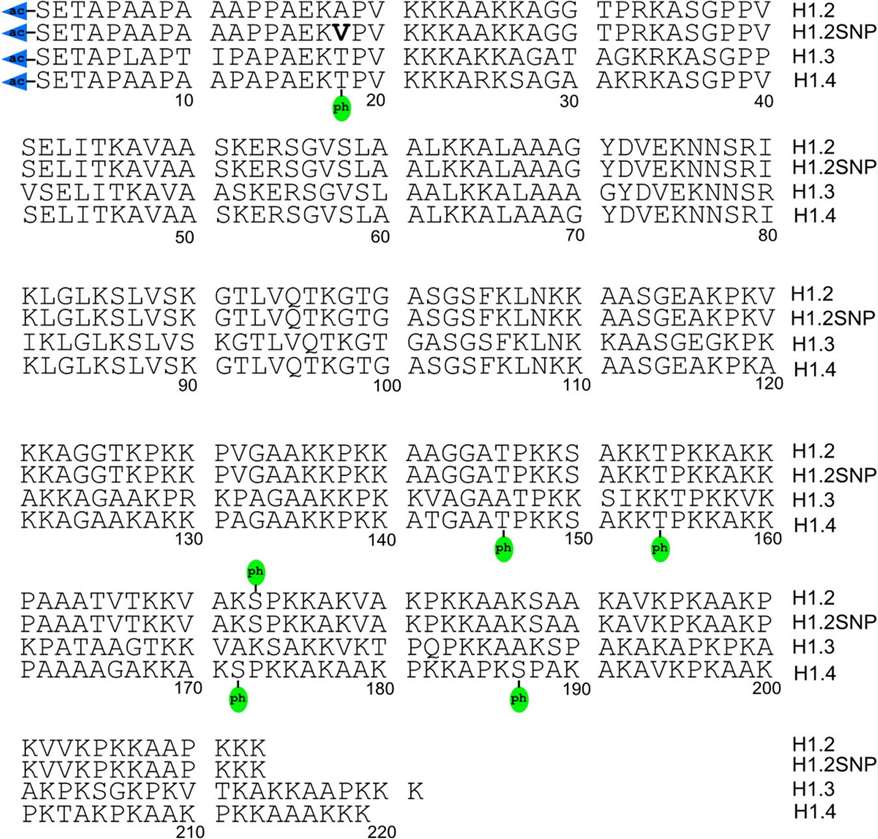 Figure 3. Top-down MS/MS-identified post-translational modifications of histone variants H1.2, H1.2SNP (A18V), H1.3, and H1.4 (Chen Y, et al., 2016).
Biomarker Discovery
Cancer biomarker identification has been a prominent application. Early MS studies comparing tumor vs normal tissues (e.g., lung, breast) uncovered consistent decreases in H4K16ac and H4K20me3 in cancer. A broader pan‑tumor MS screen confirmed reduced H3K14ac and variable changes in H3K27me3 across multiple cancer types.
Profiling leukemia cell lines sensitive or resistant to decitabine revealed distinct PTM patterns, including the discovery of 15 novel histone PTMs, via propionylation-based LC-MS/MS with SILACstandards. These data support PTMs as predictive or pharmacodynamic biomarkers (Noberini R, et al., 2021).
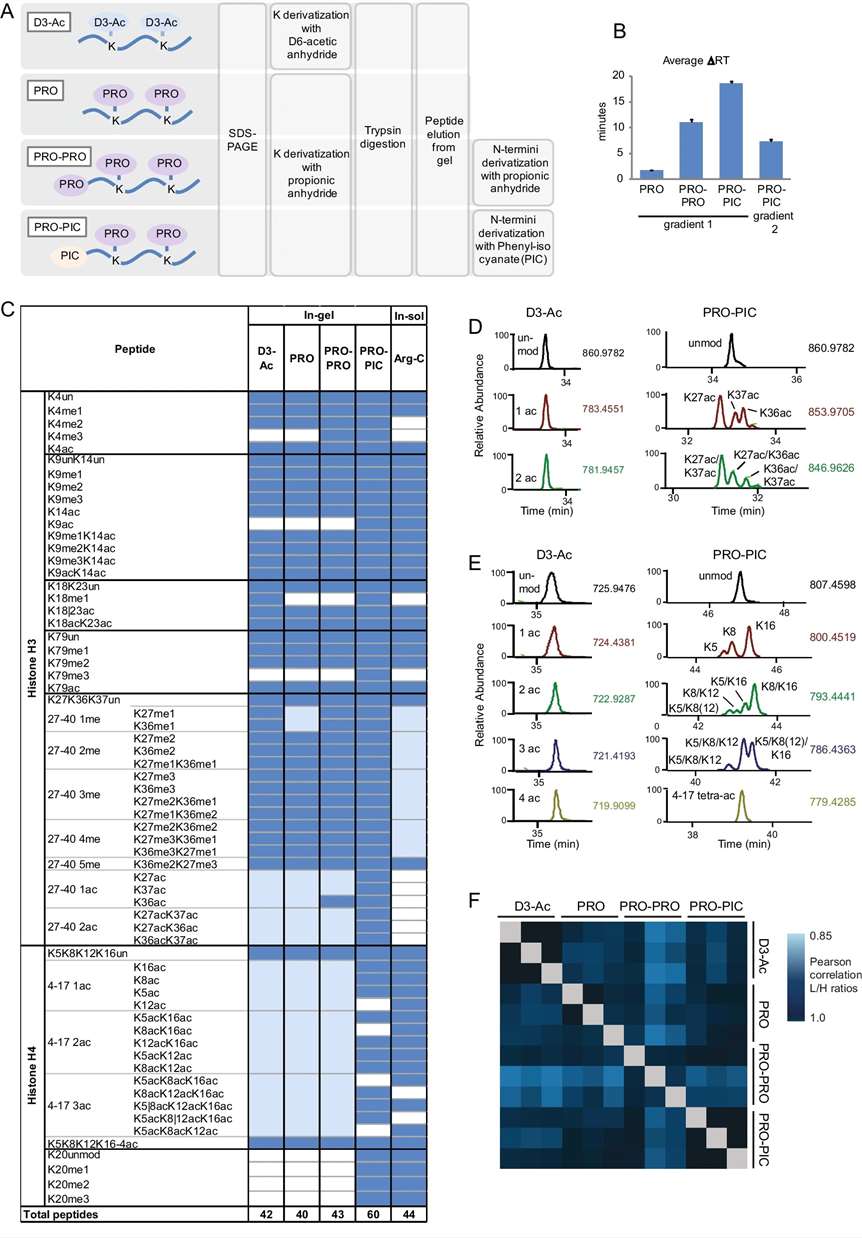 Figure 4. Comparison of in-gel digestion methods for MS-based histone PTM analysis (Noberini, R., et al., 2021).
Integration with Multi-Omics Platforms
The profiling of histone PTMs yields the most significant insights when combined with additional omics data. In the context of melanoma, MALDI-MS imaging of lipids facilitated an epiproteomic analysis of microdissected tumor regions. This approach uncovered localized alterations in H4 tetra-acetylation that are correlated with the presence of tumor-infiltrating lymphocytes and prognostic outcomes (Noberini, R., et al., 2021).
In addition, targeted SILAC-MS profiling of H3 modifications in estrogen-treated MCF‑7 breast cells demonstrated dynamic changes in H3K27 methylation and H4 acetylation, linking hormone response to epigenetic regulation (Hu Y, et al., 2021).
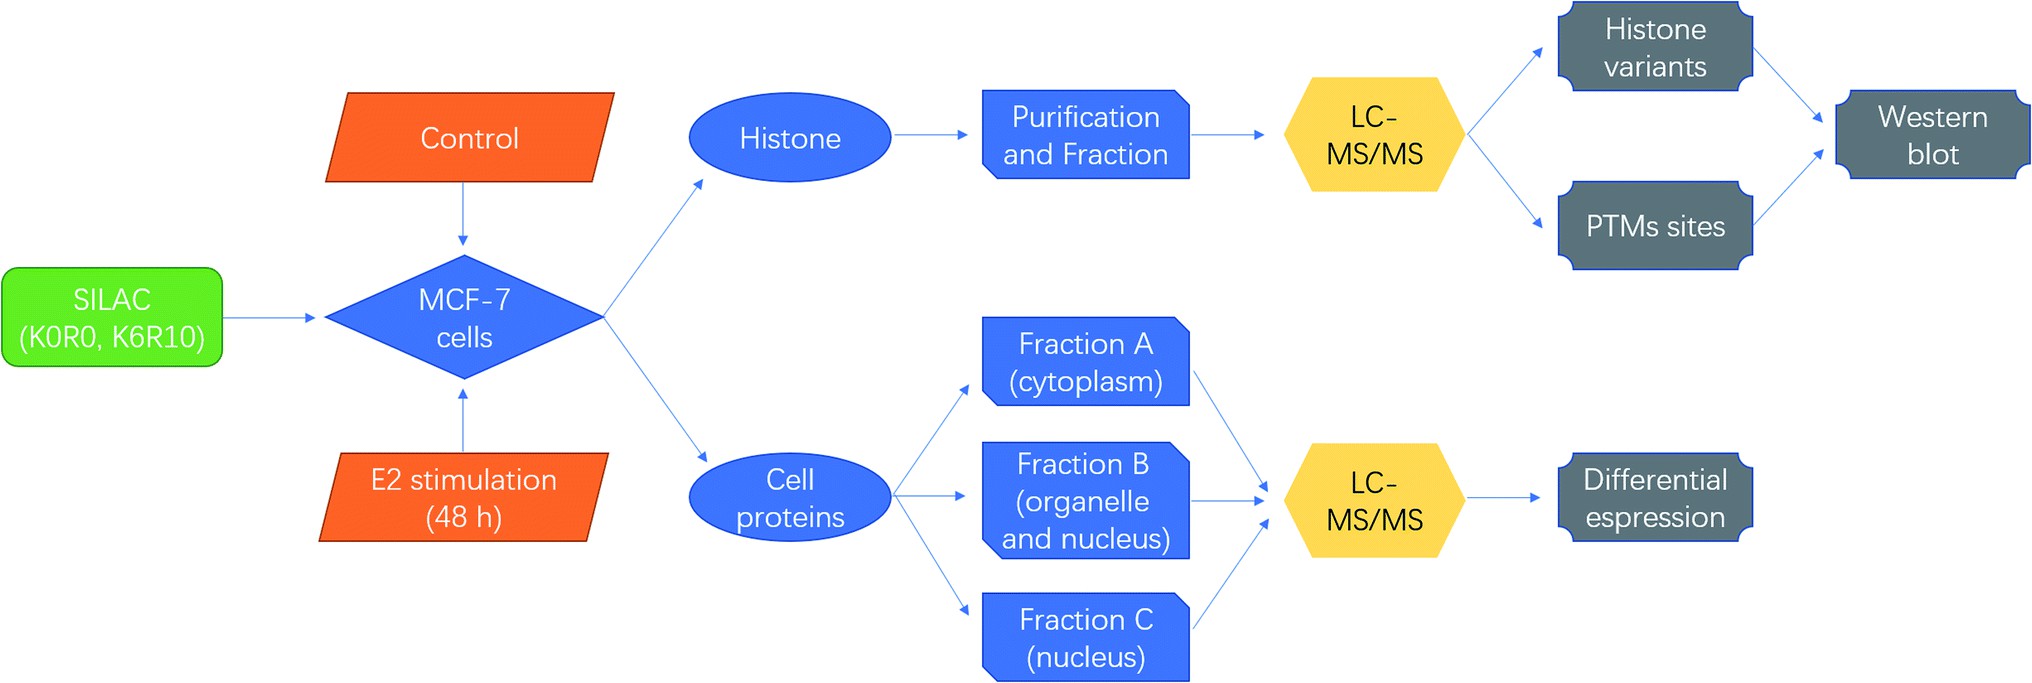 Figure 5. Schematic diagrams for quantitative proteomics of histone modifications in MCF-7 cells under estradiol stimulation (Hu Y, et al., 2021).
Select Service
References
- Huang H, et al. Quantitative proteomic analysis of histone modifications. Chemical reviews, 2015, 115(6): 2376-2418. DOI: 10.1021/cr500491u
- Anand S, et al. Label-based and label-free strategies for protein quantitation. Proteome bioinformatics, 2017: 31-43. DOI: 10.1007/978-1-4939-6740-7_4
- Noberini R, Robusti G, Bonaldi T. Mass spectrometry‐based characterization of histones in clinical samples: applications, progress, and challenges. The FEBS Journal, 2022, 289(5): 1191-1213. DOI: 10.1111/febs.15707
- Pappireddi N, Martin L, Wühr M. A review on quantitative multiplexed proteomics. Chembiochem, 2019, 20(10): 1210-1224. DOI: 10.1002/cbic.201800650

Related Articals
Our products and services are for research use only.
