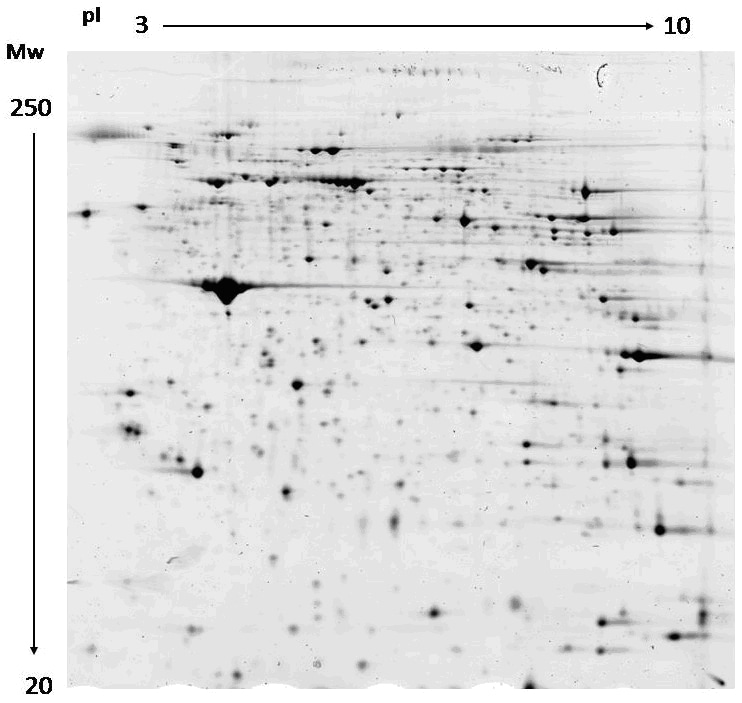
The evaluation of the spot patterns is the most demanding part of the 2-D electrophoresis technique, and the images would be analyzed comparatively and automatically. 2-D gel patterns are compared to detect qualitative and/or quantitative protein ex
For the evaluation and comparison of the complex 2-D patterns, the gel images have to be converted into digital data with a scanner or camera for further analysis with computer software. In imaging analysis, usually a pixel format of 100 mm is applied for scanning, higher pixel resolution does not improve imaging analysis and the image files will become too big to be processed in a reasonable time and take up a lot of space on the hard disk.
The scanner must be calibrated using a gray step tablet. The measured dimensionless intensity is converted into OD values or absorbance units. For accurate picking of spots according to the data of imaging analysis, the x/y positions need to be absolutely correct in the mm tolerance range. Usually the x/y data have to be calibrated for each scanner with the help of a grid. These calibration data have to be imported into the spot picker computer for each scanner used.
In imaging analysis of 2-D patterns, a background subtraction function can easily lead to errors. After many years of experience with spot volume quantification, it has been found that by defining the spot boundary at 75% of the peak maximum and calculating the spot volume for only the values above the boundary, the relative spot volume quantification comes very close to the real situation and ensures a very high reproducibility.
In normalization of the variation in protein loading and staining, the spot volumes are normalized against the total spot volume of the gel fully automatically without any user interaction.
As for calibration of pI and Mr Annotation, two ways are usually involved.
1-D calibration. Calibration curves are derived from IPG pH gradient graphs for pI determination, from the positions of co-run molecular weight markers for the second dimension Mr determination by importing a ladder.
2-D calibration. In 2-D calibration, pI and Mr values are calibrated at the same time by interpolating between known values which usually come from mass spectrometry analysis. A number of spots with known protein properties are selected, the pI and Mr Information are imported from the respective protein lists belonging to these spots.
For differential analysis it is important to be able to superimpose the spot patterns. This cannot be done directly, because typically there are local distortions caused by imperfections in gel matrix, variations in gel running conditions, temperature effects, uneven focusing, and polymerization issues. Formerly spot matching tried to find corresponding spots in pairs of gels, while for automatic matching it is more efficient to search for pairs of features, using spot clusters, spot shapes, sizes, and positions together. However, even this feature-based matching can sometimes produce mismatches, therefore it is necessary to control this process by visual inspection, and to perform corrections with setting landmarks.