- Service Details
- Case Study
- Demo Results
- FAQ
What Is Central Carbon Metabolism
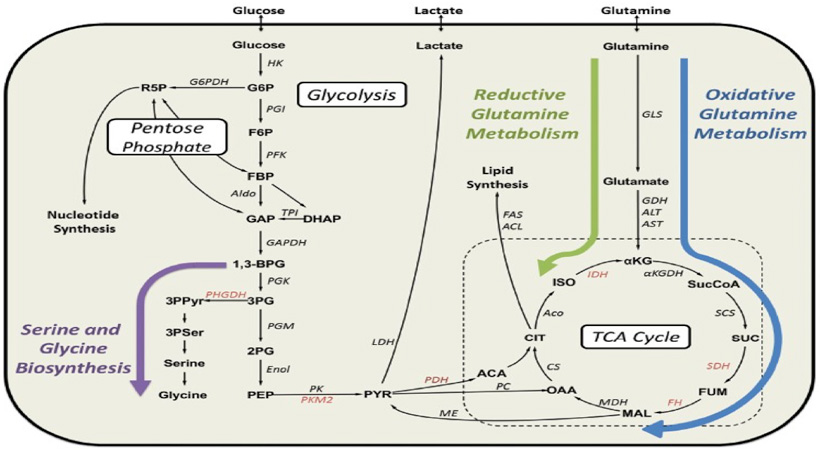
Central Carbon Metabolism (CCM) pathways involve dozens of metabolites, including those in the tricarboxylic acid cycle (TCA) primarily involved with glucose, glycolysis pathway (EMP), and pentose phosphate pathway (PPP). These pathways collectively enable the breakdown of glucose and other carbon sources, the production of reducing equivalents (NADH and FADH2), and the generation of ATP through substrate-level phosphorylation and oxidative phosphorylation. Central Carbon Metabolism is the main source of energy for organisms and provides precursor molecules for other metabolic processes. Redox reactions are among the major chemical reactions, and oxidoreductases are enzymes responsible for catalyzing these reactions. Oxidoreductases play a crucial role in pathways such as the TCA cycle and the PPP. Glucose, the most important energy substrate, is involved in oxidative phosphorylation (its main function), provides carbon sources for lipid and protein synthesis, and contributes to the formation of glycogen and other physiological functions. Glucose metabolism abnormalities can lead to various diseases in organisms, such as diabetes and its complications. Additionally, diseases like favism, diabetic atherosclerosis, gestational glucose metabolism disorders, and liver diseases are closely related to abnormal glucose metabolism. Lactic acid and pyruvic acid abnormalities are likely associated with the glycolysis pathway. Some intermediates in glycolysis pathways also serve as precursors and building blocks for lipid and amino acid synthesis. Furthermore, the preference of cells for anaerobic respiration over normal aerobic oxidation is an important factor in distinguishing the presence of tumors.
Key Pathways in Central Carbon Metabolism
Glycolysis pathway (EMP): This pathway is responsible for the breakdown of glucose into pyruvate, generating ATP and NADH in the process. Glycolysis serves as a central hub for energy production in cells.
Tricarboxylic Acid Cycle (TCA): Also known as the Krebs cycle or citric acid cycle, the TCA cycle completes the oxidation of glucose-derived pyruvate, generating high-energy electron carriers (NADH and FADH2) and producing ATP.
Pentose Phosphate Pathway (PPP): The PPP plays a vital role in generating pentose sugars and reducing equivalents (NADPH), which are essential for nucleotide synthesis and antioxidant defense mechanisms.
Our Central Carbon Metabolism Analysis Platform
LC–MS/MS platform enable simultaneous relative and absolute quantification of multiple metabolites in a biological system. The results are widely used for biomarker discovery by investigating the relative changes in metabolite concentrations. The resulting data have been widely used to for biomarker discovery. By providing the exact molecular weights and retention time, LC–MS/MS techniques serves as a powerful analytical tool for identification and quantification of small molecules (metabolites). Creative Proteomics has established sensitive, reliable, and accurate LC-MS/MS method for quantification of metabolites in central carbon metabolism pathway. Additional, by using stable isotopes, metabolic flux analysis (MFA) can identify and quantitatively estimate the metabolism through metabolic pathways by observing the position of the isotopic label along the metabolic pathways.
This definition comes into being because of the comprehensive investigations with carbohydrates and extensive experimental elucidation of the structure of the central carbon metabolism and the metabolic network. There are minor variations depending on the ecological niche the organism lives. In some species such as saccharolytic archaea, modified nonphosphorylated ED pathways is known to take the place of the conventional EMP pathway.
Service Flow
The six carbon fixation pathways are as below. (1) Reductive pentose phosphate cycle (calvin cycle) in plants and cyanobacteria taking part in oxygenic photosynthesis. (2) Reductive citrate cycle exist in photosynthetic green sulfur bacteria and some chemolithoautotrophs. (3) 3-hydroxypropionate bi-cycle found in photosynthetic green nonsulfur bacteria. (4) Hydroxypropionate-hydroxybutyrate cycle in Crenarchaeota. (5) Dicarboxylate-hydroxybutyrate cycle also in Crenarchaeota. And (6) reductive acetyl-CoA pathway occurs in methanogenic bacteria.
With the assistance of a complex series of enzymes, central carbon metabolism converts sugars into precursors for metabolism, which are used to produce the entire biomass of the cell. The structure of central carbon metabolism follows the optimality principle. It is found that central carbon metabolism is a minimal walk between the 12 precursor metabolites essential for biomass and one precursor needed for the ATP balance in glycolysis. Each pair of consecutive precursors in the central carbon metabolism network is linked by shortest enzymatic reactions. At the same time, input sugars converts precursors with the minimal number of possible enzymatic paths.
LC–MS/MS platform enable simultaneous relative and absolute quantification of multiple metabolites in a biological system. The results are widely used for biomarker discovery by investigating the relative changes in metabolite concentrations. The resulting data have been widely used to for biomarker discovery. By providing the exact molecular weights and retention time, LC–MS/MS techniques serves as a powerful analytical tool for identification and quantification of small molecules (metabolites). Creative Proteomics has established sensitive, reliable, and accurate HPLC-MS/MS method for quantification of metabolites in central carbon metabolism pathway.
Platform
- LC-MS/MS
Summary
- Identification and quantification of metabolites in Central Carbon Metabolism by HPLC-MS/MS
| Glycolysis Pathway Metabolites Quantified in This Service | |
|---|---|
| 1,3 phosphate glycerate/2,3 phosphate glycerate | 3 phosphate glcerate/2 phosphate glycerate |
| Fructose 6 phoshpate | Fructose 1 phoshpate |
| Glucose | Glucose 6 phosphate |
| Phosphoenol pyruvate | Pyruvate |
| TCA Cycle Metabolites Quantified in This Service | ||
|---|---|---|
| Acetyl-CoA | Acetyl-P | ADP |
| AMP | ATP | cAMP |
| Citric acid | DL-α-OH-glutaric acid | Erythrose-4-P |
| Fumaric acid | GDP | GTP |
| Glycolic acid | Isocitric acid | Lactic acid |
| Malic acid | Malonyl-CoA | Mannose-1-P |
| Mannose-6-P | NAD+ | NADH |
| NADP+ | NADPH | Oxaloacetate |
| Phosphoenolpyruvate (PEP) | Pyruvic acid | Ribose-5-P |
| Ribulose-5P | Sedoheptulose-7P | Succinic acid |
| Succinyl-CoA | UDP | UDP-glucose |
| Xylose-5-P | α-Ketoglutaric acid | |
| Pentose Phosphate Pathway Metabolites Quantified in This Service | ||
|---|---|---|
| Fructose-6-phosphate | Glucose | Glucose-6-phosphate |
| NADP | NADPH | Ribulose-5-phosphate |
| Ribose-5-phosphate | 6-phosphogluconate | 6-phosphogluconolactone |
Sample Requirement
| Sample | Minimum amount |
|---|---|
| Animal and clinical tissue samples | 5-10 mg |
| Blood samples (serum, plasma and whole blood) | 10 μL |
| Urine samples | 10 μL |
| Stool and intestinal contents | 10mg |
| Body fluid samples (cerebrospinal fluid, saliva, etc.) | 5-10 μL |
| Plant tissue samples (roots, stems, leaves flowers and fruits, etc.) | 10 mg |
| Cells and microbial organisms | 1*10⋀5 cells |
| Culture media and fermentation broth | 10 μL |
Report
- A detailed technical report will be provided at the end of the whole project, including the experiment procedure, MS/MS instrument parameters
- Analytes are reported as uM or ug/mg (tissue), and CV's are generally<10%
- The name of the analytes, abbreviation, formula, molecular weight and CAS# would also be included in the report.
With integrated set of separation, characterization, identification and quantification systems featured with excellent robustness & reproducibility, high and ultra-sensitivity, Creative Proteomics provides reliable, rapid and cost-effective central carbon metabolism metabolites targeted metabolomics services.
Impact of Up- and Downregulation of Metabolites and Mitochondrial Content on pH and Color of the Longissimus Muscle from Normal-pH and Dark-Cutting Beef
Journal: Journal of Agricultural and Food Chemistry
Published: 2020
Abstract
This case study aims to investigate the metabolic alterations associated with energy metabolism such as TCA cycle, glutaminolysis, and fatty acid β-oxidation in mice fed a high-fat diet (HFD) using gas chromatography-mass spectrometry (GC-MS). By employing metabolomic profiling, the study aims to identify changes in metabolite levels associated with obesity and high-fat diet consumption in mice.
Results
1. Animal Model and Experimental Design
Obese mice were induced by feeding them a high-fat diet, while a control group received a normal diet. Tissue samples, including liver and muscle, were collected from both groups for subsequent GC-MS analysis.
 Body weight gain for mice fed HFD diet and control chow over 8 weeks.
2. Quantitation by GCMS of energy metabolites
Metabolites involved in energy metabolism pathways, such as glycolysis, the tricarboxylic acid (TCA) cycle, and fatty acid metabolism, were analyzed using GC-MS. The analysis aimed to identify and quantify metabolite changes in response to the high-fat diet.
 Quantitation by GCMS of energy metabolites.
3. Differential Metabolite Profiles
Significant differences were observed in the metabolite profiles between the control and high-fat diet groups. Several metabolites showed altered levels in the obese mice compared to the control group, indicating metabolic adaptations in response to the high-fat diet.
Effect of high-fat diet on serum and hepatic energy metabolites
 Changes for the serum energy metabolite/IS ratios for HFD (H)- and control chow diet (C)-fed mice (n = 5).
 Representation of the TCA cycle and anaplerotic energy metabolites, showing metabolite levels after HFD (H) and control chow (C) feeding to 8 week-old mice for 8 weeks.
4. Specific Metabolic Changes
The study quantitates 13 TCA and accessory metabolites in serum and liver. associated with high-fat diet-induced obesity, including increased levels of fatty acids and alterations in glucose metabolism. These findings shed light on the metabolic adaptations that occur in response to a high-fat diet and contribute to the development of obesity.
 The results of targeted TCA intermediates in serum and liver.
Conclusions
This case study demonstrates the utility of GC-MS-based metabolic profiling in understanding the metabolic alterations associated with obesity and high-fat diet consumption in mice. Using this method, researchers gained valuable insights into hepatic energy metabolism by analyzing serum and liver tissue from mice fed HFD and a control chow diet.The findings provide valuable insights into the underlying metabolic mechanisms involved in obesity-related metabolic disorders. Metabolomic profiling can serve as a powerful tool for studying metabolic changes and potential therapeutic targets in the context of high-fat diet-induced obesity.
 Examples of F6P, G6P, F1P, and G1P separation
 TIC plot of partial glycan
 Reference to some glycan substances standard curve
| No. | Metabolites | linear range(ug/ml) | R2 | RSD(%,n=6) |
|---|---|---|---|---|
| 1 | Lyxose | 0.02-0.5 | 0.99969 | 3.86 |
| 2 | Trehalose | 0.02-0.5 | 0.99924 | 5.97 |
| 3 | Mannose | 0.02-2 | 0.99942 | 9.05 |
| 4 | Lactic acid | 0.02-2 | 0.99946 | 8.63 |
| 5 | Inositol | 0.5-20 | 0.99967 | 4.37 |
| 6 | Citric acid | 2-100 | 0.99903 | 9.69 |
| 7 | Fructose | 10-200 | 0.99903 | 6.54 |
Reference for the determination parameters of some glycan
What is Central Carbon Metabolism Analysis by LC-MS/MS?
Central Carbon Metabolism Analysis by LC-MS/MS refers to the application of liquid chromatography-tandem mass spectrometry (LC-MS/MS) techniques to study the dynamics and quantification of metabolites involved in central carbon metabolism pathways. It allows for the measurement of metabolite concentrations, isotopic labeling patterns, and metabolic fluxes in these pathways.
How does LC-MS/MS enable the analysis of central carbon metabolism?
LC-MS/MS combines liquid chromatography, which separates metabolites based on their physicochemical properties, with tandem mass spectrometry, which provides accurate and sensitive quantification of metabolites. LC separates the metabolites, and MS/MS detects and quantifies them based on their mass-to-charge ratios (m/z) and fragmentation patterns.
What types of metabolites can be analyzed using LC-MS/MS for Central Carbon Metabolism Analysis?
LC-MS/MS allows for the analysis of a wide range of metabolites involved in central carbon metabolism, including sugars, organic acids, amino acids, nucleotides, and lipids. It offers the ability to measure both polar and nonpolar metabolites, providing a comprehensive view of the metabolic pathways.
How is LC-MS/MS used to study metabolic fluxes in central carbon metabolism?
LC-MS/MS can be combined with stable isotope labeling techniques to trace the fate of isotopically labeled substrates, such as ^13C-labeled glucose, in central carbon metabolism. By analyzing the isotopic labeling patterns of metabolites, LC-MS/MS allows for the quantification of metabolic fluxes and the determination of pathway activities and contributions of different carbon sources.
What is targeted metabolomics in the context of Central Carbon Metabolism Analysis by LC-MS/MS?
Targeted metabolomics using LC-MS/MS involves the selective detection and quantification of specific metabolites or a predefined set of metabolites within a biological sample. It allows for the precise measurement of metabolite concentrations and isotopic labeling in central carbon metabolism pathways of interest.
What are the advantages of Central Carbon Metabolism Analysis by LC-MS/MS?
Central Carbon Metabolism Analysis by LC-MS/MS provides high sensitivity, accuracy, and selectivity in metabolite quantification. It enables the comprehensive analysis of a wide range of metabolites involved in central carbon metabolism, providing valuable insights into metabolic pathways, metabolic fluxes, and the impact of genetic or environmental factors on cellular metabolism.
Reference
- Metabolic profiling by gas chromatographymass spectrometry of energymetabolism in high-fat diet-fed obese mice. Plos One. 2017.