What is SPR
Surface Plasmon Resonance (SPR) is a distinctive optical phenomenon that arises when a metal layer is interposed between two media with contrasting refractive indices. This event occurs when light undergoes total internal reflection at the interface between glass and the metal film, causing the incident light to generate surface plasmons--electron density waves--in the metal. This, in turn, triggers an evanescent wave with attenuated energy. Under specific conditions of certain incident angles or wavelengths, the intensity of the reflected light could be perceivably weakened or even drop to zero at a unique incident angle, referred to as the SPR angle.
The SPR angle is particularly sensitive to the refractive index of the medium adhering to the metal film surface. Consequently, when the characteristics of this surface medium change or the binding quantity alters, there will be a corresponding shift in the resonance angle. Therefore, this approach can be employed to analyze equilibrium constants, thermodynamic constants, and rate constants when there is an interaction between biomolecules.
The Biacore T200, among the most frequently-utilized models, was developed utilizing the aforementioned technology. The core components of the Biacore T200 include the SPR optical detector, the microfluidic system (IFC), and the sensor chip. The IFC comprises four flow cells that can be independently, paired, or sequentially employed, depending on the experimental purpose. A metallic film is affixed to the sensor chip surface, and light radiates into a low refractive index medium (sample pool) from a high refractive index medium (glass layer) via a prism. Large molecules coupled to the metal film's surface cause a refractive index change in the sample pool, thereby altering the SPR angle. The subsequent SPR optical detector-generated signal alterations are depicted in Figure 1. Biacore operates like a high-precision optical balance: through SPR principle-based signal amplification, it enables real-time, label-free analysis of active molecule interactions. It can detect substance changes on the chip surface of 1pg/mm2 and can recognize affinity ranges ranging from 10-3 to 10-9 M.
You may interested in
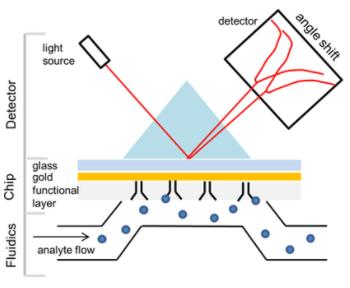 Figure 1. SPR principle (Pavel Damborský et al,. 2016)
SPR technology can play an integral role across various stages of the lifecycle of antibody drugs. In the early stages of research and development, SPR can be employed to screen target antibodies and identify candidate molecules. During the production phase, SPR serves a pivotal role in the characterization of antibody drugs, encompassing, but not limited to, epitope analysis, affinity analysis, and the quantification of active substances. In the later stages, specifically in aspects of quality control, if appropriate system suitability standards are established, method validation can be executed with SPR, making contributions to product release and stability studies.
Experimental Procedures and Methods for SPR
SPR experimentation offers a wide purview of possible applications, including specificity analysis, affinity determination, kinetics analysis, and concentration measurement. Generally, SPR experimental procedures are structured around three core processes: Immobilization, Association and Dissociation, and Regeneration. Efficient systematization of these steps forms the bedrock for successful SPR experimentation and subsequent data analysis.
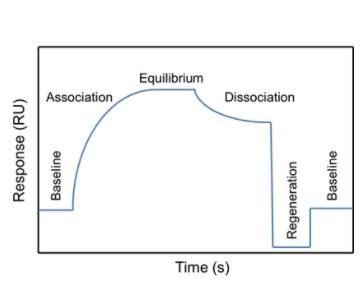 Figure 2. Typical SPR sensorgram showing the steps of an analytical cycle (Pavel Damborský et al,. 2016)
Immobilization
The immobilization process involves the interaction between a molecule fixed on the chip surface, referred to as the ligand, and a molecule that flows over the chip surface, known as the analyte. There are two types of immobilization - direct and indirect. Direct immobilization is primarily achieved through amino coupling, while indirect immobilization utilizes a capture method, covalently coupling the capture molecule to the chip surface and capturing the ligand through the affinity interaction between the capture molecule and the ligand.
The amount of ligand immobilized significantly influences the binding capacity between the chip surface and the analyte. The specific level of immobilization varies depending on the experiment's objective. Steady-state analysis, concentration tests, and specificity experiments usually require a higher level of immobilization, while kinetic analysis requires a relatively lower level. The calculation of the amount of immobilization can be performed using the following formulae:
Rmax=(MWA/MWL)ⅹRLⅹSm (Equation 1)
RL=Rmaxⅹ(1/Sm) ⅹ(MWL/MWA) (Equation 2)
Here, Rmax represents the response unit at maximum theoretical binding, usually set at 100RU (assuming the chip surface is 100% activated and completely bound with the analyte). RL represents the response unit of the immobilized ligand molecules. MWA is related to the molecular weight of the analyte, and MWL is associated with the molecular weight of the immobilized ligand molecules. Sm represents the stoichiometric ratio.
After the ligand immobilization is completed, it is crucial to test the activity and stability of the ligand to ensure that the immobilization process has not deactivated the ligand.
Association and Dissociation
Once the ligand is coupled to the chip surface, a series of analyte concentration gradients can be set to bind to the ligand surface, from which the affinity data can be calculated. Setting the appropriate reference channels can better characterize the specificity of the molecule. SPR methods utilize a double reference system, which involves subtracting the reference channel signal and the analyte signal at zero concentration from the experimental channel signal. If there is non-specific binding on the chip surface, it will affect the experimental results. Some methods for reducing non-specific binding are provided by USP<1105>:
Table 1. Reducing non-specific binding
| Reason | Solution |
| Experimental Design | 1. Optimize the running buffer |
| a) Increase salt concentration (150mM to 500mM) | |
| b) Add surfactant (0.001% to 0.05%) | |
| c) Exchange the sample into the running buffer | |
| 2. Change the coupling method of ligand molecules | |
| 3. Evaluate the quality of the ligand | |
| 4. Increase or decrease the temperature of the reaction chamber | |
| Chip Surface Selection | 1. Change the characteristics of the chip surface |
| a) Reduce ion interactions | |
| b) Evaluate the hydrophobic or hydrophilic characteristics of the surface | |
| c) Couple a non-functional ligand in the reference channel | |
| 2. Pre-couple amino acids or PEG | |
| 3. Replace the blocking molecule | |
| Sample Additives | 1. Add molecules to the sample that reduce non-specific binding |
| a) Increase ion strength in the running buffer and sample (150mM to 500mM) | |
| b) Add surfactant to the running buffer and sample (0.001% to 0.05%) | |
| c) Add carboxymethyl cellulose glucan (1~10mg/mL, only for glucan surface) | |
| 2. Optimize sample buffer, add components beneficial for activity | |
| 3. Evaluate the quality of the analyte |
Real-time monitoring of the chip surface during the binding dissociation process is achievable through response values. When the binding response value far exceeds the calculated Rmax value, it suggests the presence of phenomena such as incorrect stoichiometry, the aggregation of the analyte, or non-specific binding of the analyte to the chip surface. When the binding response value is far below the Rmax value (≤10% Rmax), it indicates that the analyte concentration is too low, or the ligand activity is low.
Regeneration
The process of regeneration, which constitutes an integral part of Surface Plasmon Resonance (SPR) experiments, facilitates the removal of analytes bound in the previous stages, thereby preparing the system for the subsequent rounds of bonding and dissociation. Notably, the majority of molecular interactions that take place are non-covalent, including hydrogen bonds, ionic bonds, Van der Waals forces, and hydrophobic interactions.
The expectation in an ideal regeneration procedure is to disrupt the existing ligand-analyte interactions, thereby facilitating the complete disassociation of the analyte from the ligand, without inflicting any harm on the ligand's activity. Alternatively, the entire complex of the ligand-analyte might need to be detached from the surface of the chip.
Regeneration may involve several types of agents, including acidic solutions, alkaline solutions, chaotropic agents, surfactants, hydrophobic agents, and even some forms of metal chelating agents. Ordinarily, for antibodies and proteins, a concentration of 10mM Glycine with a pH value in the range of 1.5 to 3.0 is the preferred choice for the regeneration agent.
The effectiveness of the regeneration can be determined by comparing the signals before and after the regeneration process at the baseline level. In a scenario where the regeneration appears incomplete, there could be a need to optimize the conditions for regeneration or to adjust the SPR method employed.
Principles of Data and Analysis
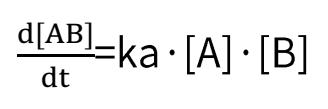
Deducible from the SPR association-dissociation curves are the binding dissociation constant (K_D) and kinetic data (binding and dissociation rates) indicative of the interaction between the ligand and the analyte. Ligand A binding to analyte B adheres to the following formula:

Binding rate:
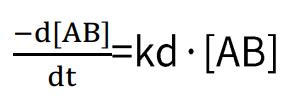
Dissociation rate:
By combining these two formulas, we obtain:
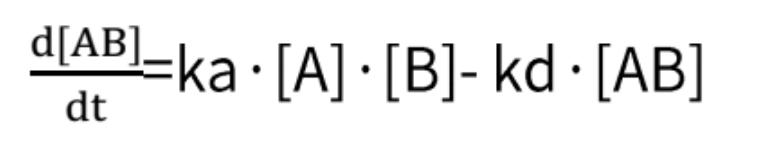
In which R constitutes the binding signal value at any given concentration of the analyte, and C corresponds to the concentration value of the analyte.
During the process, ka, kd, and Rmax can be ascertained from the subsequent formulas:
Binding:
Dissociation:
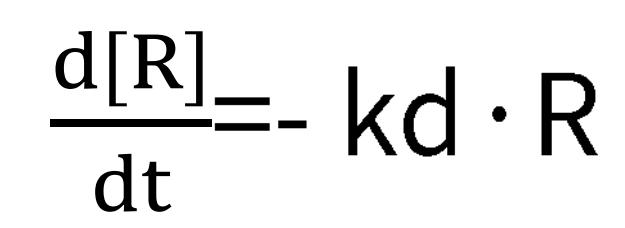
Under dissociative conditions, the analyte concentration dwindles to zero, hence, the rate equation solely correlates with the dissociation rate, kd, and the signal value, R. Accordingly, by setting a series of analyte concentration gradients in an SPR experiment, we can compute the values of ka, kd, and KD. When the binding of the analyte and ligand can reach a saturation point, that is, under steady-state equilibrium, the binding rate is equivalent to the dissociation rate. Thus we have:
Subsequently, the equilibrium dissociation constant can be computed outright:
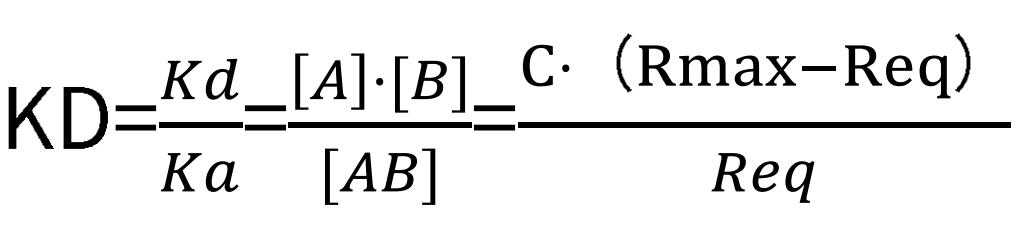
where Req represents the signal value under the condition that a certain concentration of the analyte has reached a saturation state, and C corresponds to the analyte concentration value.
Applications of SPR Technology in Antibody Drug Analysis
The mechanism of action (MOA) of antibody drugs necessitates elucidating their interactions with Fc receptors, target antigens, and various cell cytokines/receptors. In this context, SPR technology has distinct advantages, as it can real-time analyze the dynamic and steady-state behaviors between molecules, including association and dissociation rates. Given the unique properties of different antibody drugs, they present distinctive binding-dissociation curves on SPR instrumentation. For molecules that easily reach saturation, their binding-dissociation constants can be directly calculated using a steady-state model. For those where binding does not reach saturation, the binding-dissociation constant can be accurately calculated using the KD=kd/ka formula. This analytical method is crucial for a deep understanding of the mechanism of action of antibody drugs and for evaluating their therapeutic efficacy.
You may interested in
Application of SPR Technology in Antibody Characterization
The common IgG subtype of antibody drugs is IgG1, whose structural characteristics endow it with many functions. The two Fab ends of IgG1 can bind to antigens, and its Fc portion can interact with different types of Fc receptors (such as FcγR and FcRn), thereby exerting a variety of effector functions. Found predominantly on the surface of immune cells, FcγRs mediate cell immune responses, enabling antibody drugs to generate antibody-dependent cellular cytotoxicity (ADCC) and antibody-dependent cellular phagocytosis (ADCP). On the other hand, FcRn affects antibody half-life through its interaction with antibodies. Moreover, IgG1 can bind to the complement molecule C1q, triggering complement-dependent cytotoxicity (CDC). Modifications at IgG1's Fc portion can significantly affect its binding to Fc receptors, ultimately determining the quality attributes of antibody drugs. During characterization, focus is usually on five major FcγR molecules: FcγRI, FcγRIIalpha, FcγRIIbeta, FcγRIIIalphaV158, and FcγRIIIalphaF158. These molecules exhibit differential affinities to the antibody, with dissociation constants (KD) ranging from 10^-6M to 10^-9M. Generally, the affinity order is: FcγRI > FcγRIIIalphaV158 > FcγRIIIalphaF158 > FcγRIIalpha > FcγRIIbeta. Concurrently, antibodies can bind to different FcγRs in distinct ways, with most showing fast binding and fast dissociation. In contrast, the FcγRI exhibits a relatively slower rate of dissociation with the antibody.
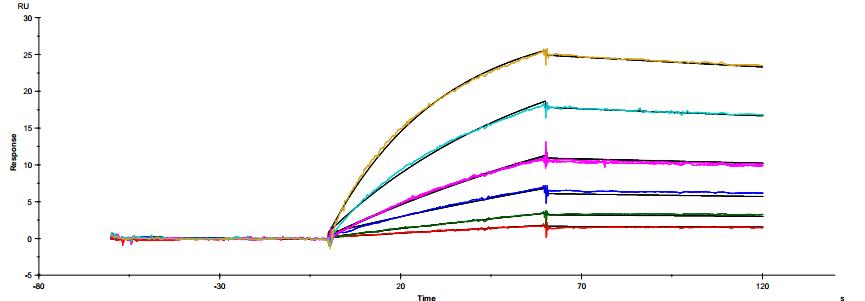 Figure 3. Antibody binding to FcγRI
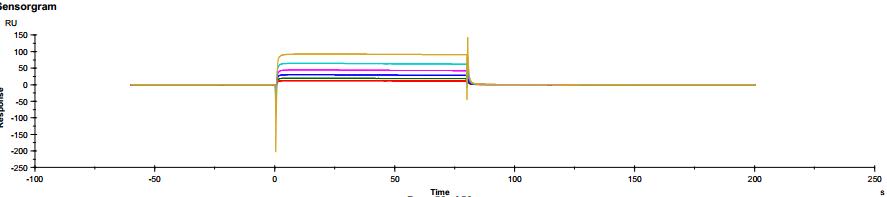 Figure 4. Antibody binding to FcγRII
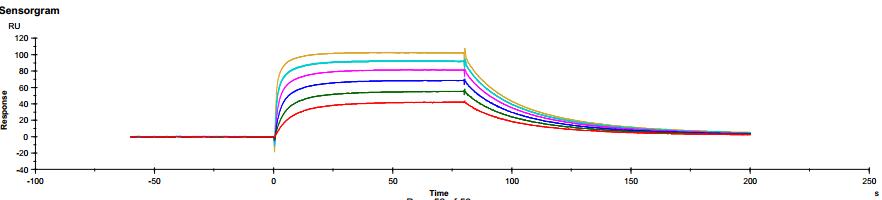 Figure 5. Antibody binding to FcγRIIIaF158
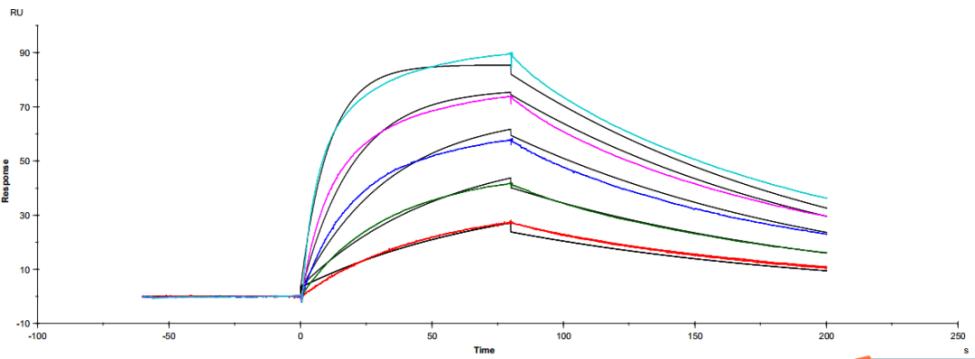 Figure 6. Antibody binding to FcγRIIIaV158
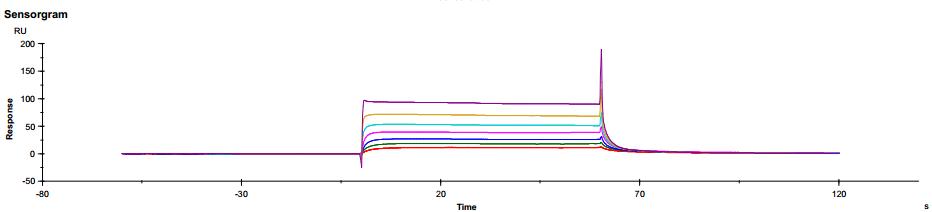 Figure 7. Antibody binding to FcRn RIIIaV158
Application of SPR technology in characterization of bispecific targets
In line with the FDA's guidelines pertaining to bispecific antibodies, it's imperative to comprehensively evaluate the quality attributes of these antibodies, which include the affinity to the target and the corresponding association and dissociation rates. These measurements can be accurately determined using SPR technology. SPR technology also holds unique advantages in characterizing the binding state of bispecific antibodies with two targets concurrently.
In the experiment, we immobilize the bispecific antibodies on the chip surface and then introduce different concentrations of Target A, followed by a fixed concentration of Target B as illustrated in Figure 8. In compliance with USP <1034> guidelines, we utilize a parallel curve model to fit the SPR data (as shown in Figure 9), thereby obtaining data on two targets simultaneously binding with the bispecific antibodies.
Compared to the traditional bridging ELISA method, SPR technology eliminates the need to introduce a detection secondary antibody, thereby effectively reducing nonspecific binding and enhancing the accuracy and sensitivity of the method. Moreover, through a single experiment, we can observe not only the binding situation of a single target with bispecific antibodies, but we can also get insights on the situation when two targets are concurrently bound. It is even possible to explore the effect of different target binding sequences on the binding outcome.
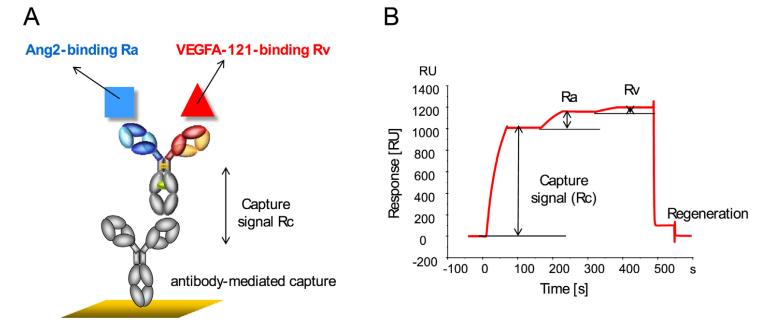 Figure 8: Binding Schemes of Bispecific Antibodies
(A) Schematic Representation of the Bispecific Antibody Binding
(B) Sensor Graph of Bispecific Antibody Binding
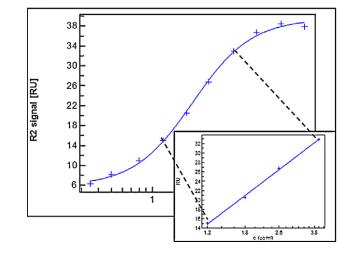 Figure 9. Parallel Curve Fitting for Bispecific Antibody Data
Potential of SPR Technology for Method Confirmation and Verification
Beyond its crucial role in characterizing antibody drugs, SPR methodology is also suitable for batch release and stability testing. The continuous auto-sampling functionality of the Biacore instrument significantly minimizes method variation during operation, making it highly applicable within GMP environments. Preliminary validation schemes for SPR methods have been developed in research, adopting a definition for relative activity and introducing a relative KD% concept, which is the KD ratio between the reference and the sample. This index was utilized to assess method accuracy and precision, inclusive of repeatability and intermediate precision, as indicated in Table 2. When affinity is too low to secure KD values, method verification can proceed through sensorgram comparison and construction of a parallel linearity model (PLM). PLM, a common method in biological activity data processing, uses steady-state signals generated by the analyte at different logarithmic concentrations for data fitting. The ratio of the reference intercept relative to the sample intercept can serve as an indicative index for relative activity.
Table 2. SPR method validation
| Qualification Criteria | Target 1 | FcyRl | FcyRlla-131R | FcyRIIb | FcyRIIIb |
| Accuracy Analysis | |||||
| Average %Recovery (≥80%) | 100.1 | 100.3 | 100.0 | 100.2 | 100.0 |
| Lower 95%Confidence Limit for the %Recovery (80%-120%) | 94.7 | 88.2 | 86.9 | 87.4 | 88.2 |
| Upper 95%Confidence Limit for the %Recovery (80%-120%) | 105.8 | 114.1 | 115.2 | 114.8 | 113.3 |
| Repeatability Analysis | |||||
| Average Standard Deviation of Original Data | 0.0 | 0.1 | 0.1 | 0.1 | 0.1 |
| Overall Repeatability %CV (≤20%) | 1.4 | 5.6 | 9.1 | 7.6 | 6.5 |
| Upper95%Confidence Limit for %CV | 2.6 | 10.8 | 21.9 | 18.1 | 15.4 |
| Intermediate Precision Analysis | |||||
| Overall %CV of Original Data(≤20%) | 6.8 | 15.8 | 10.8 | 10.4 | 9.6 |
| Upper95%Confidence Limit for %CV | 13.0 | 30.7 | 32.3 | 31.1 | 28.6 |
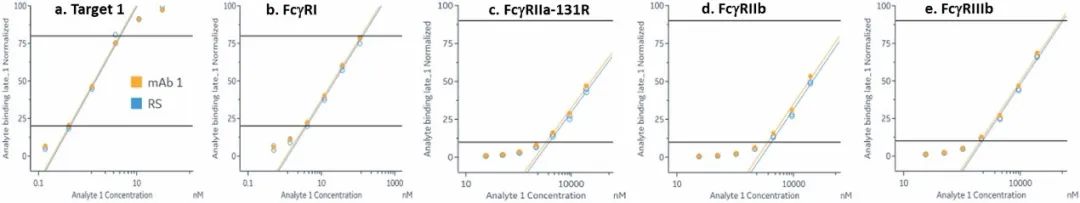 Figure 10. Fitting SPR Data Using Parallel Linearity Model
In method validation, careful reference to and adherence to the following points is essential:
Assuring that the SPR instrument and corresponding software used complies with 21 CFR Part 11 and aligns with method validation standards.
Establishing appropriate system suitability criteria for assessing the applicability of the SPR method in accordance with USP<111> and USP<1034>. For instance, scrutinizing the density of ligand immobilized on the chip surface, and KD values of the reference sample and quality control samples. If applying a four-parameter curve fit, clear guidelines should be set for the top and bottom plateaus of the curve, the span of response values, the R2 of the curve fit, as well as the parallelism for reference and quality control samples (including parameters such as relative activity and response values for negative controls).
Like with other validation methods, consistent quality control surveillance of key reagents such as ligands, analytes, and the like is paramount. Specific guidelines can be found in ICH Q2 (R1) and USP<1225>.
References
- Development of immunodetection assays for penicillins and sulfonamides in food of animal origin. Analytical and Bioanalytical Chemistry volume 403, pages1549–1566 (2012)
- USP<1105> Immunological test methods-surface plasmon resonance.
- On the Use of Surface Plasmon Resonance Biosensing to Understand IgG-FcγR Interactions. Int. J. Mol. Sci. 2021, 22(12), 6616
- FDA Biospecific antibody development programs Guidance for industry
- Utility of SPR technology in biotherapeutic development: Qualification for intended use. Analytical Biochemistry Volume 654, 1 October 2022, 114804
- Development and validation of a novel SPR-based assay principle for bispecific molecules. Journal of Pharmaceutical and Biomedical Analysis 102 (2015) 144–149
Related Services