iTRAQ-based Proteomics Analysis
Creative Proteomics offers protein quantification services using iTRAQ technology for unbiased, untargeted biomarker discovery. Their services include relative quantification of proteins from complex mixtures, enabling comparisons between normal, diseased, and drug-treated samples, as well as time-course studies and biological replicates. We also provide TMT proteomics services for analyzing up to 10 samples simultaneously, which is particularly suitable for comparing multiple sample groups and detecting dynamic biological processes.
Submit Your Request Now
×
- Define
- What We Provide
- Advantage
- iTRAQ vs. TMT
- Workflow
- Sample Requirements
- Demo
- FAQs
- Case Study
- Publications
What Is the iTRAQ Method of Proteomics?
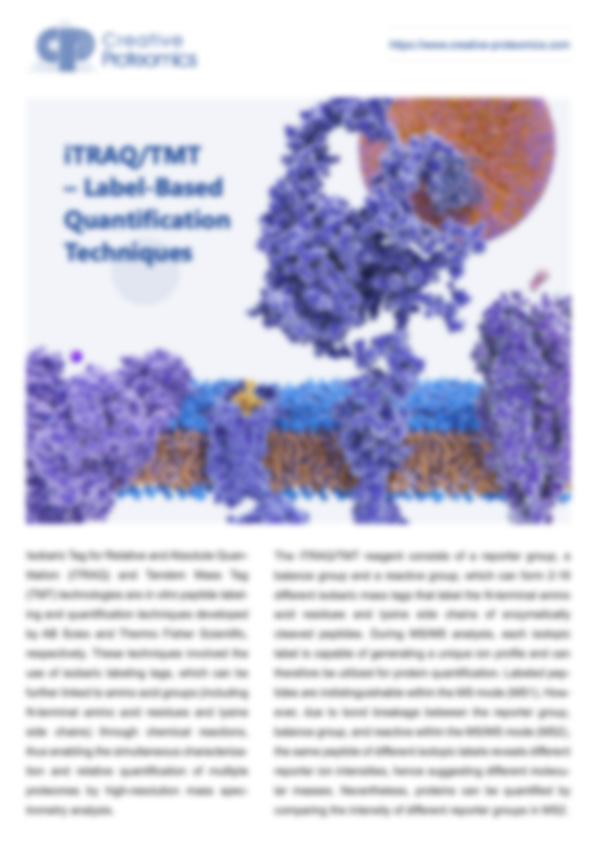
Proteomics research involves the identification and characterization of proteins to elucidate their function and interactions with other proteins. Since the composition of protein mixtures may vary across different cell types and may change under certain physiological conditions, one of the goals is often to quantify the up- or down-regulation of individual proteins. Shotgun proteomics approaches enable identification of proteins that are up-regulated or down-regulated under specific conditions and this can be studied in different cell and tissue lysates. Isobaric tags for relative and absolute quantification (iTRAQ) make it possible to both identify and quantify proteins simultaneously. iTRAQ can easily be multiplexed, enabling analysis of up to 8 different samples within the same experiment,that allows for high-throughput quantitative proteomics analysis.
What Is iTRAQ Technology
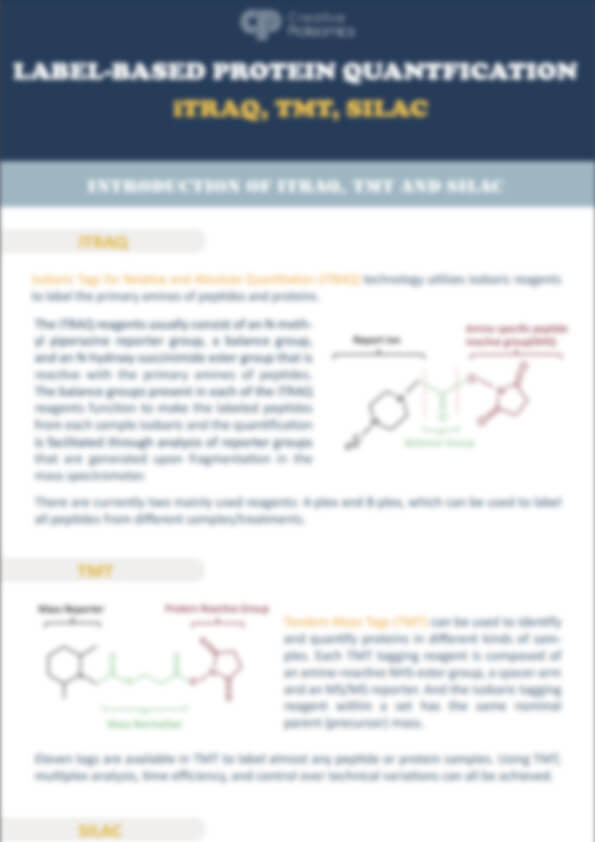
iTRAQ utilizes isobaric reagents to label the primary amines of peptides and proteins. The iTRAQ reagents usually consist of an N-methyl piperazine reporter group, a balance group, and an N-hydroxy succinimide ester group that is reactive with the primary amines of peptides. The balance groups present in each of the iTRAQ reagents function to make the labeled peptides from each sample isobaric and the quantification is facilitated through analysis of reporter groups that are generated upon fragmentation in the mass spectrometer. There are currently two mainly used reagents: 4-plex and 8-plex, which can be used to label all peptides from different samples/treatments. These samples are then pooled and usually fractionated by nano liquid chromatography and analyzed by tandem mass spectrometry (MS/MS).
What Can We Do for You
Creative Proteomics offers protein quantification service suited for unbiased untargeted biomarker discovery. Relative quantification of proteins for biomarker discovery in complex mixtures by mass spectrometry can easily and quickly be achieved using iTRAQ technology. iTRAQ is ideally suited for comparing normal, diseased, and drug-treated samples, time course studies, biological replicates and provides relative quantitation. In addition, we also provide TMT Proteomics service, which can analyze 10 samples at a time, which is especially suitable for simultaneous comparison between multiple groups of samples and dynamic detection of biological processes.
Advantage of Our iTRAQ Technique
- High Sample Throughput: Up to 16 different samples can be quantitatively compared in a single run, increasing the efficiency of sample analysis.
- Improved Reproducibility: By mixing different labels before analysis, this approach ensures better reproducibility, minimizes technical errors, and enhances detection efficiency.
- High Labeling Efficiency: The method allows nearly all proteins in a sample to be labeled, ensuring comprehensive protein coverage.
- High Sensitivity: The mass spectrometry-based detection has high sensitivity, enabling the identification and quantification of low-abundance proteins.
- Wide Applicability: This technique is versatile and can be applied to a variety of sample types, including animal, plant, microbial, clinical, bodily fluids, and cell samples.
What Is The Difference Between iTRAQ and TMT
| Comparison | Description |
|---|---|
| Tagging Chemistry | iTRAQ uses a four-plex or eight-plex set of isobaric tags, while TMT offers more multiplexing options ranging from two-plex to sixteen-plex. |
| Reporter Ion Intensity | In iTRAQ, the reporter ions are quantified based on their intensity ratios, while TMT uses the relative peak areas of the reporter ions for quantification. |
| Compatibility with Mass Spectrometry | iTRAQ has been used with various mass spectrometry instruments including Orbitrap and triple quadrupole systems. TMT is commonly used with Orbitrap-based mass spectrometers. |
| Cost Considerations | iTRAQ reagents are more cost-effective for lower multiplexing, while TMT reagents may be advantageous for larger-scale experiments due to their higher multiplexing capacity. |
| Compatibility with Downstream Analysis | iTRAQ and TMT have specific data analysis pipelines and software that can handle their respective quantification data. Compatibility with downstream analysis tools should be considered when choosing the technique. |
Workflow of iTRAQ Analysis
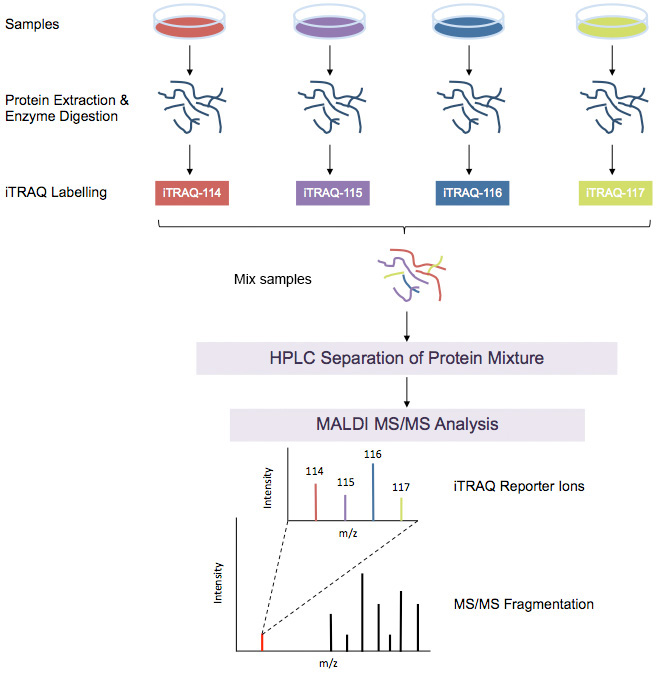
iTRAQ workflow (4-plex) is shown above. Samples to be quantified are prepared under various treatment conditions followed by cell lysis to extract proteins. After using a standard protein assay to estimate the protein concentration of each sample, proteins are digested using an enzyme, such as trypsin, to generate proteolytic peptides. Each peptide digest is labeled with a different iTRAQ reagent and then the labeled digests are combined into one sample mixture. The combined peptide mixture is analyzed by LC-MS/MS for both identification and quantification.
A database search is then performed using the fragmentation data to identify the labeled peptides and hence the corresponding proteins. The fragmentation of the attached tag generates a low molecular mass reporter ion that can be used to relatively quantify the peptides and the proteins from which they originated.
Sample Requirements for iTRAQ Proteomics
| Sample Type | Minimum Sample Amount | Notes |
|---|---|---|
| Fresh Animal Tissue (dry weight) | >=100mg | |
| Fresh Plant Tissue (dry weight) | >=2g | For samples with high polyphenol or protein content, such as plant roots, xylem, and phloem, the minimum dry weight should be >=5g. |
| Fungi (e.g., mushrooms, wood ear) (wet weight) | >=1g | |
| Yeast, mold, bacteria, and bacteriophage | 200mg | |
| Freshly cultured cells (number) | >=3-5x10^5 (cell pellet volume approximately 30ul-50ul) | |
| Blood | Serum, plasma >=500ul; Whole blood >=5ml | Freshly isolated plasma will coagulate, and protein dissolution may affect analysis. Therefore, whole blood is generally not recommended. |
| Saliva, amniotic fluid, cerebrospinal fluid, etc. | >=5ml | |
| Urine | >=50ml | Centrifuge at 1000g for 5min before sending, and remove the precipitate. |
Demo
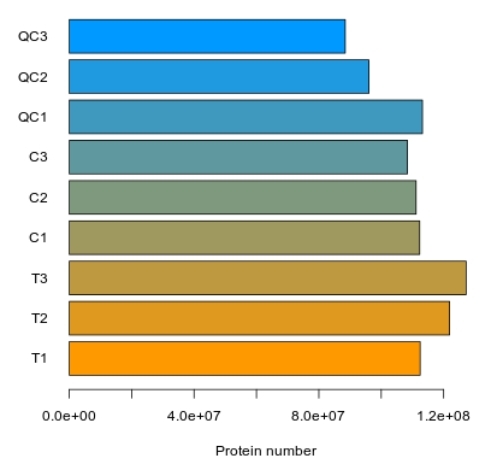
Bar Chart of Total Protein Identification

Cumulative Distribution of Protein Quantification Values

Protein Rank Plot

Distribution of Raw Protein Quantification Values

2D PCA Plot of Sample Grouping

3D PCA Plot of Sample Grouping

Pearson Correlation Analysis

Sample Hierarchical Clustering

Volcano Plot of Differential Proteins

Bar Chart of GO Enrichment for Candidate Proteins

KEGG Pathway Enrichment of Candidate Proteins
FAQs
What are the main advantages of iTRAQ?
(1) High throughput. It simultaneously identifies and quantifies the total proteins in the sample without the need to identify each spot one by one like two-dimensional electrophoresis (2DE) or DIGE. 2DE can separate 1500-2500 spots (which may correspond to the same protein), while iTRAQ can typically identify more than 2000 proteins, and routinely identify 4000-7000 proteins in tissues or cells from conventional animals.
(2) Intuitive results and flexible analysis. It provides direct qualitative and relative quantitative information of proteins, allowing quick screening of differential proteins across groups using statistical methods. It is better suited to combine with genomic or transcriptomic data, which greatly facilitates subsequent research.
(3) No restriction on sample types. Any type of sample can be used. The more comprehensive the database, the more types of proteins can be identified. For rare species, transcriptomic data can be provided for searching, making it easier to find meaningful proteins.
(4) High number of samples per run. Up to 8 samples can be analyzed in one run. If there are more than 8 samples, an internal reference can be set in each run to compare each sample with the reference and then with each other (eliminating operational, environmental, and instrument errors), enabling differential protein analysis across multiple groups of samples.
How is iTRAQ different from other proteomics technologies, and how should we choose?
Two-dimensional electrophoresis (2DE) is the earliest and most classic proteomics technology and is applicable to most samples. However, it performs poorly in separating proteins with strong acidic or basic properties or those with very large or small molecular weights. Also, since each sample must be run individually, it's challenging to avoid operational errors affecting results, potentially leading to inaccurate quantification; albeit, 2DE's service cost is relatively cheaper, making it suitable for preliminary sample differences screening.
DIGE improves upon 2DE by introducing fluorescent labels and internal standards, making quantification more accurate. However, it still separates proteins based on isoelectric points and molecular weights, so its separation of strong acidic or basic proteins, and very large or small molecular weights proteins, is not satisfactory.
iTRAQ, TMT, label-free, and SILAC all use liquid chromatography-mass spectrometry (LC-MS) technology to find differential proteins. iTRAQ and TMT are fundamentally similar in principles and detection methods, differing in their labeling reagents. TMT can analyze up to 10 different samples with its 10 labels, but due to the very close mass numbers of the labels, ultra-high-resolution mass spectrometry (such as Thermo's QE mass spectrometer) is required, leading to more signal interference, possibly affecting quantification accuracy. Label-free is an unlabeled proteomics technology; without labels, it relies on operational and mass spectrometer stability for quantification, identifying fewer proteins than iTRAQ, with less accurate quantification, but advantages in lower service fees. SILAC is a stable isotope labeling by amino acids in cell culture (SILAC)-based proteomics method, which cultivates different groups with different isotopic media for in-vivo labeling, offering higher quantification accuracy than other proteomics technologies; however, due to the lack of appropriate isotopic media, it is mostly limited to applicable mammalian cell lines.
Considering comprehensive factors like quantitation accuracy and applicability, iTRAQ technology has become the most widely used proteomics technology in recent years.
What are the sample requirements for iTRAQ experiments?
Any type of sample is acceptable. For rare species, a related species' database can be used for searching, or transcriptomic data can be provided for searching. For each run, 200 µg of protein is needed per group, but for protein quantification and pre-experiments, around 500 µg of protein is generally required per group. Our company handles protein extraction; customers simply need to provide enough raw samples.
Can different types of samples be run once in iTRAQ analysis?
No. If samples come from different species, it becomes impossible to choose a database for searching, making data analysis infeasible. Even within the same species, sample protein types and abundances may vary greatly (e.g., between plant roots and leaves), causing data interference during enzyme digestion peptide mixture runs, leading to inaccurate protein identification and quantitation.
Is repetition necessary in iTRAQ experiments?
Repetitions refer to biological, technical, and machine repetitions. Biological repetitions mean replicating samples from the same group (e.g., different plants receiving the same treatment, or serum from different patients with the same disease), typically setting three biological repetitions. Clinical samples generally require more biological repetitions (e.g., ten samples per group from disease and healthy groups). If there are many samples, mixing samples in the same group before labeling can enable one-run testing; technical repetitions involve labeling the same sample with different labels to rule out errors from protein extraction, enzymolysis, labeling, etc.; machine repetitions are sometimes planned as technical repetitions, performing two runs of the same sample to rule out operational and instrument errors. Current SCI publications usually need repetitions (of any type); otherwise, data accuracy may be questioned. From a data quality perspective, repetitions effectively help rule out unreliable proteins, facilitating WB validation and subsequent research.
Is iTRAQ's repeatability good?
iTRAQ's repeatability usually refers to quantitative repeatability, i.e., whether results are consistent between two runs on the same sample. The quality of repeatability determines data accuracy. Generally, the stochastic selection of peptides by mass spectrometry may lead to different peptides and intensities, and after software analysis, protein ratios may differ. Proteins with lower scores and ratios near the threshold might show substantial quantitative deviation, but most proteins' ratio trends remain consistent. Thus, during analysis, identified proteins are screened by FDR (False Discovery Rate) or unused value, selecting proteins over 95% (unused > 1.3) or 99% (unused > 2) confidence for analysis.
What criteria are used for selecting differential proteins?
There is no unified standard for selecting differential proteins currently, with various methods available. They might be selected based on ratios, combining ratios and standard deviations, or based on T-Test results; the current method generally involves ratio selection — differential multiples ≤0.67 and ≥1.5, sometimes also filtering by p ≤ 0.05.
Learn about other Q&A of iTRAQ.
Case Study
Control of ribosomal protein synthesis by the Microprocessor complex
Journal: Science Signaling
Published: 2021
- Background
- Materials & Methods
- Results
The synthesis of ribosomal proteins (RPs) is essential for cell growth, differentiation, and maintaining homeostasis. Ribosomes, composed of RPs and rRNAs, are central to protein synthesis. Coordinating RP production with rRNA synthesis and cell growth is critical, as disruptions can lead to diseases like Diamond-Blackfan anemia (DBA) and other ribosomopathies. Regulation of RP genes (RPGs) occurs at multiple levels, including transcription, splicing, and translation. In multicellular organisms, RPGs share a 5' terminal oligopyrimidine (5' TOP) motif that is involved in their regulation, though a universal factor regulating all RPGs has not been identified. The study proposes that the Microprocessor complex, primarily known for processing miRNAs, plays a key role in RPG regulation by resolving R-loops during transcription, promoting RP synthesis.
Animal Care and Use
All experiments adhered to IACUC guidelines at UCSF (Protocol Number: AN185765-01). Mice were genotyped using PCR with specific primers listed in Supplementary Table S2.
Flow Cytometry and Cell Sorting
Fetal liver, yolk sac, or AGM were dissected and dissociated into single-cell suspensions in FACS buffer. Cells were stained with fluorochrome-conjugated antibodies, analyzed on a FACS Verse, and sorted on a FACS Aria III.
Antibodies
Antibodies for immunoblotting included Drosha, Dgcr8, and others (detailed in Supplementary Table S2). For flow cytometry, antibodies like CD71 and Ter119 were used.
SDS-PAGE and Immunoblotting
Standard protocols were followed for SDS-PAGE and immunoblot analyses.
Cell Culture
K562 and HCT116 cells were cultured in RPMI1640 or DMEM, respectively, supplemented with FBS and antibiotics. Serum starvation was performed as needed.
Protein Quantitative Mass Spectrometry
For iTRAQ-based proteomics, total protein was extracted from sorted cells. Proteins were quantified using the BCA assay, and iTRAQ labeling was performed according to the manufacturer's protocol. Peptides were fractionated, and LC-MS/MS analysis was conducted using an Orbitrap mass spectrometer. Data were processed using Proteome Discoverer software to identify and quantify proteins.
Colony Formation Unit (CFU) Assay
E9.5 yolk sac cells were cultured in methocult medium for colony formation assays.
Quantitative RT-PCR
Total RNA from sorted cells was amplified using Nugen Ovation PicoSL WTA System V2, and RT-PCR was performed in triplicate.
Virus Production and Infection
Lenti-crispr and retrovirus systems were utilized for gene knockdown in cell lines, with infection protocols including polybrene for enhanced transduction efficiency.
RNA Isolation and Sequencing
RNA was isolated using the RNeasy Plus Mini Kit. For sequencing, libraries were generated with the KAPA RNA HyperPrep Kit and sequenced on an Illumina NovaSeq 6000.
3' RACE and Target mRNA Identification
Total RNA was extracted, and 3' RACE was performed to identify potential target mRNAs regulated by miRNAs.
Bioinformatics Analysis
RNA-Seq data were processed using HISAT2 and analyzed with DESeq2. Gene ontology and KEGG pathway analyses were conducted on differentially expressed genes.
Statistical Analysis
Statistical significance was determined using Student's t-tests and ANOVA, with p < 0.05 considered significant.
Gata1 Protein Levels and Translation
Drosha deletion resulted in a notable reduction of Gata1 protein in cKO embryos and in human erythroleukemia K562 cells with Drosha mutations. While Gata1 mRNA levels remained unchanged, the protein was absent, indicating a decrease in translation rather than degradation. Drosha KO K562 cells also showed poor differentiation into mature erythrocytes when treated with hemin.
Quantitative Proteomic Analysis
Quantitative proteomic analysis using tandem mass tags revealed a substantial decrease in ribosomal protein (RPs) levels in Drosha-depleted K562 cells. Most Rps and Rpl proteins were significantly downregulated, confirming that Drosha is crucial for maintaining RP abundance. A puromycin incorporation assay showed a 90% reduction in protein synthesis in Drosha-cKO EPCs, linking decreased RP levels to impaired global protein synthesis.
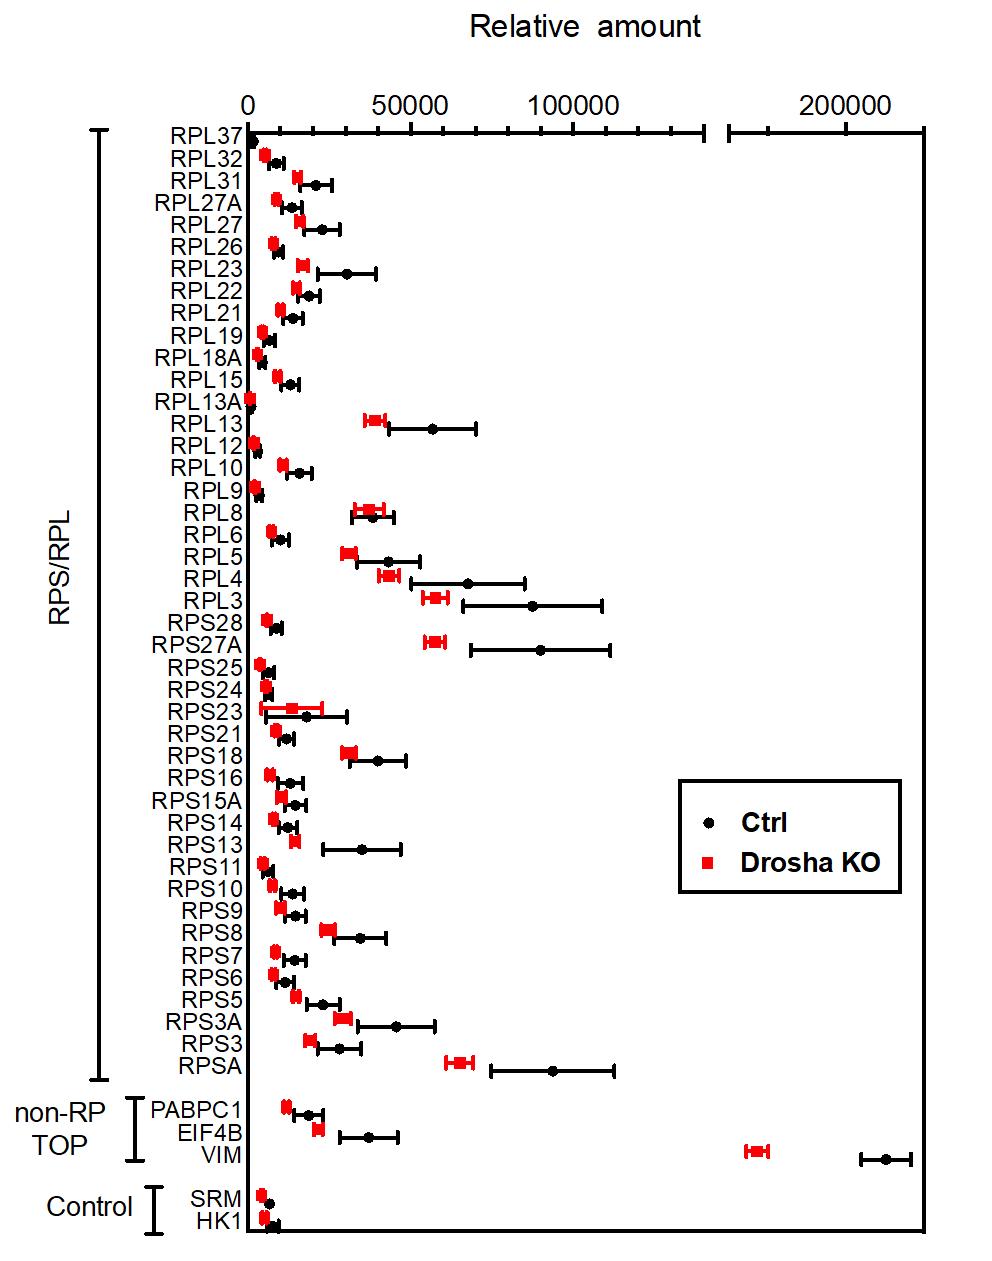 Quantitative proteomic analysis of RPs in K562 cells.
The results of tandem mass-tag (TMT)-based mass-spectrometry analysis of Ctrl and Drosha KO K562 cells were plotted as means +SEM. n=5 samples per genotype. Unpaired two-tail t-test was used for statistical analysis. Original data are in Data File S1. Non-RP TOP: non-RP proteins whose genes contain the TOP-motif at the transcription start site. Control: proteins encoded by the genes that do not contain TOP-motif.
Microprocessor Regulation of RPGs
Drosha and its partner DGCR8 were found to regulate ribosomal protein gene (RPG) expression. ChIP-seq analysis demonstrated that Drosha associates with the promoter regions of RPGs, indicating a direct regulatory role. Additionally, the Microprocessor complex was shown to facilitate transcription elongation by resolving R-loops at RPG loci.
Nutrient Starvation and Drosha Degradation
Nutrient deprivation led to a decrease in Drosha protein levels, independent of changes in Drosha mRNA. This reduction was attributed to Nedd4-mediated ubiquitination, which was confirmed by co-immunoprecipitation studies. The presence of a conserved PY motif in Drosha was necessary for its ubiquitination by Nedd4.
Reference
- Jiang, Xuan, et al. "Control of ribosomal protein synthesis by the Microprocessor complex." Science signaling 14.671 (2021): eabd2639.
Publications
Here are some publications from our clients:

- Regulation of toxic shock syndrome toxin‐1 by the accessory gene regulator in Staphylococcus aureus is mediated by the repressor of toxins. Molecular Microbiology. 2019. https://doi.org/10.1111/mmi.14351
- Control of ribosomal protein synthesis by the Microprocessor complex. Science Signaling. 2021. https://doi.org/10.1126/scisignal.abd2639
- High Abundant Protein Depletion-proteomics experiments. Nano LC-MS/MS analysis. Data analysis. Research Square. 2024. https://doi.org/10.21203/rs.3.rs-4508811/v1
- protein identification service nano LC-MS/MS. Data in Brief. 2024. https://doi.org/10.1016/j.dib.2023.109980
- Tandem mass tag (TMT) proteomics was utilized for profiling proteins in human heart tissues, LC–MS/MS service. Cell Death Discovery. 2024. https://doi.org/10.1038/s41420-024-02044-w